B2B Jobs in London

Business-to-Business (B2B)
England > London

The table below provides summary statistics for permanent job vacancies advertised in London requiring B2B skills. It includes a benchmarking guide to the annual salaries offered in vacancies that cited B2B over the 6 months leading up to 31 May 2025, comparing them to the same period in the previous two years.

6 months to
31 May 2025
Same period 2024 Same period 2023
Rank 123 289 219
Rank change year-on-year +166 -70 -72
Permanent jobs citing B2B 337 236 541
As % of all permanent jobs advertised in London 2.64% 0.98% 1.68%
As % of the Processes & Methodologies category 2.74% 1.09% 1.76%
Number of salaries quoted 149 190 416
10th Percentile £35,600 £34,375 £45,000
25th Percentile £46,250 £48,125 £47,500
Median annual salary (50th Percentile) £65,000 £71,092 £65,000
Median % change year-on-year -8.57% +9.37% -7.14%
75th Percentile £85,000 £92,188 £82,500
90th Percentile £115,000 £105,250 £96,875
England median annual salary £45,000 £45,000 £60,000
% change year-on-year - -25.00% -4.00%

All Process and Methodology Skills
London

B2B falls under the Processes and Methodologies category. For comparison with the information above, the following table provides summary statistics for all permanent job vacancies requiring process or methodology skills in London.

Permanent vacancies with a requirement for process or methodology skills 12,300 21,691 30,657
As % of all permanent jobs advertised in London 96.24% 90.27% 95.26%
Number of salaries quoted 6,989 15,892 22,392
10th Percentile £41,750 £37,500 £42,750
25th Percentile £55,500 £51,250 £55,000
Median annual salary (50th Percentile) £75,000 £70,000 £75,000
Median % change year-on-year +7.14% -6.67% +7.14%
75th Percentile £100,000 £95,000 £95,000
90th Percentile £123,750 £115,000 £116,250
England median annual salary £57,500 £55,000 £62,500
% change year-on-year +4.55% -12.00% +4.17%

B2B
Job Vacancy Trend in London

Job postings citing B2B as a proportion of all IT jobs advertised in London.
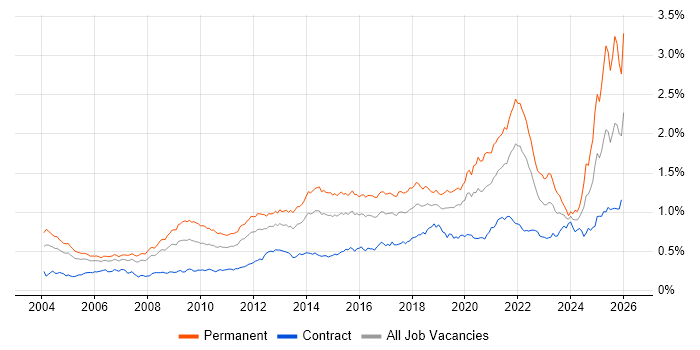
Job vacancy trend for B2B in London

B2B
Salary Trend in London

3-month moving average salary quoted in jobs citing B2B in London.

Salary trend for B2B in London

B2B
Salary Histogram in London

Salary distribution for jobs citing B2B in London over the 6 months to 31 May 2025.

Salary histogram for B2B in London

B2B
Job Locations in London

The table below looks at the demand and provides a guide to the median salaries quoted in IT jobs citing B2B within the London region over the 6 months to 31 May 2025. The 'Rank Change' column provides an indication of the change in demand within each location based on the same 6 month period last year.

Location Rank Change
on Same Period
Last Year
Matching
Permanent
IT Job Ads
Median Salary
Past 6 Months
Median Salary
% Change
on Same Period
Last Year
Live
Jobs
Central London +41 62 £70,000 -3.78% 85
South London +4 9 £67,500 +3.85% 8
East London -16 4 £55,000 - 22
North London -13 1 £50,000 +5.26% 2
West London - 1 £36,500 - 22
B2B
England

B2B
Co-occurring Skills and Capabilities in London by Category

The follow tables expand on the table above by listing co-occurrences grouped by category. The same employment type, locality and period is covered with up to 20 co-occurrences shown in each of the following categories:

Application Platforms
1 10 (2.97%) WordPress
2 6 (1.78%) CMS
3 3 (0.89%) SharePoint
4 2 (0.59%) Confluence
4 2 (0.59%) Drupal
4 2 (0.59%) Microsoft Exchange
5 1 (0.30%) Headless CMS
5 1 (0.30%) SharePoint Server
Applications
1 6 (1.78%) Microsoft Excel
2 5 (1.48%) Microsoft PowerPoint
3 3 (0.89%) Adobe Creative Suite
3 3 (0.89%) Adobe Illustrator
3 3 (0.89%) InDesign
3 3 (0.89%) Photoshop
4 2 (0.59%) MS Visio
4 2 (0.59%) Notion
5 1 (0.30%) Microsoft Office
Business Applications
1 14 (4.15%) NetSuite
2 7 (2.08%) Dynamics CRM
3 3 (0.89%) Salesforce CRM
4 2 (0.59%) Infor SunSystems
4 2 (0.59%) Shopify
5 1 (0.30%) Dynamics NAV
5 1 (0.30%) Magento
5 1 (0.30%) SAP MDG
5 1 (0.30%) SAP S/4HANA
Cloud Services
1 55 (16.32%) SaaS
2 54 (16.02%) AWS
3 45 (13.35%) Azure
4 32 (9.50%) GCP
5 18 (5.34%) Azure DevOps
6 16 (4.75%) Azure Monitor
6 16 (4.75%) Figma
7 12 (3.56%) GitHub
7 12 (3.56%) GitHub Actions
8 9 (2.67%) Google Analytics
8 9 (2.67%) Microsoft 365
9 6 (1.78%) Microsoft Copilot
9 6 (1.78%) Slack
10 5 (1.48%) Entra ID
10 5 (1.48%) IaaS
10 5 (1.48%) Power Platform
11 4 (1.19%) Anthropic Claude
11 4 (1.19%) Boomi
11 4 (1.19%) ChatGPT
11 4 (1.19%) Miro
Communications & Networking
1 3 (0.89%) Internet
2 2 (0.59%) Firewall
2 2 (0.59%) SD-WAN
2 2 (0.59%) Unified Communications
2 2 (0.59%) VoIP
2 2 (0.59%) WAN
3 1 (0.30%) 5G
3 1 (0.30%) Broadband
3 1 (0.30%) DNS
3 1 (0.30%) Intrusion Detection
3 1 (0.30%) LAN
3 1 (0.30%) MPLS
3 1 (0.30%) SAN
3 1 (0.30%) VPN
3 1 (0.30%) Wi-Fi
Database & Business Intelligence
1 13 (3.86%) MongoDB
2 12 (3.56%) MySQL
2 12 (3.56%) NoSQL
3 8 (2.37%) Looker
3 8 (2.37%) PostgreSQL
3 8 (2.37%) Tableau
4 3 (0.89%) Amazon Redshift
4 3 (0.89%) BigQuery
4 3 (0.89%) Data Warehouse
4 3 (0.89%) Mixpanel
4 3 (0.89%) Power BI
4 3 (0.89%) Snowflake Schema
5 2 (0.59%) Crystal Reports
5 2 (0.59%) DynamoDB
5 2 (0.59%) Redis
5 2 (0.59%) SQL Server
6 1 (0.30%) Amazon RDS
6 1 (0.30%) Big Data
6 1 (0.30%) Elasticsearch
6 1 (0.30%) GIS
Development Applications
1 18 (5.34%) Git
2 12 (3.56%) Gradle
3 7 (2.08%) Jenkins
3 7 (2.08%) SonarQube
4 5 (1.48%) JIRA
4 5 (1.48%) Maven
5 2 (0.59%) Visual Studio
6 1 (0.30%) Bazaar
6 1 (0.30%) Cypress.io
6 1 (0.30%) PHPUnit
6 1 (0.30%) Postman
6 1 (0.30%) SoapUI
General
1 170 (50.45%) Social Skills
2 114 (33.83%) Finance
3 96 (28.49%) Marketing
4 27 (8.01%) Games
5 26 (7.72%) Analytical Skills
6 25 (7.42%) Inclusion and Diversity
6 25 (7.42%) Publishing
7 22 (6.53%) Law
8 20 (5.93%) Advertising
9 12 (3.56%) Presentation Skills
10 10 (2.97%) Telecoms
11 9 (2.67%) Legal
11 9 (2.67%) Organisational Skills
12 8 (2.37%) Retail
13 5 (1.48%) Banking
13 5 (1.48%) Brand Awareness
13 5 (1.48%) Health Technology
13 5 (1.48%) Public Sector
14 3 (0.89%) Back Office
15 2 (0.59%) Billing
Job Titles
1 69 (20.47%) Senior
2 64 (18.99%) Business Manager
3 62 (18.40%) Business Development Manager
3 62 (18.40%) Development Manager
4 33 (9.79%) Developer
5 31 (9.20%) Senior Manager
6 26 (7.72%) Lead
7 25 (7.42%) Product Manager
8 17 (5.04%) Senior Developer
9 16 (4.75%) Senior Product Manager
10 15 (4.45%) Architect
11 14 (4.15%) Account Manager
11 14 (4.15%) Marketing Manager
11 14 (4.15%) Solutions Architect
12 12 (3.56%) Account Executive
13 11 (3.26%) Support Engineer
14 10 (2.97%) Cloud Engineer
14 10 (2.97%) Designer
15 9 (2.67%) 3rd Line Support
15 9 (2.67%) 3rd Line Support Engineer
Libraries, Frameworks & Software Standards
1 20 (5.93%) React
2 14 (4.15%) Kafka
2 14 (4.15%) RESTful
3 12 (3.56%) RabbitMQ
3 12 (3.56%) REST
4 11 (3.26%) HTML
5 9 (2.67%) CSS
6 7 (2.08%) OpenAPI
6 7 (2.08%) Spring
6 7 (2.08%) Unity (Game Engine)
7 6 (1.78%) Next.js
7 6 (1.78%) Node.js
8 5 (1.48%) Elastic Stack
9 4 (1.19%) .NET
9 4 (1.19%) GraphQL
9 4 (1.19%) React Native
10 2 (0.59%) ActiveMQ
10 2 (0.59%) EDI
10 2 (0.59%) LINQ
10 2 (0.59%) Ruby on Rails
Miscellaneous
1 83 (24.63%) Self-Motivation
2 27 (8.01%) Mobile Games
3 26 (7.72%) Social Media
4 21 (6.23%) Mobile App
5 20 (5.93%) Cloud Native
6 18 (5.34%) Legacy Systems
7 15 (4.45%) Product Ownership
8 11 (3.26%) Enterprise Software
9 10 (2.97%) Hybrid Cloud
10 8 (2.37%) Digital Media
11 4 (1.19%) Animation
11 4 (1.19%) Blog
11 4 (1.19%) CMDB
11 4 (1.19%) Onboarding
12 3 (0.89%) Distributed Systems
12 3 (0.89%) Graphic Design
12 3 (0.89%) Greenfield Project
12 3 (0.89%) Management Information System
13 2 (0.59%) Algorithms
13 2 (0.59%) Video Editing
Operating Systems
1 9 (2.67%) Android
1 9 (2.67%) Apple iOS
2 1 (0.30%) Linux
2 1 (0.30%) Mac OS
2 1 (0.30%) Unix
2 1 (0.30%) Windows
2 1 (0.30%) Windows Server 2016
Processes & Methodologies
1 95 (28.19%) B2B Sales
2 91 (27.00%) Decision-Making
3 84 (24.93%) Business Intelligence
4 82 (24.33%) Business Development
5 67 (19.88%) Analytics
6 66 (19.58%) Problem-Solving
7 56 (16.62%) OpenUP
8 54 (16.02%) Agile
9 53 (15.73%) Roadmaps
10 52 (15.43%) B2C
11 44 (13.06%) User Experience
12 41 (12.17%) Artificial Intelligence
13 36 (10.68%) Mentoring
14 35 (10.39%) DevOps
15 34 (10.09%) CI/CD
15 34 (10.09%) Fintech
16 33 (9.79%) Software Engineering
17 32 (9.50%) E-Commerce
18 29 (8.61%) Collaborative Culture
18 29 (8.61%) Digital Marketing
Programming Languages
1 40 (11.87%) SQL
2 23 (6.82%) Python
3 17 (5.04%) C#
4 14 (4.15%) Java
5 10 (2.97%) JavaScript
5 10 (2.97%) TypeScript
6 7 (2.08%) Kotlin
6 7 (2.08%) Objective-C
6 7 (2.08%) Swift
7 4 (1.19%) PowerShell
8 2 (0.59%) Apex Code
8 2 (0.59%) Ruby
8 2 (0.59%) VBA
9 1 (0.30%) ActionScript
9 1 (0.30%) ActionScript 2.0
9 1 (0.30%) C
9 1 (0.30%) C++
9 1 (0.30%) Go
9 1 (0.30%) PHP
9 1 (0.30%) T-SQL
Qualifications
1 69 (20.47%) Degree
2 18 (5.34%) Computer Science Degree
3 13 (3.86%) AWS Certification
4 10 (2.97%) Master's Degree
5 9 (2.67%) MBA
6 7 (2.08%) AWS Certified Cloud Practitioner
7 6 (1.78%) AWS Certified Solutions Architect
7 6 (1.78%) Six Sigma Black Belt
8 5 (1.48%) Security Cleared
9 3 (0.89%) Microsoft Certification
10 1 (0.30%) Azure Certification
10 1 (0.30%) CAPM
10 1 (0.30%) DBS Check
10 1 (0.30%) MRICS
10 1 (0.30%) PMI Certification
10 1 (0.30%) PMP
10 1 (0.30%) PRINCE2 Practitioner
10 1 (0.30%) SC Cleared
Quality Assurance & Compliance
1 16 (4.75%) QA
2 9 (2.67%) Accessibility
3 4 (1.19%) GDPR
3 4 (1.19%) SLA
4 3 (0.89%) Cyber Essentials
5 2 (0.59%) Cyber Essentials PLUS
5 2 (0.59%) ISO 9001
5 2 (0.59%) ISO/IEC 27001
6 1 (0.30%) Actionable Recommendations
6 1 (0.30%) Data Quality
6 1 (0.30%) PCI DSS
6 1 (0.30%) PMO
System Software
1 12 (3.56%) Docker
2 5 (1.48%) Active Directory
3 1 (0.30%) Virtual Machines
Systems Management
1 15 (4.45%) Terraform
2 13 (3.86%) Kubernetes
3 6 (1.78%) Microsoft Intune
4 5 (1.48%) Argo
4 5 (1.48%) Prometheus
5 4 (1.19%) SCCM
6 1 (0.30%) Single Sign-On
Vendors
1 46 (13.65%) Google
2 31 (9.20%) Microsoft
3 26 (7.72%) Salesforce
4 12 (3.56%) New Relic
5 9 (2.67%) SAP
6 8 (2.37%) HubSpot
7 7 (2.08%) ServiceNow
8 6 (1.78%) Adobe
8 6 (1.78%) BT
8 6 (1.78%) WooCommerce
9 5 (1.48%) Screaming Frog
10 4 (1.19%) Instagram
11 3 (0.89%) Amplitude
11 3 (0.89%) Salesforce Marketing Cloud
12 2 (0.59%) Facebook
12 2 (0.59%) Infor
12 2 (0.59%) Pardot
12 2 (0.59%) Sun
12 2 (0.59%) TikTok
12 2 (0.59%) YouTube