Logistics Jobs in London

Logistics
England > London

The table below provides summary statistics for permanent job vacancies advertised in London requiring Logistics skills. It includes a benchmarking guide to the annual salaries offered in vacancies that cited Logistics over the 6 months leading up to 26 July 2024, comparing them to the same period in the previous two years.

6 months to
26 Jul 2024
Same period 2023 Same period 2022
Rank 290 323 340
Rank change year-on-year +33 +17 +17
Permanent jobs citing Logistics 198 254 919
As % of all permanent jobs advertised in London 0.95% 0.94% 1.23%
As % of the Processes & Methodologies category 1.07% 0.99% 1.26%
Number of salaries quoted 95 167 203
10th Percentile £31,350 £32,000 £36,500
25th Percentile £36,250 £42,500 £47,500
Median annual salary (50th Percentile) £54,000 £65,000 £62,500
Median % change year-on-year -16.92% +4.00% -3.85%
75th Percentile £78,750 £84,875 £85,000
90th Percentile £96,500 £97,500 £95,000
England median annual salary £43,500 £55,000 £52,500
% change year-on-year -20.91% +4.76% -

All Process and Methodology Skills
London

Logistics falls under the Processes and Methodologies category. For comparison with the information above, the following table provides summary statistics for all permanent job vacancies requiring process or methodology skills in London.

Permanent vacancies with a requirement for process or methodology skills 18,545 25,706 72,795
As % of all permanent jobs advertised in London 89.42% 94.78% 97.04%
Number of salaries quoted 12,808 20,124 35,328
10th Percentile £39,500 £42,500 £42,500
25th Percentile £52,500 £55,000 £53,750
Median annual salary (50th Percentile) £72,500 £74,000 £70,000
Median % change year-on-year -2.03% +5.71% -
75th Percentile £95,000 £95,000 £91,732
90th Percentile £120,000 £116,250 £110,000
England median annual salary £55,000 £62,000 £60,000
% change year-on-year -11.29% +3.33% +4.35%

Logistics
Job Vacancy Trend in London

Job postings citing Logistics as a proportion of all IT jobs advertised in London.
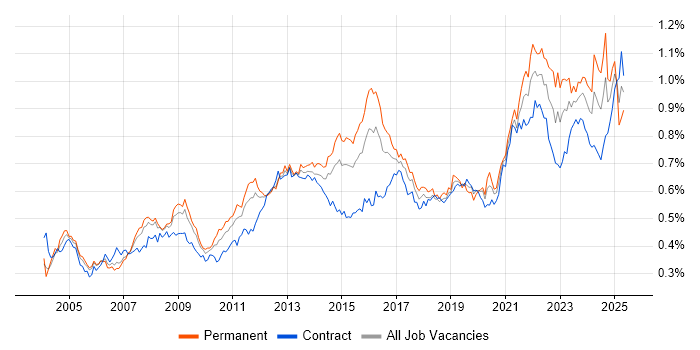
Job vacancy trend for Logistics in London

Logistics
Salary Trend in London

3-month moving average salary quoted in jobs citing Logistics in London.

Salary trend for Logistics in London

Logistics
Salary Histogram in London

Salary distribution for jobs citing Logistics in London over the 6 months to 26 July 2024.

Salary histogram for Logistics in London

Logistics
Job Locations in London

The table below looks at the demand and provides a guide to the median salaries quoted in IT jobs citing Logistics within the London region over the 6 months to 26 July 2024. The 'Rank Change' column provides an indication of the change in demand within each location based on the same 6 month period last year.

Location Rank Change
on Same Period
Last Year
Matching
Permanent
IT Job Ads
Median Salary
Past 6 Months
Median Salary
% Change
on Same Period
Last Year
Live
Jobs
Central London +35 22 £55,000 -12.00% 13
West London +1 14 £57,500 +9.52% 11
South London -25 5 £80,000 +137.04%
East London +18 2 £48,036 +20.09% 8
North London - 1 - -
Logistics
England

Logistics
Co-occurring Skills and Capabilities in London by Category

The follow tables expand on the table above by listing co-occurrences grouped by category. The same employment type, locality and period is covered with up to 20 co-occurrences shown in each of the following categories:

Application Platforms
1 19 (9.60%) SAS
2 4 (2.02%) Office Communications Server
3 3 (1.52%) CMS
3 3 (1.52%) WordPress
4 2 (1.01%) Oracle Collaboration Suite
5 1 (0.51%) Appian
5 1 (0.51%) SharePoint
Applications
1 29 (14.65%) Microsoft Excel
2 12 (6.06%) Microsoft Office
3 4 (2.02%) Microsoft PowerPoint
3 4 (2.02%) MS Visio
4 3 (1.52%) Microsoft Project
Business Applications
1 11 (5.56%) SAP S/4HANA
2 5 (2.53%) Shopify
3 4 (2.02%) SAP IBP
4 3 (1.52%) SAP Travel Management
5 2 (1.01%) Dynamics NAV
5 2 (1.01%) SAP ERP
5 2 (1.01%) SAP Oil and Gas
5 2 (1.01%) SAP PLM
5 2 (1.01%) SAP PP
6 1 (0.51%) Epicor Tropos
6 1 (0.51%) R3 Corda
6 1 (0.51%) SAP EWM
6 1 (0.51%) SAP SCM
Cloud Services
1 39 (19.70%) AWS
2 19 (9.60%) Amazon EC2
2 19 (9.60%) Amazon S3
3 14 (7.07%) Azure
4 12 (6.06%) Power Platform
5 6 (3.03%) AWS Lambda
5 6 (3.03%) Serverless
6 5 (2.53%) Dynamics 365
6 5 (2.53%) SuccessFactors
7 4 (2.02%) Amazon EKS
7 4 (2.02%) Amazon Kinesis
7 4 (2.02%) Amazon SQS
8 3 (1.52%) Azure DevOps
8 3 (1.52%) Google Analytics
8 3 (1.52%) PowerApps
8 3 (1.52%) SaaS
9 2 (1.01%) Azure Key Vault
9 2 (1.01%) Azure Service Bus
9 2 (1.01%) Google Workspace
9 2 (1.01%) Microsoft 365
Communications & Networking
1 3 (1.52%) LAN
1 3 (1.52%) WAN
2 2 (1.01%) VoIP
3 1 (0.51%) 3GPP
3 1 (0.51%) DAB
3 1 (0.51%) Internet
3 1 (0.51%) TCP/IP
3 1 (0.51%) VPN
Database & Business Intelligence
1 36 (18.18%) Tableau
2 27 (13.64%) Amazon QuickSight
2 27 (13.64%) Amazon Redshift
3 24 (12.12%) Data Mining
4 22 (11.11%) NoSQL
5 20 (10.10%) Data Warehouse
6 19 (9.60%) DynamoDB
7 10 (5.05%) Power BI
8 6 (3.03%) MS Access
9 4 (2.02%) Big Data
9 4 (2.02%) SQL Server
10 2 (1.01%) Data Lake
10 2 (1.01%) Microsoft Analysis Services
10 2 (1.01%) MongoDB
10 2 (1.01%) SQL Server Analysis Services
11 1 (0.51%) Crystal Reports
11 1 (0.51%) Elasticsearch
11 1 (0.51%) PostgreSQL
11 1 (0.51%) SQL Server Integration Services
11 1 (0.51%) SQL Server Reporting Services
Development Applications
1 15 (7.58%) Git
2 3 (1.52%) JIRA
3 2 (1.01%) PowerBuilder
3 2 (1.01%) Team Foundation Server
3 2 (1.01%) Visual Studio
General
1 79 (39.90%) Finance
2 61 (30.81%) Analytical Skills
2 61 (30.81%) Social Skills
3 37 (18.69%) Retail
4 35 (17.68%) Marketing
5 17 (8.59%) Public Sector
6 14 (7.07%) Inclusion and Diversity
7 13 (6.57%) Manufacturing
8 11 (5.56%) Pharmaceutical
8 11 (5.56%) Presentation Skills
9 10 (5.05%) Law
10 9 (4.55%) Local Government
11 8 (4.04%) Legal
12 7 (3.54%) Influencing Skills
13 6 (3.03%) Automotive
14 5 (2.53%) Organisational Skills
14 5 (2.53%) Publishing
15 3 (1.52%) Games
15 3 (1.52%) German Language
16 2 (1.01%) Banking
Job Titles
1 29 (14.65%) Senior
2 19 (9.60%) Analyst
3 17 (8.59%) Project Manager
4 15 (7.58%) Developer
5 12 (6.06%) Logistics Engineer
6 10 (5.05%) Architect
6 10 (5.05%) Junior
6 10 (5.05%) Junior Developer
6 10 (5.05%) Junior PHP Developer
6 10 (5.05%) PHP Developer
7 9 (4.55%) Consultant
7 9 (4.55%) Senior Manager
8 8 (4.04%) QA Manager
9 7 (3.54%) Business Intelligence Analyst
9 7 (3.54%) Client Director
9 7 (3.54%) Senior Analyst
9 7 (3.54%) Solutions Architect
9 7 (3.54%) Transformation Manager
10 6 (3.03%) Control Systems Engineer
10 6 (3.03%) Lead
Libraries, Frameworks & Software Standards
1 11 (5.56%) React
2 10 (5.05%) Doctrine
2 10 (5.05%) Laravel
3 5 (2.53%) SAP TM
4 4 (2.02%) Node.js
5 3 (1.52%) .NET
5 3 (1.52%) EDI
5 3 (1.52%) RESTful
6 2 (1.01%) .NET Core
6 2 (1.01%) AngularJS
6 2 (1.01%) GraphQL
6 2 (1.01%) HTML
6 2 (1.01%) Spring
7 1 (0.51%) CSS
7 1 (0.51%) HTML5
7 1 (0.51%) Jest
7 1 (0.51%) Kafka
7 1 (0.51%) Next.js
7 1 (0.51%) Spring Boot
7 1 (0.51%) Vue
Miscellaneous
1 48 (24.24%) Onboarding
2 15 (7.58%) Self-Motivation
3 12 (6.06%) FMCG
4 10 (5.05%) Greenfield Project
5 9 (4.55%) Life Science
6 6 (3.03%) Robotics
7 5 (2.53%) Management Information System
8 3 (1.52%) Social Media
9 2 (1.01%) Driving Licence
9 2 (1.01%) EPoS
9 2 (1.01%) Graphic Design
9 2 (1.01%) Public Cloud
9 2 (1.01%) Virtual Team
10 1 (0.51%) Animation
10 1 (0.51%) Distributed Systems
10 1 (0.51%) Legacy Systems
10 1 (0.51%) Photography
10 1 (0.51%) Product Ownership
10 1 (0.51%) Team-Oriented Environment
10 1 (0.51%) Video Editing
Operating Systems
1 4 (2.02%) Windows
2 2 (1.01%) Windows Server
3 1 (0.51%) Android
3 1 (0.51%) VMS
Processes & Methodologies
1 51 (25.76%) Business Intelligence
1 51 (25.76%) Problem-Solving
2 46 (23.23%) Agile
3 45 (22.73%) Analytics
4 38 (19.19%) Visualisation
5 35 (17.68%) Data Visualisation
6 34 (17.17%) Actionable Insight
6 34 (17.17%) Project Management
7 27 (13.64%) Computer Science
7 27 (13.64%) Process Improvement
8 25 (12.63%) E-Commerce
9 23 (11.62%) Roadmaps
10 22 (11.11%) Data Modelling
11 21 (10.61%) Customer Experience
11 21 (10.61%) ETL
11 21 (10.61%) Statistical Analysis
12 18 (9.09%) Mathematics
13 17 (8.59%) Decision-Making
13 17 (8.59%) Requirements Gathering
14 16 (8.08%) Performance Measurement
Programming Languages
1 55 (27.78%) SQL
2 44 (22.22%) Python
3 21 (10.61%) R
4 19 (9.60%) MATLAB
5 10 (5.05%) PHP
5 10 (5.05%) TypeScript
6 8 (4.04%) JavaScript
7 7 (3.54%) Java
8 4 (2.02%) Go
9 2 (1.01%) C#
9 2 (1.01%) Data Analysis Expressions
9 2 (1.01%) Kotlin
9 2 (1.01%) PL/SQL
10 1 (0.51%) C++
10 1 (0.51%) JSX
10 1 (0.51%) Shell Script
10 1 (0.51%) VBA
Qualifications
1 61 (30.81%) Degree
2 23 (11.62%) Master's Degree
3 16 (8.08%) Computer Science Degree
4 7 (3.54%) MBA
5 6 (3.03%) HNC
5 6 (3.03%) Six Sigma Black Belt
6 4 (2.02%) Microsoft Certification
7 3 (1.52%) CISA
8 1 (0.51%) APMP
8 1 (0.51%) DBS Check
8 1 (0.51%) MRICS
8 1 (0.51%) RIBA
Quality Assurance & Compliance
1 10 (5.05%) QA
2 8 (4.04%) GMP
3 6 (3.03%) Data Quality
4 5 (2.53%) Accessibility
4 5 (2.53%) PMO
5 2 (1.01%) ISO 14000
6 1 (0.51%) GDPR
System Software
1 14 (7.07%) Docker
2 6 (3.03%) Active Directory
3 1 (0.51%) IAG
Systems Management
1 3 (1.52%) Kubernetes
2 2 (1.01%) Terraform
3 1 (0.51%) Grafana
3 1 (0.51%) Microsoft Intune
3 1 (0.51%) Prometheus
Vendors
1 33 (16.67%) Microsoft
2 24 (12.12%) Oracle
3 22 (11.11%) SAP
4 8 (4.04%) QAD
5 6 (3.03%) Minitab
6 5 (2.53%) Cadence
7 4 (2.02%) Google
7 4 (2.02%) HubSpot
8 3 (1.52%) Ahrefs
9 2 (1.01%) Salesforce
9 2 (1.01%) Siebel
10 1 (0.51%) Cisco
10 1 (0.51%) Epicor
10 1 (0.51%) Juniper
10 1 (0.51%) ServiceNow
10 1 (0.51%) Workday
10 1 (0.51%) Xero