Windows Jobs in Manchester

Microsoft Windows
North West > Manchester

The table below provides summary statistics for permanent job vacancies advertised in Manchester requiring Windows skills. It includes a benchmarking guide to the annual salaries offered in vacancies that cited Windows over the 6 months leading up to 14 May 2025, comparing them to the same period in the previous two years.

6 months to
14 May 2025
Same period 2024 Same period 2023
Rank 19 24 33
Rank change year-on-year +5 +9 -6
Permanent jobs citing Windows 254 421 419
As % of all permanent jobs advertised in Manchester 11.25% 8.12% 8.56%
As % of the Operating Systems category 55.10% 56.43% 65.06%
Number of salaries quoted 181 301 321
10th Percentile £26,250 £25,500 £23,500
25th Percentile £33,250 £29,000 £27,750
Median annual salary (50th Percentile) £40,000 £42,500 £42,500
Median % change year-on-year -5.88% - +6.25%
75th Percentile £57,500 £60,000 £57,500
90th Percentile £73,886 £68,750 £67,500
North West median annual salary £40,000 £40,000 £40,000
% change year-on-year - - +9.59%

All Operating Systems
Manchester

Windows falls under the Operating Systems category. For comparison with the information above, the following table provides summary statistics for all permanent job vacancies requiring operating system skills in Manchester.

Permanent vacancies with a requirement for operating system skills 461 746 644
As % of all permanent jobs advertised in Manchester 20.43% 14.38% 13.16%
Number of salaries quoted 266 532 451
10th Percentile £29,250 £26,250 £25,000
25th Percentile £33,250 £37,500 £32,500
Median annual salary (50th Percentile) £50,000 £50,000 £50,000
Median % change year-on-year - - +5.26%
75th Percentile £65,000 £63,375 £67,500
90th Percentile £77,500 £73,989 £77,500
North West median annual salary £44,500 £45,000 £45,000
% change year-on-year -1.11% - +5.88%

Windows
Job Vacancy Trend in Manchester

Job postings citing Windows as a proportion of all IT jobs advertised in Manchester.
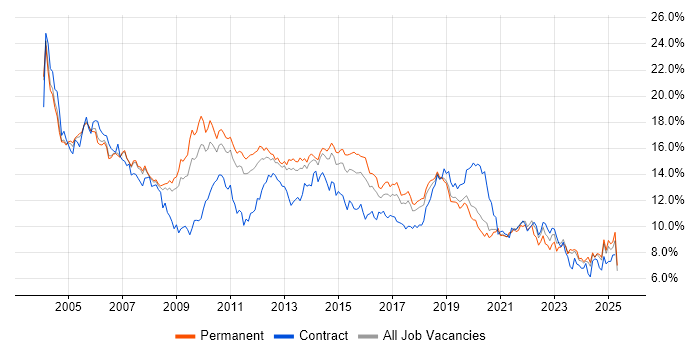
Job vacancy trend for Windows in Manchester

Windows
Salary Trend in Manchester

3-month moving average salary quoted in jobs citing Windows in Manchester.

Salary trend for Windows in Manchester

Windows
Salary Histogram in Manchester

Salary distribution for jobs citing Windows in Manchester over the 6 months to 14 May 2025.

Salary histogram for Windows in Manchester

Windows
Job Locations in Manchester

The table below looks at the demand and provides a guide to the median salaries quoted in IT jobs citing Windows within the Manchester region over the 6 months to 14 May 2025. The 'Rank Change' column provides an indication of the change in demand within each location based on the same 6 month period last year.

Location Rank Change
on Same Period
Last Year
Matching
Permanent
IT Job Ads
Median Salary
Past 6 Months
Median Salary
% Change
on Same Period
Last Year
Live
Jobs
Bolton -3 75 £50,000 -14.89% 14
Wigan - 15 £34,500 -
Oldham +3 9 £26,500 -3.64%
Stockport -14 5 £27,500 -52.17% 17
Sale -7 4 £50,000 +100.00%
Altrincham - 4 £50,000 - 3
Bury -5 3 - - 6
Cheadle - 3 - -
Heywood - 3 £23,000 -
Ashton-under-Lyne - 2 - - 4
Dukinfield - 2 - -
Stalybridge - 2 - -
Rochdale -2 1 - - 1
Littleborough - 1 - -
Windows
North West

Windows
Co-occurring Skills and Capabilities in Manchester by Category

The follow tables expand on the table above by listing co-occurrences grouped by category. The same employment type, locality and period is covered with up to 20 co-occurrences shown in each of the following categories:

Application Platforms
1 10 (3.94%) Microsoft Exchange
2 8 (3.15%) IIS
3 4 (1.57%) SharePoint
4 1 (0.39%) Apache Solr
4 1 (0.39%) CMS
Applications
1 23 (9.06%) Microsoft Office
2 14 (5.51%) Microsoft Excel
3 13 (5.12%) Microsoft PowerPoint
4 6 (2.36%) Microsoft Project
4 6 (2.36%) MS Visio
4 6 (2.36%) Trello
Cloud Services
1 68 (26.77%) Microsoft 365
2 46 (18.11%) Azure
3 29 (11.42%) AWS
4 12 (4.72%) Entra ID
5 11 (4.33%) GCP
5 11 (4.33%) Power Platform
6 8 (3.15%) SaaS
7 6 (2.36%) Nutanix
8 4 (1.57%) Amazon EC2
8 4 (1.57%) Amazon S3
8 4 (1.57%) OneDrive
9 3 (1.18%) AWS CloudFormation
10 2 (0.79%) Amazon CloudWatch
10 2 (0.79%) Azure DevOps
10 2 (0.79%) Cloudflare
10 2 (0.79%) GitHub
10 2 (0.79%) IaaS
10 2 (0.79%) PaaS
11 1 (0.39%) Azure Monitor
11 1 (0.39%) GitHub Actions
Communications & Networking
1 56 (22.05%) VPN
2 48 (18.90%) Cisco IOS
3 25 (9.84%) Firewall
4 24 (9.45%) DNS
5 17 (6.69%) DHCP
6 14 (5.51%) Intrusion Detection
7 8 (3.15%) WAN
8 6 (2.36%) VoIP
9 5 (1.97%) NAS
9 5 (1.97%) SAN
9 5 (1.97%) VSAN
10 4 (1.57%) HTTP
10 4 (1.57%) LAN
10 4 (1.57%) SSH
10 4 (1.57%) Wi-Fi
10 4 (1.57%) Wireless
11 3 (1.18%) TCP/IP
12 2 (0.79%) DMZ
13 1 (0.39%) Internet
13 1 (0.39%) OSPF
Database & Business Intelligence
1 14 (5.51%) SQL Server
2 10 (3.94%) Power BI
3 6 (2.36%) MongoDB
4 5 (1.97%) PostgreSQL
5 4 (1.57%) Tableau
6 2 (0.79%) MySQL
7 1 (0.39%) BusinessObjects
7 1 (0.39%) Cloud Spanner
7 1 (0.39%) Couchbase
7 1 (0.39%) Data Hub
7 1 (0.39%) DB2
7 1 (0.39%) Elasticsearch
7 1 (0.39%) Hadoop
7 1 (0.39%) NoSQL
7 1 (0.39%) RDBMS
7 1 (0.39%) Relational Database
7 1 (0.39%) SQL CLR
Development Applications
1 10 (3.94%) JIRA
2 6 (2.36%) Git
3 5 (1.97%) Oracle Forms
4 4 (1.57%) Jenkins
5 1 (0.39%) CircleCI
5 1 (0.39%) CMake
5 1 (0.39%) IBM UrbanCode
5 1 (0.39%) Jaeger
5 1 (0.39%) Octopus Deploy
5 1 (0.39%) Team Foundation Server
5 1 (0.39%) TeamCity
5 1 (0.39%) Travis CI
General
1 95 (37.40%) Analytical Skills
2 91 (35.83%) Social Skills
3 52 (20.47%) Finance
4 43 (16.93%) Inclusion and Diversity
5 17 (6.69%) Organisational Skills
6 12 (4.72%) Banking
6 12 (4.72%) Legal
7 10 (3.94%) Presentation Skills
8 6 (2.36%) Telecoms
9 5 (1.97%) Law
9 5 (1.97%) Public Sector
10 4 (1.57%) Games
11 2 (0.79%) Local Government
11 2 (0.79%) Retail
12 1 (0.39%) Automotive
12 1 (0.39%) Back Office
12 1 (0.39%) Influencing Skills
12 1 (0.39%) Manufacturing
Job Titles
1 58 (22.83%) Infrastructure Engineer
2 31 (12.20%) Analyst
3 23 (9.06%) IT Support
4 16 (6.30%) Architect
4 16 (6.30%) Security Architect
5 13 (5.12%) Vendor Manager
6 12 (4.72%) Lead
6 12 (4.72%) Senior
7 10 (3.94%) Cloud Engineer
7 10 (3.94%) Project Manager
7 10 (3.94%) Service Desk Support
8 7 (2.76%) Administrator
8 7 (2.76%) Support Engineer
9 6 (2.36%) 1st Line Support
9 6 (2.36%) 2nd Line Support
9 6 (2.36%) Cloud Infrastructure Engineer
9 6 (2.36%) Financial Analyst
9 6 (2.36%) Report Analyst
9 6 (2.36%) Support Analyst
9 6 (2.36%) Systems Administrator
Libraries, Frameworks & Software Standards
1 45 (17.72%) Elastic Stack
2 5 (1.97%) Middleware
3 4 (1.57%) LDAP
4 2 (0.79%) .NET
4 2 (0.79%) .NET Framework
4 2 (0.79%) JSON
5 1 (0.39%) .NET Core
5 1 (0.39%) Classic ASP
5 1 (0.39%) CSS
5 1 (0.39%) Dapper ORM
5 1 (0.39%) Entity Framework
5 1 (0.39%) HTML
5 1 (0.39%) Loki
5 1 (0.39%) MFC
5 1 (0.39%) RabbitMQ
5 1 (0.39%) Web Services
5 1 (0.39%) XML
Miscellaneous
1 93 (36.61%) Social Media
2 43 (16.93%) Cyberattack
3 29 (11.42%) Self-Motivation
4 28 (11.02%) Team-Oriented Environment
5 22 (8.66%) Management Information System
6 14 (5.51%) Security Posture
7 6 (2.36%) Data Centre
7 6 (2.36%) Hybrid Cloud
7 6 (2.36%) Onboarding
8 5 (1.97%) Data Protection Act
9 4 (1.57%) Anti-Spyware
9 4 (1.57%) CCTV
10 3 (1.18%) Blackberry
10 3 (1.18%) BYOD
10 3 (1.18%) Clustering
10 3 (1.18%) Smartphone
11 2 (0.79%) Client/Server
11 2 (0.79%) CMDB
11 2 (0.79%) Private Cloud
11 2 (0.79%) Public Cloud
Operating Systems
1 91 (35.83%) Windows Vista
2 79 (31.10%) Linux
3 55 (21.65%) Android
4 46 (18.11%) Windows Server
5 33 (12.99%) Windows 10
6 7 (2.76%) Mac OS
7 6 (2.36%) CentOS
8 5 (1.97%) Mac OS X
9 4 (1.57%) Windows Server 2016
10 2 (0.79%) Apple iOS
10 2 (0.79%) Debian
10 2 (0.79%) Ubuntu
10 2 (0.79%) Windows Server 2012
11 1 (0.39%) Unix
11 1 (0.39%) Windows Server 2019
11 1 (0.39%) zOS
Processes & Methodologies
1 122 (48.03%) Problem-Solving
2 64 (25.20%) Infrastructure Engineering
3 58 (22.83%) Risk Management
4 52 (20.47%) DevOps
5 50 (19.69%) Computer Science
5 50 (19.69%) Mathematics
6 47 (18.50%) Platform Engineering
7 46 (18.11%) Task Automation
8 45 (17.72%) Line Management
9 43 (16.93%) Customer Service
9 43 (16.93%) Storage Management
10 39 (15.35%) Collaborative Working
11 38 (14.96%) Continuous Improvement
12 29 (11.42%) Data Protection
13 24 (9.45%) ITIL
14 23 (9.06%) Budgeting
14 23 (9.06%) Decision-Making
15 22 (8.66%) Cybersecurity
16 21 (8.27%) Information Security
17 20 (7.87%) Identity Management
Programming Languages
1 53 (20.87%) PowerShell
2 48 (18.90%) Python
3 44 (17.32%) Bash
4 12 (4.72%) SQL
5 2 (0.79%) C#
5 2 (0.79%) JavaScript
5 2 (0.79%) T-SQL
6 1 (0.39%) C++
6 1 (0.39%) Go
6 1 (0.39%) PL/SQL
6 1 (0.39%) Ruby
6 1 (0.39%) VB
6 1 (0.39%) VB.NET
6 1 (0.39%) VBA
6 1 (0.39%) VBScript
Qualifications
1 95 (37.40%) Degree
2 94 (37.01%) DBS Check
3 27 (10.63%) Master's Degree
4 17 (6.69%) Microsoft Certification
5 16 (6.30%) CISM
5 16 (6.30%) CISSP
6 14 (5.51%) (ISC)2 CCSP
6 14 (5.51%) CEH
6 14 (5.51%) CISA
6 14 (5.51%) Cisco Certification
6 14 (5.51%) Computer Science Degree
7 10 (3.94%) ACCA
7 10 (3.94%) CIMA
7 10 (3.94%) PMI Certification
7 10 (3.94%) PMP
7 10 (3.94%) VMware Certified Professional (VCP)
8 8 (3.15%) ITIL Certification
8 8 (3.15%) Network+ Certification
9 6 (2.36%) AAT
10 5 (1.97%) MCSA
Quality Assurance & Compliance
1 23 (9.06%) ISO/IEC 27001
2 18 (7.09%) NIST
3 17 (6.69%) GDPR
4 15 (5.91%) SLA
5 12 (4.72%) QA
6 2 (0.79%) Cyber Essentials
6 2 (0.79%) NCSC
6 2 (0.79%) PCI DSS
7 1 (0.39%) Sarbanes-Oxley
System Software
1 52 (20.47%) vSphere
2 50 (19.69%) VMware NSX
3 49 (19.29%) Docker
3 49 (19.29%) Hyper-V
4 43 (16.93%) Active Directory
5 15 (5.91%) VMware Infrastructure
6 5 (1.97%) VMware ESXi
7 3 (1.18%) Virtual Machines
8 1 (0.39%) DFS Replication
8 1 (0.39%) RHEV
Systems Management
1 60 (23.62%) Terraform
2 56 (22.05%) Ansible
3 16 (6.30%) Microsoft Intune
4 10 (3.94%) SCCM
5 7 (2.76%) Puppet
6 6 (2.36%) Jamf Pro
7 5 (1.97%) Kubernetes
7 5 (1.97%) Progress Chef
8 4 (1.57%) Single Sign-On
9 3 (1.18%) Autotask
9 3 (1.18%) Grafana
9 3 (1.18%) Prometheus
10 2 (0.79%) Salt
10 2 (0.79%) SmoothWall
11 1 (0.39%) Automic
11 1 (0.39%) Backup Exec
11 1 (0.39%) Consul
11 1 (0.39%) Rancher
Vendors
1 82 (32.28%) Microsoft
2 52 (20.47%) Cisco
3 44 (17.32%) Splunk
4 43 (16.93%) 3PAR
4 43 (16.93%) Juniper
5 35 (13.78%) VMware
6 15 (5.91%) Veeam
7 14 (5.51%) ServiceNow
8 10 (3.94%) Apple
9 8 (3.15%) Oracle
10 5 (1.97%) Citrix
10 5 (1.97%) Google
10 5 (1.97%) HP
11 4 (1.57%) Cognos
11 4 (1.57%) Okta
11 4 (1.57%) Perforce
12 3 (1.18%) Adobe
12 3 (1.18%) Avaya
12 3 (1.18%) iManage
12 3 (1.18%) Intapp