Roadmaps Jobs in the Midlands

Roadmaps
England > Midlands

The table below provides summary statistics for permanent job vacancies advertised in the Midlands requiring Roadmaps skills. It includes a benchmarking guide to the annual salaries offered in vacancies that cited Roadmaps over the 6 months leading up to 26 July 2024, comparing them to the same period in the previous two years.

6 months to
26 Jul 2024
Same period 2023 Same period 2022
Rank 55 38 26
Rank change year-on-year -17 -12 +20
Permanent jobs citing Roadmaps 447 513 1,120
As % of all permanent jobs advertised in the Midlands 3.85% 6.76% 9.08%
As % of the Processes & Methodologies category 4.89% 7.06% 9.42%
Number of salaries quoted 311 284 636
10th Percentile £36,250 £45,000 £41,250
25th Percentile £47,350 £52,500 £47,500
Median annual salary (50th Percentile) £62,500 £62,500 £60,000
Median % change year-on-year - +4.17% +9.09%
75th Percentile £80,000 £77,563 £75,000
90th Percentile £97,500 £87,500 £87,500
England median annual salary £70,000 £72,500 £70,000
% change year-on-year -3.45% +3.57% +3.70%

All Process and Methodology Skills
Midlands

Roadmaps falls under the Processes and Methodologies category. For comparison with the information above, the following table provides summary statistics for all permanent job vacancies requiring process or methodology skills in the Midlands.

Permanent vacancies with a requirement for process or methodology skills 9,145 7,269 11,887
As % of all permanent jobs advertised in the Midlands 78.71% 95.72% 96.39%
Number of salaries quoted 5,707 4,187 7,370
10th Percentile £27,500 £30,000 £29,725
25th Percentile £35,000 £39,000 £37,500
Median annual salary (50th Percentile) £50,000 £52,500 £50,000
Median % change year-on-year -4.76% +5.00% +5.26%
75th Percentile £63,250 £67,500 £65,000
90th Percentile £75,772 £78,750 £77,500
England median annual salary £55,000 £62,000 £60,000
% change year-on-year -11.29% +3.33% +4.35%

Roadmaps
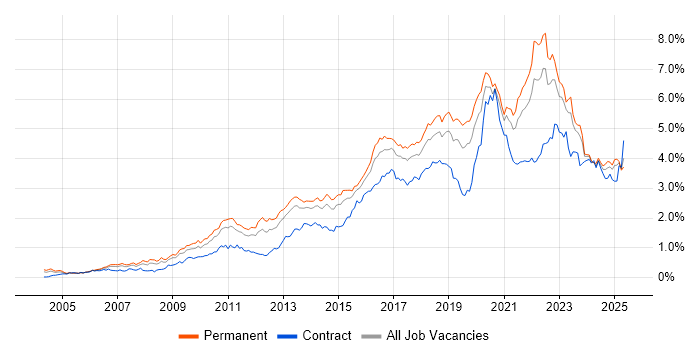
Job Vacancy Trend in the Midlands

Job postings citing Roadmaps as a proportion of all IT jobs advertised in the Midlands.

Job vacancy trend for Roadmaps in the Midlands

Roadmaps
Salary Trend in the Midlands

3-month moving average salary quoted in jobs citing Roadmaps in the Midlands.

Salary trend for Roadmaps in the Midlands

Roadmaps
Salary Histogram in the Midlands

Salary distribution for jobs citing Roadmaps in the Midlands over the 6 months to 26 July 2024.

Salary histogram for Roadmaps in the Midlands

Roadmaps
Job Locations in the Midlands

The table below looks at the demand and provides a guide to the median salaries quoted in IT jobs citing Roadmaps within the Midlands region over the 6 months to 26 July 2024. The 'Rank Change' column provides an indication of the change in demand within each location based on the same 6 month period last year.

Location Rank Change
on Same Period
Last Year
Matching
Permanent
IT Job Ads
Median Salary
Past 6 Months
Median Salary
% Change
on Same Period
Last Year
Live
Jobs
West Midlands -14 299 £65,000 +4.00% 45
East Midlands -33 142 £59,000 -6.15% 21
Roadmaps
England

Roadmaps
Co-occurring Skills and Capabilities in the Midlands by Category

The follow tables expand on the table above by listing co-occurrences grouped by category. The same employment type, locality and period is covered with up to 20 co-occurrences shown in each of the following categories:

Application Platforms
1 12 (2.68%) SharePoint
2 9 (2.01%) Confluence
3 6 (1.34%) WordPress
4 5 (1.12%) Tuxedo
5 3 (0.67%) Apache
5 3 (0.67%) IIS
6 2 (0.45%) BizTalk Server
6 2 (0.45%) Microsoft Exchange
7 1 (0.22%) Appian
7 1 (0.22%) CMS
Applications
1 25 (5.59%) Microsoft Office
2 9 (2.01%) Microsoft Excel
3 5 (1.12%) Microsoft Project
4 4 (0.89%) Microsoft PowerPoint
5 3 (0.67%) Trello
6 2 (0.45%) Adobe Creative Suite
6 2 (0.45%) Sketch
7 1 (0.22%) Adobe Captivate
7 1 (0.22%) MS Visio
Business Applications
1 14 (3.13%) Dynamics CRM
2 11 (2.46%) SAP S/4HANA
3 6 (1.34%) Dynamics NAV
4 5 (1.12%) NEC Housing
5 4 (0.89%) Oracle EBS
5 4 (0.89%) Oracle ERP
5 4 (0.89%) PeopleSoft HCM
6 3 (0.67%) SAP Oil and Gas
7 2 (0.45%) Dynamics AX
7 2 (0.45%) SAP MM
7 2 (0.45%) SAP SD
7 2 (0.45%) Unit4 Business World
8 1 (0.22%) Odoo
8 1 (0.22%) SAP BPC
8 1 (0.22%) SAP ERP
8 1 (0.22%) SAP HR
8 1 (0.22%) SAP IS-U
8 1 (0.22%) SAP MDG
8 1 (0.22%) SAP Payroll
8 1 (0.22%) Shopify
Cloud Services
1 76 (17.00%) Azure
2 59 (13.20%) AWS
3 38 (8.50%) SaaS
4 33 (7.38%) Microsoft 365
5 24 (5.37%) Dynamics 365
6 23 (5.15%) Entra ID
6 23 (5.15%) Power Platform
7 12 (2.68%) Google Drive
8 11 (2.46%) Cloud Computing
9 10 (2.24%) Azure Stack
10 9 (2.01%) GCP
11 7 (1.57%) Figma
11 7 (1.57%) OneDrive
12 6 (1.34%) Azure Storage
12 6 (1.34%) dbt
12 6 (1.34%) Dropbox
13 5 (1.12%) Amazon EC2
13 5 (1.12%) Google Analytics
14 4 (0.89%) Amazon Kinesis
14 4 (0.89%) Amazon S3
Communications & Networking
1 15 (3.36%) Firewall
1 15 (3.36%) WAN
2 14 (3.13%) LAN
3 6 (1.34%) Network Security
3 6 (1.34%) SAN
3 6 (1.34%) VoIP
3 6 (1.34%) VPN
4 5 (1.12%) Wi-Fi
4 5 (1.12%) Wireless
5 4 (0.89%) Cisco ASA
5 4 (0.89%) DHCP
5 4 (0.89%) DNS
5 4 (0.89%) Internet
5 4 (0.89%) Intranet
5 4 (0.89%) MPLS
5 4 (0.89%) SD-WAN
5 4 (0.89%) TCP/IP
5 4 (0.89%) VLAN
6 3 (0.67%) IPsec
6 3 (0.67%) WAAS
Database & Business Intelligence
1 18 (4.03%) Data Warehouse
2 15 (3.36%) Power BI
3 14 (3.13%) SQL Server
4 12 (2.68%) Relational Database
5 10 (2.24%) Amazon Redshift
6 9 (2.01%) Data Lake
7 8 (1.79%) RDBMS
8 7 (1.57%) MySQL
9 6 (1.34%) Azure SQL Data Warehouse
9 6 (1.34%) PostgreSQL
9 6 (1.34%) SQLite
10 5 (1.12%) Amazon RDS
11 3 (0.67%) Elasticsearch
12 2 (0.45%) Big Data
12 2 (0.45%) DB2
12 2 (0.45%) SQL Server Integration Services
12 2 (0.45%) SQL Server Reporting Services
13 1 (0.22%) Crystal Reports
13 1 (0.22%) NoSQL
13 1 (0.22%) SAP Data Services
Development Applications
1 35 (7.83%) JIRA
2 15 (3.36%) Git
3 6 (1.34%) Jenkins
3 6 (1.34%) Octopus Deploy
3 6 (1.34%) SonarQube
3 6 (1.34%) TeamCity
4 4 (0.89%) Postman
5 3 (0.67%) Axure RP
6 1 (0.22%) Bitbucket
6 1 (0.22%) GitLab
6 1 (0.22%) Sonatype Nexus
6 1 (0.22%) Visual Studio Code
General
1 127 (28.41%) Finance
2 102 (22.82%) Social Skills
3 55 (12.30%) Presentation Skills
4 43 (9.62%) Analytical Skills
5 35 (7.83%) Marketing
6 34 (7.61%) Legal
7 26 (5.82%) Inclusion and Diversity
8 25 (5.59%) Law
8 25 (5.59%) Retail
9 18 (4.03%) Public Sector
10 16 (3.58%) Manufacturing
11 14 (3.13%) Banking
12 12 (2.68%) Automotive
12 12 (2.68%) Influencing Skills
13 11 (2.46%) Aerospace
14 7 (1.57%) Pharmaceutical
14 7 (1.57%) Social Housing
15 6 (1.34%) Games
15 6 (1.34%) Local Government
16 5 (1.12%) Police
Job Titles
1 73 (16.33%) Senior
2 64 (14.32%) Architect
3 47 (10.51%) Lead
4 36 (8.05%) Consultant
4 36 (8.05%) Developer
5 27 (6.04%) Project Manager
6 26 (5.82%) Solutions Architect
7 25 (5.59%) Analyst
8 24 (5.37%) Infrastructure Engineer
9 22 (4.92%) Product Manager
10 17 (3.80%) Product Owner
10 17 (3.80%) Senior Manager
11 16 (3.58%) IT Manager
11 16 (3.58%) Technical Architect
12 15 (3.36%) Technical Leader
13 13 (2.91%) ServiceNow Developer
14 12 (2.68%) Functional Consultant
14 12 (2.68%) Lead Developer
14 12 (2.68%) Senior Analyst
15 11 (2.46%) Cloud Engineer
Libraries, Frameworks & Software Standards
1 25 (5.59%) .NET
2 20 (4.47%) React
3 12 (2.68%) Node.js
4 10 (2.24%) EDI
5 9 (2.01%) .NET Framework
6 6 (1.34%) Django
6 6 (1.34%) JSON
6 6 (1.34%) Spring
6 6 (1.34%) Spring Boot
6 6 (1.34%) Web Services
7 5 (1.12%) RESTful
7 5 (1.12%) XML
8 4 (0.89%) Oracle Fusion
9 3 (0.67%) CSS
9 3 (0.67%) HTML
9 3 (0.67%) Next.js
10 2 (0.45%) GraphQL
10 2 (0.45%) Play Framework
10 2 (0.45%) REST
10 2 (0.45%) WCF
Miscellaneous
1 64 (14.32%) Product Ownership
2 23 (5.15%) Management Information System
3 22 (4.92%) Enterprise Software
4 19 (4.25%) Data Centre
5 16 (3.58%) Mobile App
6 9 (2.01%) Security Operations Centre
7 8 (1.79%) Virtual Team
8 7 (1.57%) Cloud Native
8 7 (1.57%) Data Structures
8 7 (1.57%) Greenfield Project
8 7 (1.57%) Onboarding
8 7 (1.57%) PKI
8 7 (1.57%) Self-Motivation
9 6 (1.34%) iPad
9 6 (1.34%) iPhone
9 6 (1.34%) PMI
9 6 (1.34%) Public Cloud
9 6 (1.34%) Team-Oriented Environment
10 5 (1.12%) Enterprise Storage
10 5 (1.12%) Low-Code
Operating Systems
1 26 (5.82%) Windows
2 19 (4.25%) Windows Server
3 7 (1.57%) Android
4 6 (1.34%) Linux
5 4 (0.89%) Windows 10
6 2 (0.45%) VME
7 1 (0.22%) Apple iOS
7 1 (0.22%) Unix
7 1 (0.22%) Windows Server 2016
Processes & Methodologies
1 171 (38.26%) Agile
2 90 (20.13%) Product Roadmap
3 81 (18.12%) Project Management
4 75 (16.78%) Technology Roadmap
5 61 (13.65%) Mentoring
5 61 (13.65%) Strategic Roadmap
6 60 (13.42%) Stakeholder Management
7 57 (12.75%) Problem-Solving
8 56 (12.53%) Coaching
9 51 (11.41%) ITIL
10 49 (10.96%) Continuous Improvement
11 46 (10.29%) Project Delivery
11 46 (10.29%) Technical Leadership
12 45 (10.07%) User Experience
13 42 (9.40%) Software Engineering
14 41 (9.17%) Analytics
15 38 (8.50%) Infrastructure Engineering
16 35 (7.83%) DevOps
17 32 (7.16%) User Stories
18 31 (6.94%) Cybersecurity
Programming Languages
1 46 (10.29%) SQL
2 23 (5.15%) C#
2 23 (5.15%) PowerShell
3 16 (3.58%) Python
4 14 (3.13%) JavaScript
5 13 (2.91%) Java
6 12 (2.68%) PHP
7 11 (2.46%) COBOL
7 11 (2.46%) Micro Focus COBOL
8 9 (2.01%) TypeScript
9 6 (1.34%) C
9 6 (1.34%) Go
10 4 (0.89%) C++
11 3 (0.67%) Apex Code
12 2 (0.45%) Kusto Query Language
Qualifications
1 73 (16.33%) Degree
2 22 (4.92%) Security Cleared
3 19 (4.25%) Azure Certification
4 17 (3.80%) Computer Science Degree
5 16 (3.58%) DBS Check
5 16 (3.58%) SC Cleared
6 13 (2.91%) Microsoft Certification
7 10 (2.24%) PMI Certification
8 8 (1.79%) CCNA
8 8 (1.79%) CCNP
8 8 (1.79%) Cisco Certification
8 8 (1.79%) CISSP
9 7 (1.57%) CISM
9 7 (1.57%) ITIL Certification
9 7 (1.57%) PMP
9 7 (1.57%) VMware Certified Professional (VCP)
10 6 (1.34%) AWS Certification
10 6 (1.34%) TOGAF Certification
11 5 (1.12%) MCSE
12 4 (0.89%) CCIE
Quality Assurance & Compliance
1 30 (6.71%) QA
2 14 (3.13%) ISO/IEC 27001
3 11 (2.46%) SLA
4 10 (2.24%) Accessibility
5 8 (1.79%) GDPR
6 5 (1.12%) SOC 2
7 4 (0.89%) Cyber Essentials
7 4 (0.89%) PMO
8 3 (0.67%) Data Quality
8 3 (0.67%) NIST
9 2 (0.45%) Cyber Essentials PLUS
9 2 (0.45%) ISO 14001
9 2 (0.45%) ISO 22301
9 2 (0.45%) NCSC
9 2 (0.45%) PCI DSS
10 1 (0.22%) Automotive SPICE
10 1 (0.22%) HIPAA
10 1 (0.22%) ISO 31000
10 1 (0.22%) ISO 9001
10 1 (0.22%) ISO/IEC 27005
System Software
1 34 (7.61%) Active Directory
2 24 (5.37%) VMware Infrastructure
3 15 (3.36%) Docker
3 15 (3.36%) Hyper-V
4 10 (2.24%) RACF
5 6 (1.34%) Virtual Desktop
6 2 (0.45%) Embedded Firmware
6 2 (0.45%) Firmware
Systems Management
1 15 (3.36%) Terraform
2 7 (1.57%) Kubernetes
2 7 (1.57%) Single Sign-On
3 6 (1.34%) Progress Chef
4 4 (0.89%) Ansible
4 4 (0.89%) SCCM
5 2 (0.45%) Functional Safety
6 1 (0.22%) AirWatch
6 1 (0.22%) Microsoft Intune
6 1 (0.22%) SCOM
Vendors
1 127 (28.41%) Microsoft
2 27 (6.04%) Google
2 27 (6.04%) VMware
3 24 (5.37%) ServiceNow
4 17 (3.80%) SAP
5 12 (2.68%) Apple
5 12 (2.68%) Cisco
5 12 (2.68%) Salesforce
6 11 (2.46%) Micro Focus
6 11 (2.46%) Oracle
7 10 (2.24%) CyberArk
8 8 (1.79%) Guidewire
9 6 (1.34%) Informatica
9 6 (1.34%) SolarWinds
9 6 (1.34%) Xero
10 5 (1.12%) Ariba
10 5 (1.12%) Dell
10 5 (1.12%) NEC
11 4 (0.89%) Hyperion
11 4 (0.89%) PeopleSoft