Project Delivery Jobs in the Midlands

Project Delivery
England > Midlands

The table below provides summary statistics for permanent job vacancies advertised in the Midlands requiring Project Delivery skills. It includes a benchmarking guide to the annual salaries offered in vacancies that cited Project Delivery over the 6 months leading up to 26 July 2024, comparing them to the same period in the previous two years.

6 months to
26 Jul 2024
Same period 2023 Same period 2022
Rank 77 50 42
Rank change year-on-year -27 -8 +15
Permanent jobs citing Project Delivery 371 429 757
As % of all permanent jobs advertised in the Midlands 3.19% 5.65% 6.14%
As % of the Processes & Methodologies category 4.06% 5.90% 6.37%
Number of salaries quoted 242 290 499
10th Percentile £34,000 £39,450 £37,500
25th Percentile £41,250 £45,000 £43,500
Median annual salary (50th Percentile) £54,000 £54,750 £52,500
Median % change year-on-year -1.37% +4.29% +5.00%
75th Percentile £65,000 £63,750 £65,000
90th Percentile £72,500 £73,750 £75,000
England median annual salary £55,000 £60,899 £60,000
% change year-on-year -9.69% +1.50% +4.35%

All Process and Methodology Skills
Midlands

Project Delivery falls under the Processes and Methodologies category. For comparison with the information above, the following table provides summary statistics for all permanent job vacancies requiring process or methodology skills in the Midlands.

Permanent vacancies with a requirement for process or methodology skills 9,145 7,269 11,887
As % of all permanent jobs advertised in the Midlands 78.71% 95.72% 96.39%
Number of salaries quoted 5,707 4,187 7,370
10th Percentile £27,500 £30,000 £29,725
25th Percentile £35,000 £39,000 £37,500
Median annual salary (50th Percentile) £50,000 £52,500 £50,000
Median % change year-on-year -4.76% +5.00% +5.26%
75th Percentile £63,250 £67,500 £65,000
90th Percentile £75,772 £78,750 £77,500
England median annual salary £55,000 £62,000 £60,000
% change year-on-year -11.29% +3.33% +4.35%

Project Delivery
Job Vacancy Trend in the Midlands

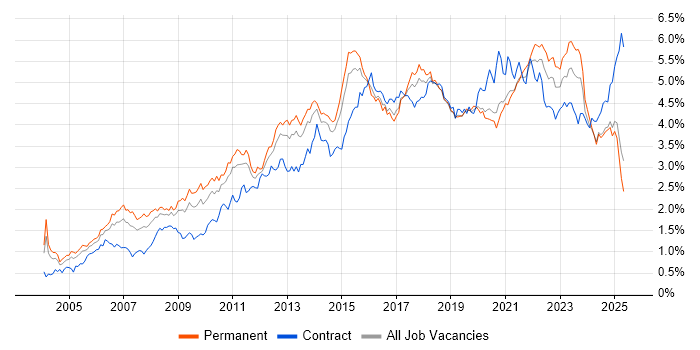
Job postings citing Project Delivery as a proportion of all IT jobs advertised in the Midlands.

Job vacancy trend for Project Delivery in the Midlands

Project Delivery
Salary Trend in the Midlands

3-month moving average salary quoted in jobs citing Project Delivery in the Midlands.

Salary trend for Project Delivery in the Midlands

Project Delivery
Salary Histogram in the Midlands

Salary distribution for jobs citing Project Delivery in the Midlands over the 6 months to 26 July 2024.

Salary histogram for Project Delivery in the Midlands

Project Delivery
Job Locations in the Midlands

The table below looks at the demand and provides a guide to the median salaries quoted in IT jobs citing Project Delivery within the Midlands region over the 6 months to 26 July 2024. The 'Rank Change' column provides an indication of the change in demand within each location based on the same 6 month period last year.

Location Rank Change
on Same Period
Last Year
Matching
Permanent
IT Job Ads
Median Salary
Past 6 Months
Median Salary
% Change
on Same Period
Last Year
Live
Jobs
West Midlands -24 235 £55,000 - 65
East Midlands -2 135 £50,000 -11.11% 36
Project Delivery
England

Project Delivery
Co-occurring Skills and Capabilities in the Midlands by Category

The follow tables expand on the table above by listing co-occurrences grouped by category. The same employment type, locality and period is covered with up to 20 co-occurrences shown in each of the following categories:

Application Platforms
1 29 (7.82%) SharePoint
2 15 (4.04%) Microsoft Exchange
3 9 (2.43%) Confluence
4 4 (1.08%) Office Communications Server
5 2 (0.54%) CMS
Applications
1 23 (6.20%) Microsoft Project
2 14 (3.77%) Microsoft Office
3 8 (2.16%) Microsoft Excel
4 7 (1.89%) Simulink
5 5 (1.35%) AutoCAD
5 5 (1.35%) Microsoft PowerPoint
6 3 (0.81%) Trello
7 2 (0.54%) MS Visio
7 2 (0.54%) Spreadsheet
Business Applications
1 7 (1.89%) Dynamics CRM
2 4 (1.08%) SAP S/4HANA
3 3 (0.81%) Dynamics NAV
4 2 (0.54%) SAP Business ByDesign
5 1 (0.27%) Odoo
5 1 (0.27%) Primavera
5 1 (0.27%) SAP PP
Cloud Services
1 58 (15.63%) Microsoft 365
2 56 (15.09%) Azure
3 28 (7.55%) Entra ID
4 18 (4.85%) Power Platform
5 16 (4.31%) Dynamics 365
6 9 (2.43%) Cloud Computing
7 7 (1.89%) AWS
8 6 (1.62%) Azure Storage
8 6 (1.62%) OneDrive
9 5 (1.35%) Azure DevOps
9 5 (1.35%) IaaS
9 5 (1.35%) Microsoft Copilot
9 5 (1.35%) PaaS
9 5 (1.35%) PowerApps
10 2 (0.54%) Asana
10 2 (0.54%) Azure Data Factory
10 2 (0.54%) ClickUp
10 2 (0.54%) Power Automate
11 1 (0.27%) dbt
11 1 (0.27%) SaaS
Communications & Networking
1 23 (6.20%) DNS
1 23 (6.20%) Firewall
2 19 (5.12%) WAN
3 17 (4.58%) DHCP
3 17 (4.58%) Network Security
3 17 (4.58%) SD-WAN
4 15 (4.04%) VLAN
4 15 (4.04%) Wireless
5 11 (2.96%) LAN
5 11 (2.96%) VoIP
5 11 (2.96%) Wireshark
6 8 (2.16%) 5G
6 8 (2.16%) Wi-Fi
7 7 (1.89%) BGP
7 7 (1.89%) HSRP
7 7 (1.89%) Internet
7 7 (1.89%) J1939
7 7 (1.89%) MPLS
7 7 (1.89%) OSPF
7 7 (1.89%) Spanning Tree
Database & Business Intelligence
1 13 (3.50%) SQL Server
2 12 (3.23%) Power BI
3 4 (1.08%) Elasticsearch
3 4 (1.08%) InfluxDB
3 4 (1.08%) NoSQL
3 4 (1.08%) Tableau
4 3 (0.81%) Data Warehouse
4 3 (0.81%) Oracle Database
5 2 (0.54%) Azure SQL Database
5 2 (0.54%) Data Lake
5 2 (0.54%) Power Query
5 2 (0.54%) QlikView
5 2 (0.54%) SQL Server Integration Services
6 1 (0.27%) Big Data
6 1 (0.27%) BusinessObjects
6 1 (0.27%) Oracle Reports
6 1 (0.27%) SAP BW
Development Applications
1 15 (4.04%) JIRA
2 2 (0.54%) Git
General
1 155 (41.78%) Social Skills
2 127 (34.23%) Finance
3 41 (11.05%) Retail
4 35 (9.43%) Analytical Skills
5 25 (6.74%) Legal
6 23 (6.20%) Inclusion and Diversity
7 21 (5.66%) Presentation Skills
8 20 (5.39%) Manufacturing
9 18 (4.85%) Marketing
9 18 (4.85%) Telecoms
10 17 (4.58%) Organisational Skills
10 17 (4.58%) Public Sector
11 13 (3.50%) Documentation Skills
12 12 (3.23%) Automotive
12 12 (3.23%) Law
13 10 (2.70%) Aerospace
14 9 (2.43%) Aviation
15 7 (1.89%) Electronics
15 7 (1.89%) Pharmaceutical
16 5 (1.35%) Back Office
Job Titles
1 110 (29.65%) Project Manager
2 56 (15.09%) Senior
3 29 (7.82%) IT Manager
4 28 (7.55%) Consultant
5 21 (5.66%) IT Project Manager
5 21 (5.66%) Technical Manager
6 19 (5.12%) IT Engineer
6 19 (5.12%) Systems Engineer
6 19 (5.12%) Technical Project Manager
7 17 (4.58%) Infrastructure Manager
7 17 (4.58%) Lead
8 15 (4.04%) Analyst
9 14 (3.77%) Delivery Manager
9 14 (3.77%) Senior Manager
10 13 (3.50%) Coordinator
10 13 (3.50%) Infrastructure Engineer
11 12 (3.23%) Principal Engineer
11 12 (3.23%) Principal Systems Engineer
11 12 (3.23%) Software Manager
12 10 (2.70%) IT Support
Libraries, Frameworks & Software Standards
1 18 (4.85%) .NET
2 10 (2.70%) JSON
3 6 (1.62%) HTML
4 5 (1.35%) React
5 4 (1.08%) ASP.NET
5 4 (1.08%) Node.js
5 4 (1.08%) Twitter Bootstrap
5 4 (1.08%) YAML
6 3 (0.81%) Web Services
7 2 (0.54%) EDI
7 2 (0.54%) MDX
7 2 (0.54%) REST
7 2 (0.54%) RESTful
7 2 (0.54%) SOAP
7 2 (0.54%) WCF
7 2 (0.54%) XML
8 1 (0.27%) CSS
8 1 (0.27%) Plotly
8 1 (0.27%) SAP Fiori
8 1 (0.27%) SAPUI5
Miscellaneous
1 35 (9.43%) Management Information System
2 31 (8.36%) Self-Motivation
3 19 (5.12%) Data Centre
4 15 (4.04%) Product Ownership
5 14 (3.77%) Driving Licence
6 10 (2.70%) FMCG
7 9 (2.43%) PMI
8 7 (1.89%) PKI
9 6 (1.62%) iPhone
9 6 (1.62%) Team-Oriented Environment
10 5 (1.35%) Animation
10 5 (1.35%) NHS
10 5 (1.35%) Virtual Team
11 4 (1.08%) Digital Media
11 4 (1.08%) e-Health
11 4 (1.08%) Enterprise Software
11 4 (1.08%) IoT
11 4 (1.08%) Onboarding
11 4 (1.08%) Replication
12 3 (0.81%) Blockchain
Operating Systems
1 57 (15.36%) Windows
2 41 (11.05%) Windows Server
3 10 (2.70%) Linux
4 9 (2.43%) Windows Server 2019
5 8 (2.16%) Windows 10
5 8 (2.16%) Windows Server 2016
6 6 (1.62%) Windows Server 2012
7 5 (1.35%) Red Hat Enterprise Linux
8 4 (1.08%) Android
8 4 (1.08%) VMS
9 3 (0.81%) Windows 7
9 3 (0.81%) Windows Server 2003
10 2 (0.54%) Apple iOS
Processes & Methodologies
1 182 (49.06%) Project Management
2 79 (21.29%) Agile
3 76 (20.49%) Continuous Improvement
4 56 (15.09%) Change Management
5 53 (14.29%) Problem-Solving
6 51 (13.75%) ITIL
7 46 (12.40%) Roadmaps
8 43 (11.59%) Stakeholder Management
9 36 (9.70%) Waterfall
10 35 (9.43%) Line Management
10 35 (9.43%) Mentoring
11 34 (9.16%) Customer Service
12 33 (8.89%) Risk Management
13 32 (8.63%) PRINCE2
14 31 (8.36%) Business Case
14 31 (8.36%) Project Planning
14 31 (8.36%) Strategic Planning
15 28 (7.55%) Decision-Making
15 28 (7.55%) Service Management
16 24 (6.47%) Logistics
Programming Languages
1 26 (7.01%) SQL
2 15 (4.04%) PowerShell
3 13 (3.50%) JavaScript
3 13 (3.50%) Python
4 10 (2.70%) R
5 9 (2.43%) C#
6 7 (1.89%) MATLAB
7 4 (1.08%) VB
8 3 (0.81%) VB.NET
9 2 (0.54%) C++
9 2 (0.54%) Data Analysis Expressions
9 2 (0.54%) Java
9 2 (0.54%) T-SQL
10 1 (0.27%) ABAP
10 1 (0.27%) SAPscript
Qualifications
1 82 (22.10%) Degree
2 30 (8.09%) Security Cleared
3 26 (7.01%) Cisco Certification
4 20 (5.39%) SC Cleared
5 18 (4.85%) PMI Certification
6 16 (4.31%) Azure Certification
7 15 (4.04%) CCNP
8 13 (3.50%) CCNA
9 12 (3.23%) Chartered Engineer
9 12 (3.23%) Computer Science Degree
9 12 (3.23%) Master's Degree
9 12 (3.23%) PMP
10 11 (2.96%) CCIE
11 8 (2.16%) APMG
11 8 (2.16%) DV Cleared
11 8 (2.16%) Microsoft Certification
12 7 (1.89%) CCDP
12 7 (1.89%) CCIE Routing and Switching
12 7 (1.89%) VMware Certified Professional (VCP)
13 5 (1.35%) RHCSA
Quality Assurance & Compliance
1 23 (6.20%) QA
2 20 (5.39%) PMO
3 7 (1.89%) Automotive SPICE
3 7 (1.89%) AUTOSAR
3 7 (1.89%) ISO 26262
4 5 (1.35%) Accessibility
5 4 (1.08%) ISO/IEC 20000
5 4 (1.08%) Sarbanes-Oxley
6 3 (0.81%) ISO/IEC 27001
6 3 (0.81%) JSP 440
7 2 (0.54%) GDPR
7 2 (0.54%) GMP
7 2 (0.54%) SLA
8 1 (0.27%) Cyber Essentials
8 1 (0.27%) Data Quality
8 1 (0.27%) HIPAA
8 1 (0.27%) ISO 9001
8 1 (0.27%) P3O
System Software
1 52 (14.02%) Active Directory
2 29 (7.82%) VMware Infrastructure
3 27 (7.28%) Hyper-V
4 16 (4.31%) Docker
5 9 (2.43%) Virtual Desktop
6 7 (1.89%) Firmware
7 5 (1.35%) vSphere
7 5 (1.35%) XenDesktop
8 4 (1.08%) pfSense
9 3 (0.81%) VMware ESXi
10 2 (0.54%) Virtual Servers
Systems Management
1 16 (4.31%) Kubernetes
2 12 (3.23%) Microsoft Intune
2 12 (3.23%) Terraform
3 8 (2.16%) SCCM
4 7 (1.89%) Single Sign-On
5 5 (1.35%) Active Directory Federation Services
5 5 (1.35%) EMC NetWorker
5 5 (1.35%) Functional Safety
6 4 (1.08%) Grafana
7 3 (0.81%) AirWatch
7 3 (0.81%) Backup Exec
7 3 (0.81%) SCOM
8 2 (0.54%) FortiGate
9 1 (0.27%) HP ALM
Vendors
1 97 (26.15%) Microsoft
2 37 (9.97%) VMware
3 35 (9.43%) Cisco
4 19 (5.12%) Dell
5 17 (4.58%) EMC
6 16 (4.31%) ServiceNow
7 15 (4.04%) Veeam
8 13 (3.50%) SAP
9 12 (3.23%) Meraki
10 8 (2.16%) HP
10 8 (2.16%) Red Hat
10 8 (2.16%) Salesforce
11 7 (1.89%) Ekahau
12 6 (1.62%) CheckPoint
12 6 (1.62%) Fortinet
13 5 (1.35%) Apple
13 5 (1.35%) Citrix
13 5 (1.35%) Facebook
14 4 (1.08%) PagerDuty
14 4 (1.08%) Ubiquiti