Retail Jobs in the Midlands

Retailing
England > Midlands

The table below looks at the prevalence of the term Retail in permanent job vacancies in the Midlands. Included is a benchmarking guide to the salaries offered in vacancies that cited Retail over the 6 months leading up to 21 May 2025, comparing them to the same period in the previous two years.

6 months to
21 May 2025
Same period 2024 Same period 2023
Rank 21 26 81
Rank change year-on-year +5 +55 -31
Permanent jobs citing Retail 590 768 356
As % of all permanent jobs advertised in the Midlands 8.36% 6.35% 3.93%
As % of the General category 13.89% 11.29% 5.33%
Number of salaries quoted 143 499 216
10th Percentile £24,894 £25,500 £33,125
25th Percentile £32,256 £30,000 £43,719
Median annual salary (50th Percentile) £44,810 £41,492 £55,000
Median % change year-on-year +8.00% -24.56% +10.00%
75th Percentile £58,750 £55,000 £71,250
90th Percentile £75,500 £66,500 £76,250
England median annual salary £52,500 £47,500 £60,000
% change year-on-year +10.53% -20.83% +4.35%

All General Skills
Midlands

Retail falls under the General Skills category. For comparison with the information above, the following table provides summary statistics for all permanent job vacancies requiring common skills in the Midlands.

Permanent vacancies with a requirement for common skills 4,248 6,801 6,673
As % of all permanent jobs advertised in the Midlands 60.17% 56.24% 73.60%
Number of salaries quoted 1,815 4,718 3,035
10th Percentile £26,250 £25,500 £28,000
25th Percentile £32,500 £31,250 £37,000
Median annual salary (50th Percentile) £47,500 £45,000 £52,500
Median % change year-on-year +5.56% -14.29% +10.53%
75th Percentile £62,500 £60,000 £66,250
90th Percentile £75,000 £72,500 £77,500
England median annual salary £56,500 £52,500 £60,000
% change year-on-year +7.62% -12.50% -

Retail
Job Vacancy Trend in the Midlands

Job postings citing Retail as a proportion of all IT jobs advertised in the Midlands.
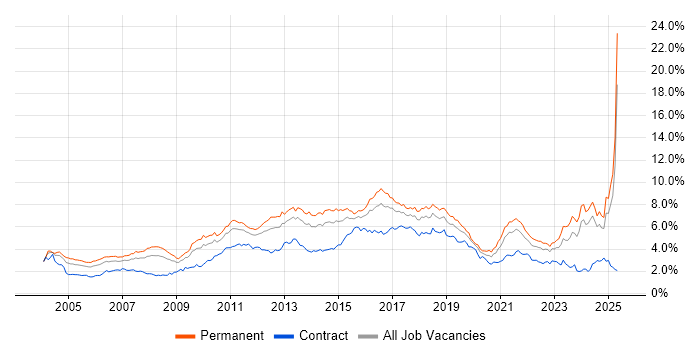
Job vacancy trend for Retail in the Midlands

Retail
Salary Trend in the Midlands

3-month moving average salary quoted in jobs citing Retail in the Midlands.

Salary trend for Retail in the Midlands

Retail
Salary Histogram in the Midlands

Salary distribution for jobs citing Retail in the Midlands over the 6 months to 21 May 2025.

Salary histogram for Retail in the Midlands

Retail
Job Locations in the Midlands

The table below looks at the demand and provides a guide to the median salaries quoted in IT jobs citing Retail within the Midlands region over the 6 months to 21 May 2025. The 'Rank Change' column provides an indication of the change in demand within each location based on the same 6 month period last year.

Location Rank Change
on Same Period
Last Year
Matching
Permanent
IT Job Ads
Median Salary
Past 6 Months
Median Salary
% Change
on Same Period
Last Year
Live
Jobs
West Midlands +11 303 £44,810 -0.42% 250
East Midlands +4 285 £42,500 +13.33% 204
Retail
England

Retail
Co-occurring Skills and Capabilities in the Midlands by Category

The follow tables expand on the table above by listing co-occurrences grouped by category. The same employment type, locality and period is covered with up to 20 co-occurrences shown in each of the following categories:

Application Platforms
1 10 (1.69%) CMS
2 3 (0.51%) Apache Spark
2 3 (0.51%) SharePoint
2 3 (0.51%) WordPress
3 2 (0.34%) Confluence
3 2 (0.34%) Headless CMS
3 2 (0.34%) Strapi
4 1 (0.17%) IIS
4 1 (0.17%) Microsoft Exchange
Applications
1 27 (4.58%) Microsoft Office
2 23 (3.90%) Microsoft Excel
3 8 (1.36%) Microsoft PowerPoint
4 4 (0.68%) Adobe Creative Suite
5 1 (0.17%) Microsoft Project
Business Applications
1 22 (3.73%) Dynamics AX
2 18 (3.05%) Shopify
3 16 (2.71%) Magento
4 6 (1.02%) SAP S/4HANA
5 1 (0.17%) SAP Business One
5 1 (0.17%) SAP CAR
5 1 (0.17%) SAP Retail
5 1 (0.17%) SAP SD
Cloud Services
1 68 (11.53%) Azure
2 39 (6.61%) Microsoft 365
3 37 (6.27%) AWS
4 19 (3.22%) SaaS
5 14 (2.37%) BigCommerce
5 14 (2.37%) Serverless
6 13 (2.20%) Google Workspace
7 8 (1.36%) Google Analytics
8 6 (1.02%) AWS Lambda
8 6 (1.02%) GCP
8 6 (1.02%) Power Platform
9 4 (0.68%) Amazon EC2
9 4 (0.68%) Amazon S3
9 4 (0.68%) Azure Data Factory
9 4 (0.68%) Azure Synapse Analytics
9 4 (0.68%) Cloud Functions
9 4 (0.68%) Google App Engine
9 4 (0.68%) Google Compute Engine
10 3 (0.51%) Entra ID
10 3 (0.51%) GitHub
Communications & Networking
1 33 (5.59%) WAN
2 31 (5.25%) LAN
3 30 (5.08%) VoIP
4 15 (2.54%) DNS
4 15 (2.54%) Firewall
4 15 (2.54%) VLAN
5 14 (2.37%) DHCP
6 13 (2.20%) BGP
6 13 (2.20%) OSPF
6 13 (2.20%) TCP/IP
6 13 (2.20%) WLAN
7 5 (0.85%) Intrusion Detection
8 3 (0.51%) Network Security
9 2 (0.34%) IP Telephony
9 2 (0.34%) Remote Desktop
9 2 (0.34%) SD-WAN
10 1 (0.17%) Internet
10 1 (0.17%) RFID
Database & Business Intelligence
1 21 (3.56%) SQL Server
2 13 (2.20%) Tableau
3 5 (0.85%) Power BI
4 4 (0.68%) BigQuery
4 4 (0.68%) Cloud Spanner
4 4 (0.68%) Data Lake
4 4 (0.68%) NoSQL
4 4 (0.68%) PostgreSQL
5 3 (0.51%) Amazon Athena
5 3 (0.51%) Data Mining
5 3 (0.51%) Data Warehouse
5 3 (0.51%) Parquet
5 3 (0.51%) Spark SQL
6 2 (0.34%) MySQL
7 1 (0.17%) Amazon RDS
7 1 (0.17%) Azure SQL Database
7 1 (0.17%) DynamoDB
7 1 (0.17%) SAP BW
7 1 (0.17%) SAP HANA
7 1 (0.17%) SQL Server Integration Services
Development Applications
1 22 (3.73%) JIRA
2 19 (3.22%) GitLab
3 18 (3.05%) Git
4 17 (2.88%) Maven
5 16 (2.71%) Bitbucket
5 16 (2.71%) Cucumber
5 16 (2.71%) Selenium
5 16 (2.71%) SonarQube
5 16 (2.71%) Sonatype Nexus
6 2 (0.34%) JMeter
6 2 (0.34%) LoadRunner
6 2 (0.34%) Postman
7 1 (0.17%) Jenkins
7 1 (0.17%) SpecFlow
7 1 (0.17%) Subversion
7 1 (0.17%) Team Foundation Server
7 1 (0.17%) Visual Studio
General
1 314 (53.22%) Manufacturing
2 120 (20.34%) Social Skills
3 116 (19.66%) Finance
4 76 (12.88%) Dutch Language
4 76 (12.88%) Finnish Language
4 76 (12.88%) Norwegian Language
5 66 (11.19%) Analytical Skills
6 45 (7.63%) Telecoms
7 42 (7.12%) Marketing
8 27 (4.58%) Inclusion and Diversity
9 22 (3.73%) Games
10 21 (3.56%) Automotive
10 21 (3.56%) Organisational Skills
11 20 (3.39%) Banking
12 19 (3.22%) Catalan Language
13 17 (2.88%) Presentation Skills
14 16 (2.71%) Corporate Banking
14 16 (2.71%) Investment Banking
15 8 (1.36%) Public Sector
16 5 (0.85%) Influencing Skills
Job Titles
1 285 (48.31%) Trainer
2 40 (6.78%) Senior
3 32 (5.42%) IT Support
4 30 (5.08%) IT Support Specialist
4 30 (5.08%) Support Specialist
5 29 (4.92%) Analyst
6 23 (3.90%) Risk Manager
6 23 (3.90%) Technology Risk Manager
7 21 (3.56%) Software Engineer
8 19 (3.22%) Developer
9 16 (2.71%) Systems Engineer
9 16 (2.71%) Technical Support
10 15 (2.54%) IT Engineer
11 13 (2.20%) Project Manager
12 12 (2.03%) Architect
12 12 (2.03%) Lead
13 11 (1.86%) Solutions Architect
14 9 (1.53%) Data Analyst
15 8 (1.36%) Consultant
16 7 (1.19%) Lead Developer
Libraries, Frameworks & Software Standards
1 35 (5.93%) HTML
2 29 (4.92%) CSS
3 25 (4.24%) React
4 20 (3.39%) RESTful
5 18 (3.05%) Kafka
6 17 (2.88%) HTML5
6 17 (2.88%) REST
6 17 (2.88%) Sass
6 17 (2.88%) Spring
6 17 (2.88%) Spring Boot
7 16 (2.71%) CSS3
7 16 (2.71%) Jest
7 16 (2.71%) JPA
7 16 (2.71%) Redux
8 8 (1.36%) Node.js
9 7 (1.19%) .NET
10 6 (1.02%) PySpark
11 4 (0.68%) Express.js
11 4 (0.68%) React Native
12 3 (0.51%) XGBoost
Miscellaneous
1 330 (55.93%) Robotics
2 45 (7.63%) Blockchain
3 40 (6.78%) Management Information System
4 30 (5.08%) CCTV
5 22 (3.73%) Product Ownership
6 18 (3.05%) EPoS
7 17 (2.88%) Enterprise Software
8 13 (2.20%) Smartphone
9 10 (1.69%) Mobile App
10 6 (1.02%) Driving Licence
10 6 (1.02%) Onboarding
11 4 (0.68%) FMCG
12 3 (0.51%) Data Protection Act
12 3 (0.51%) Self-Motivation
12 3 (0.51%) Social Media
13 2 (0.34%) Cloud Native
13 2 (0.34%) Cyber Defence
13 2 (0.34%) Greenfield Project
13 2 (0.34%) Public Cloud
13 2 (0.34%) Security Posture
Operating Systems
1 52 (8.81%) Windows
2 45 (7.63%) Windows 10
3 15 (2.54%) Windows Server
4 14 (2.37%) Linux
5 13 (2.20%) Mac OS X
5 13 (2.20%) Ubuntu
5 13 (2.20%) Windows Server 2016
5 13 (2.20%) Windows Server 2019
6 2 (0.34%) Android
7 1 (0.17%) Apple iOS
Processes & Methodologies
1 339 (57.46%) Artificial Intelligence
2 329 (55.76%) Problem-Solving
3 289 (48.98%) Machine Learning
4 285 (48.31%) Generative AI
4 285 (48.31%) LLM
4 285 (48.31%) Red Team
5 223 (37.80%) Data Privacy
6 85 (14.41%) Agile
6 85 (14.41%) Mentoring
7 80 (13.56%) Analytics
8 52 (8.81%) Coaching
9 49 (8.31%) Data Analytics
10 45 (7.63%) Robotic Process Automation
11 43 (7.29%) Creative Thinking
12 41 (6.95%) ERP
13 38 (6.44%) Cybersecurity
13 38 (6.44%) E-Commerce
14 33 (5.59%) Customer Service
14 33 (5.59%) Software Engineering
15 30 (5.08%) Information Security
Programming Languages
1 62 (10.51%) SQL
2 38 (6.44%) JavaScript
3 26 (4.41%) Java
4 20 (3.39%) Python
5 17 (2.88%) TypeScript
6 15 (2.54%) PowerShell
7 14 (2.37%) C#
8 7 (1.19%) Delphi
9 3 (0.51%) Ruby
10 2 (0.34%) VB.NET
11 1 (0.17%) PHP
11 1 (0.17%) SAPscript
Qualifications
1 365 (61.86%) Degree
2 25 (4.24%) DBS Check
3 23 (3.90%) CISA
4 22 (3.73%) ISACA
5 20 (3.39%) Computer Science Degree
6 15 (2.54%) HNC
7 13 (2.20%) HND
7 13 (2.20%) MCSE
7 13 (2.20%) Microsoft Certification
8 9 (1.53%) Master's Degree
9 4 (0.68%) CISM
9 4 (0.68%) MRICS
10 3 (0.51%) CISSP
10 3 (0.51%) SANS
11 2 (0.34%) IISP
11 2 (0.34%) ITIL Certification
11 2 (0.34%) MAPM
11 2 (0.34%) PMI Certification
11 2 (0.34%) PMP
11 2 (0.34%) Security Cleared
Quality Assurance & Compliance
1 45 (7.63%) ITGC
2 21 (3.56%) Accessibility
2 21 (3.56%) QA
3 8 (1.36%) Data Quality
4 4 (0.68%) PCI DSS
5 3 (0.51%) Actionable Recommendations
5 3 (0.51%) GDPR
5 3 (0.51%) ISO/IEC 27001
5 3 (0.51%) Sarbanes-Oxley
6 2 (0.34%) GRC
6 2 (0.34%) ISO/IEC 20000
6 2 (0.34%) PMO
7 1 (0.17%) Cyber Essentials
7 1 (0.17%) Cyber Essentials PLUS
7 1 (0.17%) GMP
7 1 (0.17%) NEBOSH
7 1 (0.17%) NIST
System Software
1 49 (8.31%) Active Directory
2 18 (3.05%) Docker
3 3 (0.51%) Virtual Servers
4 2 (0.34%) VMware Infrastructure
5 1 (0.17%) Hyper-V
Systems Management
1 17 (2.88%) Kubernetes
2 1 (0.17%) Failover Clustering
2 1 (0.17%) Microsoft Clustering
2 1 (0.17%) Microsoft Intune
2 1 (0.17%) SCCM
2 1 (0.17%) SCOM
2 1 (0.17%) Single Sign-On
Vendors
1 310 (52.54%) Google
2 305 (51.69%) Databricks
3 289 (48.98%) Adobe
4 76 (12.88%) Microsoft
5 30 (5.08%) SAP
6 23 (3.90%) Oracle
7 16 (2.71%) Solace
8 15 (2.54%) Cisco
9 14 (2.37%) Fortinet
10 13 (2.20%) Apple
10 13 (2.20%) Dell
10 13 (2.20%) Ubiquiti
11 5 (0.85%) Facebook
11 5 (0.85%) YouTube
12 3 (0.51%) Instagram
12 3 (0.51%) Twitter
13 2 (0.34%) Avaya
13 2 (0.34%) NEC
13 2 (0.34%) Optimizely
13 2 (0.34%) SolarWinds