Zerto
UK

The table below provides summary statistics for permanent job vacancies requiring knowledge or experience of Zerto products and/or services. It includes a benchmarking guide to the annual salaries offered in vacancies that cited Zerto over the 6 months leading up to 16 September 2024, comparing them to the same period in the previous two years.

The figures below represent the IT labour market in general and are not representative of salaries within Zerto Ltd.

6 months to
16 Sep 2024
Same period 2023 Same period 2022
Rank 809 763 1180
Rank change year-on-year -46 +417 -200
Permanent jobs citing Zerto 27 43 29
As % of all permanent jobs advertised in the UK 0.033% 0.066% 0.019%
As % of the Vendors category 0.099% 0.16% 0.047%
Number of salaries quoted 21 42 23
10th Percentile £47,500 £32,500 £41,250
25th Percentile £53,750 £33,500 £44,500
Median annual salary (50th Percentile) £57,500 £35,000 £57,646
Median % change year-on-year +64.29% -39.28% +9.80%
75th Percentile £62,500 £45,500 £63,750
90th Percentile £63,750 £58,000 £67,500
UK excluding London median annual salary £57,500 £35,000 £50,000
% change year-on-year +64.29% -30.00% -4.76%

All Vendors
UK

Zerto falls under the Vendor Products and Services category. For comparison with the information above, the following table provides summary statistics for all permanent job vacancies requiring knowledge or experience of all vendor products and services.

Permanent vacancies with a requirement for knowledge or experience of vendor products and services 27,188 26,879 61,294
As % of all permanent jobs advertised in the UK 32.93% 41.52% 39.67%
Number of salaries quoted 13,682 18,945 32,668
10th Percentile £31,000 £30,050 £30,822
25th Percentile £40,000 £41,000 £41,250
Median annual salary (50th Percentile) £55,000 £57,500 £55,000
Median % change year-on-year -4.35% +4.55% -
75th Percentile £75,000 £75,000 £75,000
90th Percentile £92,500 £91,250 £92,500
UK excluding London median annual salary £50,000 £50,000 £49,000
% change year-on-year - +2.04% +3.16%

Zerto
Job Vacancy Trend

Job postings citing Zerto as a proportion of all IT jobs advertised.
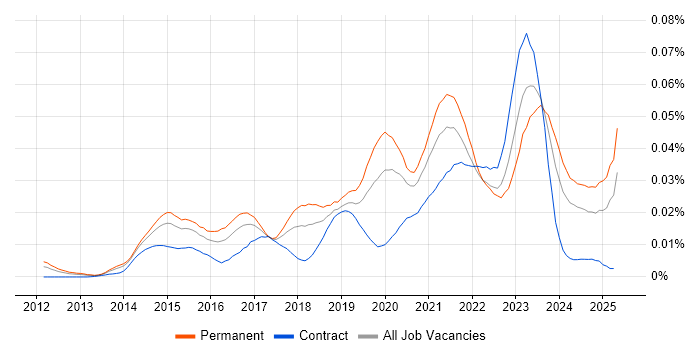
Job vacancy trend for Zerto in the UK

Zerto
Salary Trend

3-month moving average salary quoted in jobs citing Zerto.

Salary trend for Zerto in the UK

Zerto
Salary Histogram

Salary distribution for jobs citing Zerto over the 6 months to 16 September 2024.

Salary histogram for Zerto in the UK

Zerto
Top 11 Job Locations

The table below looks at the demand and provides a guide to the median salaries quoted in IT jobs citing Zerto within the UK over the 6 months to 16 September 2024. The 'Rank Change' column provides an indication of the change in demand within each location based on the same 6 month period last year.

Location Rank Change
on Same Period
Last Year
Matching
Permanent
IT Job Ads
Median Salary
Past 6 Months
Median Salary
% Change
on Same Period
Last Year
Live
Jobs
England -41 27 £57,500 +64.29% 6
UK excluding London -60 25 £57,500 +64.29% 5
Work from Home +36 13 £50,000 +5.26% 4
North of England +6 11 £50,000 +88.68% 4
South East -45 8 £60,000 +46.34%
West Midlands -30 6 £57,500 +64.29%
Midlands -35 6 £57,500 +64.29%
North West - 5 - - 1
Yorkshire +36 3 £54,000 +103.77% 3
North East - 3 £50,000 -
London +25 2 £72,500 +52.63% 2

Zerto
Co-occurring Skills and Capabilities by Category

The follow tables expand on the table above by listing co-occurrences grouped by category. The same employment type, locality and period is covered with up to 20 co-occurrences shown in each of the following categories:

Application Platforms
1 8 (29.63%) Microsoft Exchange
1 8 (29.63%) SharePoint
2 4 (14.81%) Apache
2 4 (14.81%) IIS
2 4 (14.81%) OpenStack
Applications
1 1 (3.70%) Microsoft Office
Cloud Services
1 20 (74.07%) Azure
2 13 (48.15%) Microsoft 365
3 11 (40.74%) AWS
4 9 (33.33%) Entra ID
5 6 (22.22%) SaaS
6 5 (18.52%) IaaS
6 5 (18.52%) PaaS
7 4 (14.81%) Amazon S3
7 4 (14.81%) AWS CloudFormation
7 4 (14.81%) AWS Lambda
7 4 (14.81%) OneDrive
7 4 (14.81%) Route 53
7 4 (14.81%) Serverless
8 2 (7.41%) Mimecast
Communications & Networking
1 16 (59.26%) Firewall
2 15 (55.56%) DNS
3 11 (40.74%) DHCP
4 8 (29.63%) iSCSI
5 7 (25.93%) SAN
6 5 (18.52%) WAN
7 4 (14.81%) Broadband
7 4 (14.81%) Fibre Channel
7 4 (14.81%) IPv6
7 4 (14.81%) MPLS
7 4 (14.81%) SD-WAN
7 4 (14.81%) Skype
7 4 (14.81%) SNMP
7 4 (14.81%) TCP/IP
7 4 (14.81%) VLAN
7 4 (14.81%) VoIP
7 4 (14.81%) VPN
8 2 (7.41%) NAS
8 2 (7.41%) Network Security
9 1 (3.70%) Remote Desktop
Database & Business Intelligence
1 6 (22.22%) SQL Server
2 5 (18.52%) PostgreSQL
3 4 (14.81%) Amazon RDS
Development Applications
1 4 (14.81%) Git
General
1 17 (62.96%) Social Skills
2 9 (33.33%) Analytical Skills
3 5 (18.52%) Retail
4 4 (14.81%) Finance
4 4 (14.81%) Influencing Skills
4 4 (14.81%) Telecoms
5 1 (3.70%) Inclusion and Diversity
Job Titles
1 12 (44.44%) Senior
2 8 (29.63%) Coordinator
2 8 (29.63%) Infrastructure Engineer
2 8 (29.63%) Senior Infrastructure Engineer
3 7 (25.93%) Service Continuity Coordinator
4 5 (18.52%) Infrastructure Manager
4 5 (18.52%) IT Infrastructure Manager
4 5 (18.52%) IT Manager
4 5 (18.52%) Systems Engineer
5 4 (14.81%) Senior Systems Engineer
6 2 (7.41%) Disaster Recovery Coordinator
6 2 (7.41%) IT Engineer
6 2 (7.41%) IT Infrastructure Engineer
6 2 (7.41%) Senior IT Engineer
7 1 (3.70%) Architect
7 1 (3.70%) Network Infrastructure Manager
7 1 (3.70%) Solutions Architect
Libraries, Frameworks & Software Standards
1 4 (14.81%) LAPP Stack
2 3 (11.11%) REST
Miscellaneous
1 12 (44.44%) Replication
2 9 (33.33%) Management Information System
3 6 (22.22%) Data Centre
4 4 (14.81%) Private Cloud
5 1 (3.70%) Hybrid Cloud
5 1 (3.70%) Mainframe
5 1 (3.70%) Public Cloud
Operating Systems
1 15 (55.56%) Windows
2 6 (22.22%) Linux
3 5 (18.52%) Windows Server 2019
4 4 (14.81%) VMS
4 4 (14.81%) Windows 10
4 4 (14.81%) Windows Server
5 3 (11.11%) Windows Server 2008
6 2 (7.41%) Windows Server 2016
7 1 (3.70%) Red Hat Enterprise Linux
7 1 (3.70%) Unix
Processes & Methodologies
1 13 (48.15%) Cybersecurity
1 13 (48.15%) ITIL
2 12 (44.44%) Disaster Recovery
3 10 (37.04%) Problem-Solving
4 9 (33.33%) BCP
4 9 (33.33%) Business Continuity
4 9 (33.33%) Infrastructure Engineering
5 8 (29.63%) Business Continuity Planning
5 8 (29.63%) Mentoring
5 8 (29.63%) Project Delivery
6 6 (22.22%) Server Management
6 6 (22.22%) Service Management
7 5 (18.52%) Customer Service
7 5 (18.52%) Information Security
7 5 (18.52%) Project Management
8 4 (14.81%) Computer Science
8 4 (14.81%) IT Strategy
8 4 (14.81%) Kanban
8 4 (14.81%) Network Design
8 4 (14.81%) Workload Management
Programming Languages
1 10 (37.04%) PowerShell
2 8 (29.63%) Python
3 5 (18.52%) SQL
4 4 (14.81%) Bash
Qualifications
1 4 (14.81%) Azure Certification
1 4 (14.81%) Computer Science Degree
1 4 (14.81%) Degree
2 3 (11.11%) VMware Certified Professional (VCP)
Quality Assurance & Compliance
1 4 (14.81%) ISO 9001
1 4 (14.81%) ISO/IEC 27001
System Software
1 13 (48.15%) Active Directory
2 10 (37.04%) Hyper-V
3 9 (33.33%) VMware Infrastructure
4 8 (29.63%) vSphere
5 4 (14.81%) Ceph
5 4 (14.81%) pfSense
6 1 (3.70%) Microsoft App-V
6 1 (3.70%) vCloud
Systems Management
1 10 (37.04%) Puppet
2 8 (29.63%) Ansible
3 5 (18.52%) Kubernetes
4 4 (14.81%) Active Directory Federation Services
4 4 (14.81%) Microsoft Intune
4 4 (14.81%) N-central
5 2 (7.41%) Avamar
5 2 (7.41%) Progress Chef
5 2 (7.41%) Terraform
6 1 (3.70%) FortiGate
6 1 (3.70%) Nagios
6 1 (3.70%) ZABBIX
Vendors
1 19 (70.37%) VMware
2 18 (66.67%) Microsoft
2 18 (66.67%) Veeam
3 11 (40.74%) Cisco
4 10 (37.04%) Commvault
5 8 (29.63%) Fortinet
6 7 (25.93%) Dell
7 6 (22.22%) Citrix
8 4 (14.81%) BroadSoft
8 4 (14.81%) Brocade
8 4 (14.81%) Dell Compellent
8 4 (14.81%) Draytek
8 4 (14.81%) Juniper
8 4 (14.81%) Mitel
8 4 (14.81%) Palo Alto
8 4 (14.81%) QNAP
8 4 (14.81%) Sophos
8 4 (14.81%) Ubiquiti
9 2 (7.41%) HP
9 2 (7.41%) Varonis