Red Hat
UK

The table below provides summary statistics for permanent job vacancies with a requirement for knowledge and experience of Red Hat products and/or services. Included is a benchmarking guide to the salaries offered in vacancies that have cited Red Hat over the 6 months to 7 December 2023 with a comparison to the same period in the previous 2 years.

The figures below represent the IT labour market in general and are not representative of salaries within Red Hat, Inc.

6 months to
7 Dec 2023
Same period 2022 Same period 2021
Rank 371 401 429
Rank change year-on-year +30 +28 -113
Permanent jobs citing Red Hat 414 983 971
As % of all permanent jobs advertised in the UK 0.78% 0.80% 0.76%
As % of the Vendors category 1.86% 1.94% 1.93%
Number of salaries quoted 245 608 587
10th Percentile £41,250 £40,000 £38,750
25th Percentile £49,000 £48,625 £45,750
Median annual salary (50th Percentile) £62,000 £60,000 £60,000
Median % change year-on-year +3.33% - +14.29%
75th Percentile £88,750 £77,500 £82,500
90th Percentile £102,500 £95,000 £100,500
UK excluding London median annual salary £52,500 £55,000 £52,500
% change year-on-year -4.55% +4.76% +10.53%

All Vendors
UK

Red Hat is in the Vendor Products and Services category. The following table is for comparison with the above and provides summary statistics for all permanent job vacancies with a requirement for knowledge or experience of vendor products and services.

Permanent vacancies with a requirement for knowledge or experience of vendor products and services 22,214 50,563 50,260
As % of all permanent jobs advertised in the UK 41.93% 41.16% 39.22%
Number of salaries quoted 16,235 29,708 33,438
10th Percentile £29,000 £31,250 £30,000
25th Percentile £40,000 £41,250 £39,500
Median annual salary (50th Percentile) £55,000 £57,500 £55,000
Median % change year-on-year -4.35% +4.55% +4.76%
75th Percentile £73,750 £77,500 £73,750
90th Percentile £91,934 £95,000 £88,750
UK excluding London median annual salary £49,500 £50,000 £47,500
% change year-on-year -1.00% +5.26% +4.40%

Red Hat
Job Vacancy Trend

Job postings citing Red Hat as a proportion of all IT jobs advertised.
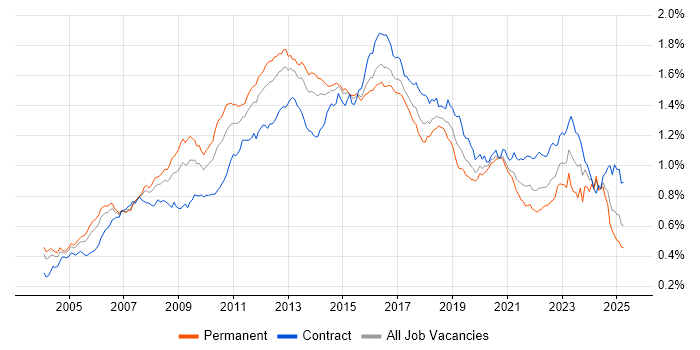
Job vacancy trend for Red Hat in the UK

Red Hat
Salary Trend

3-month moving average salary quoted in jobs citing Red Hat.

Salary trend for Red Hat in the UK

Red Hat
Salary Histogram

Salary distribution for jobs citing Red Hat over the 6 months to 7 December 2023.

Salary histogram for Red Hat in the UK

Red Hat
Top 17 Job Locations

The table below looks at the demand and provides a guide to the median salaries quoted in IT jobs citing Red Hat within the UK over the 6 months to 7 December 2023. The 'Rank Change' column provides an indication of the change in demand within each location based on the same 6 month period last year.

Location Rank Change
on Same Period
Last Year
Matching
Permanent
IT Job Ads
Median Salary
Past 6 Months
Median Salary
% Change
on Same Period
Last Year
Live
Jobs
England +31 378 £62,500 +4.17% 109
UK excluding London +33 251 £52,500 -4.55% 65
London +109 136 £82,500 +17.86% 51
Work from Home -40 134 £65,000 +8.33% 56
South West +68 97 £52,500 -16.00% 11
South East +51 57 £52,500 - 23
North of England +97 41 £51,000 -14.66% 15
North West +97 25 £47,500 -18.82% 11
East of England +79 20 £55,500 +0.91% 6
Midlands +15 16 £62,500 +13.64% 6
Yorkshire +78 15 £55,000 -8.33% 4
Scotland +27 11 £50,000 -16.00% 4
East Midlands +6 9 £50,000 -16.67% 1
West Midlands +54 7 £68,750 +36.31% 5
Wales +8 7 £39,500 -21.00% 1
Northern Ireland +35 4 - -
North East +44 1 £65,000 -

Red Hat
Co-occurring Skills and Capabilities by Category

The follow tables expand on the table above by listing co-occurrences grouped by category. The same employment type, locality and period is covered with up to 20 co-occurrences shown in each of the following categories:

Application Platforms
1 30 (7.25%) Apache
2 25 (6.04%) Confluence
3 14 (3.38%) IIS
4 10 (2.42%) Apache Spark
4 10 (2.42%) nginx
4 10 (2.42%) WebSphere
5 9 (2.17%) NetWeaver
5 9 (2.17%) Oracle SOA Suite
5 9 (2.17%) WebLogic
6 8 (1.93%) MS Exchange
7 5 (1.21%) OpenStack
7 5 (1.21%) Tomcat
8 3 (0.72%) Red Hat Fuse
9 2 (0.48%) JBoss
10 1 (0.24%) CMS
10 1 (0.24%) Oracle Application Server
10 1 (0.24%) SAS
10 1 (0.24%) WinCC
Applications
1 7 (1.69%) AutoCAD
1 7 (1.69%) PTC Creo
1 7 (1.69%) SOLIDWORKS
Business Applications
1 12 (2.90%) Fidessa
2 3 (0.72%) Oracle Procure-to-Pay
3 1 (0.24%) Sage X3
3 1 (0.24%) SAP ERP
3 1 (0.24%) SAP GTS
3 1 (0.24%) SAP MM
3 1 (0.24%) SAP SD
3 1 (0.24%) SAP WM
Cloud Services
1 186 (44.93%) AWS
2 135 (32.61%) Azure
3 118 (28.50%) OpenShift
4 41 (9.90%) SaaS
5 28 (6.76%) GCP
6 19 (4.59%) PaaS
7 18 (4.35%) GitHub
7 18 (4.35%) IaaS
8 13 (3.14%) Amazon EKS
8 13 (3.14%) Microsoft 365
9 12 (2.90%) Entra ID
10 11 (2.66%) Azure DevOps
11 9 (2.17%) Serverless
12 8 (1.93%) AWS Lambda
13 7 (1.69%) Amazon EC2
14 6 (1.45%) Amazon CloudWatch
14 6 (1.45%) AWS CloudFormation
15 5 (1.21%) Amazon S3
16 3 (0.72%) Cloud Computing
16 3 (0.72%) CloudFront
Communications & Networking
1 111 (26.81%) DNS
2 100 (24.15%) TCP/IP
3 93 (22.46%) DHCP
4 78 (18.84%) HTTP
5 46 (11.11%) Firewall
6 33 (7.97%) SAN
7 19 (4.59%) VPN
8 15 (3.62%) VLAN
9 13 (3.14%) Internet
9 13 (3.14%) WAN
10 12 (2.90%) FIX Connectivity
11 11 (2.66%) IPv4
11 11 (2.66%) Network Security
12 10 (2.42%) OSPF
13 6 (1.45%) LAN
14 5 (1.21%) AMQP
14 5 (1.21%) NAS
15 4 (0.97%) Kerberos
15 4 (0.97%) VSAN
16 3 (0.72%) VXLAN
Database & Business Intelligence
1 33 (7.97%) SQL Server
2 28 (6.76%) MongoDB
3 24 (5.80%) MySQL
4 21 (5.07%) PostgreSQL
5 17 (4.11%) SAP HANA
6 14 (3.38%) Data Warehouse
7 10 (2.42%) Big Data
7 10 (2.42%) Hadoop
8 9 (2.17%) Oracle ODI
8 9 (2.17%) Oracle Reports
9 6 (1.45%) BusinessObjects
9 6 (1.45%) SAP BW
10 5 (1.21%) Apache Hive
10 5 (1.21%) Cloudera CDH
10 5 (1.21%) Tick Data
11 3 (0.72%) Amazon Redshift
11 3 (0.72%) Firebird
11 3 (0.72%) Oracle Database
12 2 (0.48%) Bigtable
12 2 (0.48%) Relational Database
Development Applications
1 55 (13.29%) Git
2 38 (9.18%) Jenkins
3 25 (6.04%) Artifactory
4 22 (5.31%) GitLab
5 19 (4.59%) Atlassian Bamboo
5 19 (4.59%) Liquibase
6 15 (3.62%) JIRA
7 9 (2.17%) Oracle Forms
8 8 (1.93%) Chocolatey
9 5 (1.21%) GCC
10 3 (0.72%) Vagrant
11 2 (0.48%) TeamCity
12 1 (0.24%) Bitbucket
12 1 (0.24%) Jasmine
12 1 (0.24%) JUnit
12 1 (0.24%) Maven
12 1 (0.24%) Selenium
12 1 (0.24%) Subversion
12 1 (0.24%) Visual Studio
12 1 (0.24%) WebDriver
General
1 101 (24.40%) Finance
2 61 (14.73%) Social Skills
3 49 (11.84%) Aerospace
4 43 (10.39%) Banking
5 21 (5.07%) Investment Banking
6 15 (3.62%) Public Sector
7 12 (2.90%) Analytical Skills
8 7 (1.69%) Military
9 5 (1.21%) Inclusion and Diversity
10 4 (0.97%) Documentation Skills
10 4 (0.97%) Organisational Skills
10 4 (0.97%) Pharmaceutical
11 3 (0.72%) Games
11 3 (0.72%) Presentation Skills
11 3 (0.72%) Telecoms
12 2 (0.48%) Advertising
12 2 (0.48%) Aviation
12 2 (0.48%) Billing
12 2 (0.48%) Electronics
12 2 (0.48%) Law
Job Titles
1 141 (34.06%) Infrastructure Engineer
2 73 (17.63%) Linux Engineer
3 56 (13.53%) Administrator
3 56 (13.53%) Senior
4 39 (9.42%) DevOps Engineer
5 29 (7.00%) Senior Infrastructure Engineer
6 27 (6.52%) Systems Administrator
6 27 (6.52%) Systems Engineer
7 24 (5.80%) Linux Infrastructure Engineer
8 22 (5.31%) DBA
9 20 (4.83%) Lead
10 18 (4.35%) Applications Support
11 16 (3.86%) Analyst
11 16 (3.86%) Cloud Engineer
12 15 (3.62%) 3rd Line Support
12 15 (3.62%) Linux Administrator
13 14 (3.38%) Senior Systems Engineer
13 14 (3.38%) Support Analyst
14 12 (2.90%) Applications Support Analyst
14 12 (2.90%) Unix Engineer
Libraries, Frameworks & Software Standards
1 27 (6.52%) Kafka
2 17 (4.11%) REST
3 14 (3.38%) XML
4 13 (3.14%) FIX Protocol
5 10 (2.42%) OAuth
5 10 (2.42%) OpenID
5 10 (2.42%) YAML
6 9 (2.17%) Keycloak
6 9 (2.17%) OAuth2
6 9 (2.17%) SAML
6 9 (2.17%) SAP PI
7 8 (1.93%) Elastic Stack
7 8 (1.93%) LDAP
8 7 (1.69%) RabbitMQ
9 6 (1.45%) Middleware
9 6 (1.45%) Node.js
9 6 (1.45%) Spring
9 6 (1.45%) Spring Boot
10 5 (1.21%) React
10 5 (1.21%) Swagger
Miscellaneous
1 26 (6.28%) Public Cloud
2 24 (5.80%) Data Centre
2 24 (5.80%) Self-Motivation
3 17 (4.11%) Linux Command Line
4 14 (3.38%) Blackberry
4 14 (3.38%) Virtual Team
5 13 (3.14%) Eurex
6 11 (2.66%) Enterprise Software
6 11 (2.66%) Private Cloud
7 10 (2.42%) Clustering
8 7 (1.69%) Cloud Native
8 7 (1.69%) Operational Technology
9 6 (1.45%) Greenfield Project
9 6 (1.45%) Legacy Systems
9 6 (1.45%) Product Ownership
10 5 (1.21%) Cyber Defence
10 5 (1.21%) Distributed Systems
10 5 (1.21%) Management Information System
10 5 (1.21%) Onboarding
10 5 (1.21%) Security Posture
Operating Systems
1 364 (87.92%) Linux
2 248 (59.90%) Red Hat Enterprise Linux
3 200 (48.31%) Windows
4 96 (23.19%) CentOS
4 96 (23.19%) Unix
5 85 (20.53%) Windows Server
6 68 (16.43%) Ubuntu
7 46 (11.11%) Solaris
8 37 (8.94%) Windows Server 2019
9 35 (8.45%) Windows Server 2012
10 31 (7.49%) Windows Server 2016
11 27 (6.52%) Debian
12 20 (4.83%) Fedora
13 14 (3.38%) Windows 10
14 13 (3.14%) Data ONTAP
15 12 (2.90%) AIX
16 11 (2.66%) HPUX
17 7 (1.69%) openSUSE
18 6 (1.45%) CoreOS
19 2 (0.48%) Rocky
Processes & Methodologies
1 153 (36.96%) Infrastructure Engineering
2 112 (27.05%) DevOps
3 105 (25.36%) Actionable Insight
4 84 (20.29%) Agile
4 84 (20.29%) CI/CD
5 52 (12.56%) Mentoring
6 48 (11.59%) Collaborative Working
6 48 (11.59%) Containerisation
7 46 (11.11%) Infrastructure as Code
7 46 (11.11%) ITIL
8 41 (9.90%) Configuration Management
9 37 (8.94%) Storage Management
10 36 (8.70%) Software Engineering
11 32 (7.73%) Capacity Management
12 31 (7.49%) Open Source
12 31 (7.49%) Problem-Solving
13 28 (6.76%) Software Architecture
14 27 (6.52%) Migration
14 27 (6.52%) Performance Monitoring
14 27 (6.52%) Task Automation
Programming Languages
1 223 (53.86%) Python
2 222 (53.62%) Bash
3 178 (43.00%) PowerShell
4 130 (31.40%) Java
5 57 (13.77%) SQL
6 38 (9.18%) Perl
7 28 (6.76%) Ruby
8 22 (5.31%) Shell Script
9 18 (4.35%) JavaScript
10 15 (3.62%) Korn
11 12 (2.90%) PHP
12 11 (2.66%) C
13 7 (1.69%) C#
13 7 (1.69%) C++
13 7 (1.69%) MATLAB
14 6 (1.45%) ABAP
14 6 (1.45%) Go
15 2 (0.48%) TypeScript
15 2 (0.48%) VB.NET
16 1 (0.24%) VB
Qualifications
1 117 (28.26%) Security Cleared
2 54 (13.04%) DV Cleared
3 44 (10.63%) SC Cleared
4 32 (7.73%) Degree
5 16 (3.86%) RHCE
6 14 (3.38%) CompTIA Security+
7 13 (3.14%) Microsoft Certification
8 12 (2.90%) MCSE
9 10 (2.42%) AWS Certification
9 10 (2.42%) AWS Certified Solutions Architect
9 10 (2.42%) Azure Certification
9 10 (2.42%) GIAC
9 10 (2.42%) MCSA
10 8 (1.93%) ITIL Certification
11 6 (1.45%) RHCSA
12 4 (0.97%) CCNA
12 4 (0.97%) Cisco Certification
13 3 (0.72%) CCNP
13 3 (0.72%) CISSP
13 3 (0.72%) GSEC
Quality Assurance & Compliance
1 20 (4.83%) QA
2 3 (0.72%) DICOM
2 3 (0.72%) HL7
3 2 (0.48%) California Consumer Privacy Act
3 2 (0.48%) GDPR
3 2 (0.48%) Government Security Classifications
3 2 (0.48%) HIPAA
3 2 (0.48%) ISO 9001
3 2 (0.48%) ISO/IEC 27001
3 2 (0.48%) NCSC
3 2 (0.48%) PCI DSS
3 2 (0.48%) Sarbanes-Oxley
4 1 (0.24%) ISO/IEC 20000
System Software
1 124 (29.95%) VMware Infrastructure
2 116 (28.02%) Docker
3 81 (19.57%) Hyper-V
4 54 (13.04%) Active Directory
5 16 (3.86%) Virtual Machines
6 10 (2.42%) VMware ESXi
7 9 (2.17%) KVM
8 8 (1.93%) NFS
8 8 (1.93%) Samba
8 8 (1.93%) vSphere
9 7 (1.69%) Ceph
10 6 (1.45%) Citrix Hypervisor
11 5 (1.21%) HDFS
12 4 (0.97%) LXC
12 4 (0.97%) Slurm Workload Manager
13 2 (0.48%) Veritas Cluster Server
14 1 (0.24%) Gluster
14 1 (0.24%) GPFS
14 1 (0.24%) Oracle RAC
14 1 (0.24%) Xen
Systems Management
1 206 (49.76%) Ansible
2 138 (33.33%) Puppet
3 125 (30.19%) Kubernetes
4 68 (16.43%) Terraform
5 31 (7.49%) Red Hat Satellite
6 15 (3.62%) Nagios
7 14 (3.38%) NetBackup
8 13 (3.14%) ZABBIX
9 12 (2.90%) Progress Chef
9 12 (2.90%) Single Sign-On
10 11 (2.66%) SCCM
10 11 (2.66%) SCOM
11 10 (2.42%) Active Directory Federation Services
11 10 (2.42%) Tivoli
11 10 (2.42%) Tivoli Storage Manager
12 6 (1.45%) Cobbler
12 6 (1.45%) vCenter Server
13 5 (1.21%) Oozie
14 4 (0.97%) McAfee ePO
14 4 (0.97%) Salt
Vendors
1 160 (38.65%) VMware
2 103 (24.88%) Oracle
3 84 (20.29%) Microsoft
4 42 (10.14%) TOWER Software
5 28 (6.76%) Splunk
6 25 (6.04%) Veritas
7 24 (5.80%) NetApp
8 19 (4.59%) Cisco
8 19 (4.59%) CyberArk
9 17 (4.11%) IBM
9 17 (4.11%) SAP
10 14 (3.38%) MobileIron
10 14 (3.38%) Samsung
10 14 (3.38%) Sun
11 13 (3.14%) ION Trading
12 12 (2.90%) Bloomberg
12 12 (2.90%) CQG
12 12 (2.90%) Patsystems
12 12 (2.90%) Reuters
12 12 (2.90%) Trayport