Disaster Recovery Job Trends

Disaster Recovery
UK

The table below provides summary statistics and salary benchmarking for jobs requiring Disaster Recovery skills. It covers permanent job vacancies from the 6 months leading up to 25 November 2025, with comparisons to the same periods in the previous two years.

6 months to
25 Nov 2025
Same period 2024 Same period 2023
Rank 217 170 209
Rank change year-on-year -47 +39 +100
Permanent jobs citing Disaster Recovery 622 1,072 877
As % of all permanent jobs in the UK 1.17% 1.60% 1.70%
As % of the Processes & Methodologies category 1.37% 1.88% 1.82%
Number of salaries quoted 485 641 805
10th Percentile £31,250 £37,500 £32,856
25th Percentile £43,000 £45,500 £43,750
Median annual salary (50th Percentile) £60,000 £57,500 £59,526
Median % change year-on-year +4.35% -3.40% +10.23%
75th Percentile £80,000 £77,500 £70,000
90th Percentile £102,500 £92,500 £83,250
UK excluding London median annual salary £51,000 £50,500 £52,500
% change year-on-year +0.99% -3.81% +5.00%

All Process and Methodology Skills
UK

Disaster Recovery falls under the Processes and Methodologies category. For comparison with the information above, the following table provides summary statistics for all permanent job vacancies requiring process or methodology skills.

Permanent vacancies with a requirement for process or methodology skills 45,329 56,886 48,300
As % of all permanent jobs advertised in the UK 84.95% 84.65% 93.78%
Number of salaries quoted 27,632 29,709 37,183
10th Percentile £28,250 £34,000 £32,500
25th Percentile £36,250 £45,000 £43,750
Median annual salary (50th Percentile) £55,000 £60,000 £60,000
Median % change year-on-year -8.33% - -
75th Percentile £75,000 £79,500 £80,000
90th Percentile £95,000 £97,500 £98,750
UK excluding London median annual salary £47,500 £54,439 £52,500
% change year-on-year -12.75% +3.69% -

Disaster Recovery
Job Vacancy Trend

Historical trend showing the proportion of permanent IT job postings citing Disaster Recovery relative to all permanent IT jobs advertised.
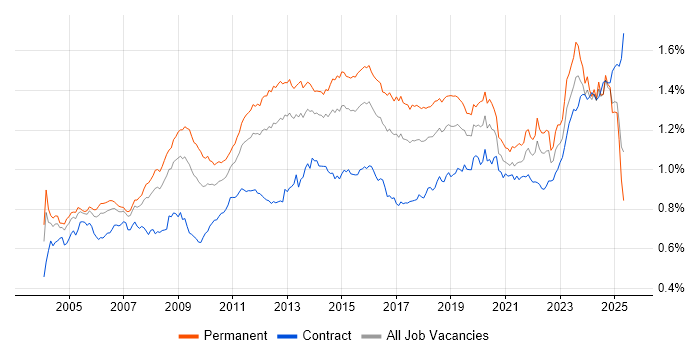
Disaster Recovery job vacancy trend in the UK

Disaster Recovery
Salary Trend

Salary distribution trend for jobs in the UK citing Disaster Recovery.

Salary distribution trend for jobs in the UK citing Disaster Recovery

Disaster Recovery
Salary Histogram

Salary distribution for jobs citing Disaster Recovery over the 6 months to 25 November 2025.

Salary histogram for Disaster Recovery in the UK

Disaster Recovery
Top 17 Job Locations

The table below looks at the demand and provides a guide to the median salaries quoted in IT jobs citing Disaster Recovery within the UK over the 6 months to 25 November 2025. The 'Rank Change' column provides an indication of the change in demand within each location based on the same 6 month period last year.

Location Rank Change
on Same Period
Last Year
Matching
Permanent
IT Job Ads
Median Salary
Past 6 Months
Median Salary
% Change
on Same Period
Last Year
Live
Jobs
England -50 560 £60,000 +3.90% 237
UK excluding London -60 325 £51,000 +0.99% 208
London +20 257 £72,500 -3.33% 75
Work from Home +4 183 £62,500 - 143
South East +17 99 £60,000 +14.29% 62
North of England -57 86 £47,500 - 45
Midlands -41 57 £58,500 +9.76% 45
North West -15 53 £45,000 -5.26% 21
South West +17 36 £47,500 -3.06% 21
West Midlands +7 33 £62,500 +17.26% 27
East Midlands -34 24 £52,500 +5.00% 18
Yorkshire -27 21 £32,500 -38.10% 23
East of England -26 16 £42,500 -15.84% 6
Northern Ireland - 16 - - 7
North East +5 12 £51,000 +7.37% 1
Wales +10 8 £42,750 -46.23% 10
Scotland -39 8 £48,000 -8.57% 16

Disaster Recovery
Co-Occurring Skills & Capabilities by Category

The following tables expand on the one above by listing co-occurrences grouped by category. They cover the same employment type, locality and period, with up to 20 co-occurrences shown in each category:

Application Platforms
1 90 (14.47%) Microsoft Exchange
2 82 (13.18%) SharePoint
3 15 (2.41%) IIS
4 7 (1.13%) Tomcat
5 6 (0.96%) WebSphere
5 6 (0.96%) WebSphere Application Server
6 5 (0.80%) Skype for Business
7 2 (0.32%) CICS
7 2 (0.32%) CMS
7 2 (0.32%) Confluence
7 2 (0.32%) nginx
8 1 (0.16%) Apache
8 1 (0.16%) Apache Spark
8 1 (0.16%) BizTalk Server
8 1 (0.16%) Site Server
8 1 (0.16%) WebLogic
Applications
1 29 (4.66%) Microsoft Office
2 8 (1.29%) Spreadsheet
3 4 (0.64%) Chatbot
3 4 (0.64%) Microsoft Excel
3 4 (0.64%) MS Visio
4 2 (0.32%) Acrobat
Business Applications
1 2 (0.32%) Dynamics AX
2 1 (0.16%) Dynamics CRM
2 1 (0.16%) Oracle EBS
2 1 (0.16%) Payment Gateway
2 1 (0.16%) Raiser’s Edge
2 1 (0.16%) Sage 200
2 1 (0.16%) SAP S/4HANA
Cloud Services
1 320 (51.45%) Azure
2 209 (33.60%) Microsoft 365
3 129 (20.74%) AWS
4 107 (17.20%) Entra ID
5 59 (9.49%) GCP
6 39 (6.27%) GitHub
7 37 (5.95%) Azure DevOps
8 33 (5.31%) AWS CloudFormation
9 30 (4.82%) Azure Monitor
9 30 (4.82%) SaaS
10 27 (4.34%) IaaS
10 27 (4.34%) PaaS
11 25 (4.02%) OneDrive
11 25 (4.02%) Power Platform
12 22 (3.54%) GitHub Actions
12 22 (3.54%) Nutanix
12 22 (3.54%) Serverless
13 17 (2.73%) Microsoft Purview
13 17 (2.73%) Power Automate
14 16 (2.57%) Amazon CloudWatch
Communications & Networking
1 167 (26.85%) Firewall
2 137 (22.03%) DNS
3 124 (19.94%) DHCP
4 112 (18.01%) VPN
5 81 (13.02%) WAN
6 63 (10.13%) TCP/IP
7 62 (9.97%) VLAN
8 60 (9.65%) LAN
9 39 (6.27%) Wireless
10 38 (6.11%) SD-WAN
11 36 (5.79%) SAN
12 35 (5.63%) Network Security
13 31 (4.98%) VoIP
13 31 (4.98%) Wi-Fi
14 22 (3.54%) Unified Communications
15 20 (3.22%) NAS
16 18 (2.89%) SSL
17 16 (2.57%) Remote Desktop
18 13 (2.09%) BGP
19 11 (1.77%) IPsec
Database & Business Intelligence
1 55 (8.84%) SQL Server
2 21 (3.38%) Power BI
3 18 (2.89%) PostgreSQL
4 17 (2.73%) Amazon RDS
4 17 (2.73%) Oracle Database
5 14 (2.25%) MySQL
6 13 (2.09%) MongoDB
6 13 (2.09%) NoSQL
7 12 (1.93%) Azure SQL Database
8 11 (1.77%) SQL Server Integration Services
9 10 (1.61%) DB2
10 9 (1.45%) BigQuery
11 8 (1.29%) Oracle Exadata
12 5 (0.80%) Oracle Database 12c
13 4 (0.64%) Oracle Database 10g
13 4 (0.64%) Oracle Database 11g
13 4 (0.64%) SQL Server Reporting Services
14 3 (0.48%) Data Warehouse
14 3 (0.48%) RDBMS
14 3 (0.48%) SQL Server Analysis Services
Development Applications
1 28 (4.50%) Git
2 22 (3.54%) Jenkins
3 8 (1.29%) GitLab
4 5 (0.80%) Bitbucket
4 5 (0.80%) JIRA
4 5 (0.80%) Selenium
5 4 (0.64%) Maven
5 4 (0.64%) Octopus Deploy
6 3 (0.48%) Atlassian Bamboo
6 3 (0.48%) LoadRunner
6 3 (0.48%) Subversion
7 2 (0.32%) Robot Framework
7 2 (0.32%) SQL Server Management Studio (SSMS)
7 2 (0.32%) TestRail
8 1 (0.16%) MSBuild
8 1 (0.16%) TeamCity
General
1 221 (35.53%) Social Skills
2 177 (28.46%) Finance
3 56 (9.00%) Analytical Skills
4 38 (6.11%) Law
5 32 (5.14%) Banking
6 27 (4.34%) Legal
7 26 (4.18%) Manufacturing
8 23 (3.70%) Telecoms
9 20 (3.22%) Public Sector
9 20 (3.22%) Retail
10 17 (2.73%) Financial Institution
10 17 (2.73%) Inclusion and Diversity
11 16 (2.57%) Organisational Skills
11 16 (2.57%) Presentation Skills
12 14 (2.25%) Documentation Skills
13 13 (2.09%) Back Office
13 13 (2.09%) Marketing
14 11 (1.77%) Pharmaceutical
15 10 (1.61%) Influencing Skills
16 7 (1.13%) Electronics
Job Titles
1 97 (15.59%) Infrastructure Engineer
2 71 (11.41%) Support Engineer
3 65 (10.45%) Senior
4 64 (10.29%) IT Support
5 55 (8.84%) IT Engineer
6 45 (7.23%) Analyst
6 45 (7.23%) Lead
7 42 (6.75%) Cloud Engineer
8 40 (6.43%) IT Manager
9 33 (5.31%) IT Support Engineer
10 31 (4.98%) Administrator
10 31 (4.98%) DBA
11 30 (4.82%) Architect
12 27 (4.34%) DevOps Engineer
13 26 (4.18%) Security Engineer
14 25 (4.02%) Infrastructure Support
15 24 (3.86%) Infrastructure Manager
15 24 (3.86%) Support Analyst
16 20 (3.22%) IT Infrastructure Engineer
17 19 (3.05%) Azure Engineer
Libraries, Frameworks & Software Standards
1 12 (1.93%) .NET
1 12 (1.93%) EDI
2 10 (1.61%) REST
3 9 (1.45%) LDAP
3 9 (1.45%) OAuth
4 8 (1.29%) Elastic Stack
4 8 (1.29%) SAML
5 7 (1.13%) RESTful
6 6 (0.96%) LAPP Stack
6 6 (0.96%) WebSphere MQ
7 5 (0.80%) ARM Templates
7 5 (0.80%) ASP.NET
7 5 (0.80%) JSON
7 5 (0.80%) React
7 5 (0.80%) XML
8 4 (0.64%) AWS SAM
8 4 (0.64%) LAMP
9 3 (0.48%) AngularJS
9 3 (0.48%) Kafka
9 3 (0.48%) Microsoft Graph
Miscellaneous
1 48 (7.72%) Management Information System
2 45 (7.23%) Enterprise Software
3 43 (6.91%) Hybrid Cloud
4 40 (6.43%) Data Centre
5 33 (5.31%) Onboarding
6 31 (4.98%) Cloud Native
7 25 (4.02%) Self-Motivation
8 24 (3.86%) Clustering
9 21 (3.38%) Replication
10 15 (2.41%) Public Cloud
11 13 (2.09%) PKI
12 12 (1.93%) CMDB
12 12 (1.93%) Security Posture
13 11 (1.77%) Driving Licence
14 8 (1.29%) Operational Technology
15 7 (1.13%) Analytical Mindset
15 7 (1.13%) CCTV
15 7 (1.13%) Data Protection Act
15 7 (1.13%) Legacy Systems
15 7 (1.13%) Linux Command Line
Operating Systems
1 225 (36.17%) Windows
2 160 (25.72%) Windows Server
3 102 (16.40%) Linux
4 22 (3.54%) Windows Server 2019
5 21 (3.38%) Unix
6 17 (2.73%) Mac OS
6 17 (2.73%) Red Hat Enterprise Linux
6 17 (2.73%) Windows 10
7 15 (2.41%) VMS
8 8 (1.29%) Windows Server 2016
9 4 (0.64%) Apple iOS
10 3 (0.48%) AIX
10 3 (0.48%) CentOS
10 3 (0.48%) Rocky
10 3 (0.48%) Ubuntu
11 2 (0.32%) Android
11 2 (0.32%) Oracle Linux
11 2 (0.32%) Solaris
11 2 (0.32%) Windows Server 2012
11 2 (0.32%) zOS
Processes & Methodologies
1 185 (29.74%) Business Continuity
2 149 (23.95%) Problem-Solving
3 133 (21.38%) Infrastructure Engineering
4 128 (20.58%) ITIL
5 127 (20.42%) Cybersecurity
6 124 (19.94%) DevOps
7 113 (18.17%) High Availability
8 98 (15.76%) Infrastructure as Code
9 93 (14.95%) CI/CD
10 76 (12.22%) Migration
11 75 (12.06%) Incident Response
12 74 (11.90%) Continuous Improvement
13 63 (10.13%) Customer Service
14 61 (9.81%) Performance Tuning
15 59 (9.49%) AI
15 59 (9.49%) ITSM
16 58 (9.32%) Service Delivery
17 57 (9.16%) Mentoring
18 55 (8.84%) Data Protection
19 54 (8.68%) Computer Science
Programming Languages
1 140 (22.51%) PowerShell
2 98 (15.76%) Python
3 69 (11.09%) SQL
4 34 (5.47%) Bash
5 23 (3.70%) Java
6 17 (2.73%) C#
7 16 (2.57%) T-SQL
8 13 (2.09%) Go
8 13 (2.09%) JavaScript
9 10 (1.61%) Bicep
10 8 (1.29%) Shell Script
11 6 (0.96%) VBScript
12 3 (0.48%) Kusto Query Language
13 2 (0.32%) COBOL
13 2 (0.32%) JCL
13 2 (0.32%) R
13 2 (0.32%) TypeScript
14 1 (0.16%) Perl
14 1 (0.16%) VB.NET
14 1 (0.16%) VBA
Qualifications
1 115 (18.49%) Degree
2 60 (9.65%) Azure Certification
3 52 (8.36%) Microsoft Certification
4 42 (6.75%) AWS Certification
5 39 (6.27%) Cisco Certification
6 34 (5.47%) Computer Science Degree
6 34 (5.47%) Security Cleared
7 30 (4.82%) AWS Certified Solutions Architect
8 25 (4.02%) CISSP
9 23 (3.70%) VMware Certified Professional (VCP)
10 22 (3.54%) CCNP
11 21 (3.38%) SC Cleared
12 16 (2.57%) Master's Degree
13 14 (2.25%) CCNA
14 13 (2.09%) MCSA
15 12 (1.93%) ITIL Certification
15 12 (1.93%) ITIL Foundation Certificate
16 11 (1.77%) CISM
17 10 (1.61%) HND
17 10 (1.61%) MCSE
Quality Assurance & Compliance
1 83 (13.34%) ISO/IEC 27001
2 74 (11.90%) GDPR
3 50 (8.04%) NIST
4 36 (5.79%) Cyber Essentials
5 34 (5.47%) SLA
6 22 (3.54%) Cyber Essentials PLUS
7 12 (1.93%) PCI DSS
8 11 (1.77%) SOC 2
9 8 (1.29%) HIPAA
9 8 (1.29%) ISAE 3402
9 8 (1.29%) ISO 22301
10 7 (1.13%) GRC
11 6 (0.96%) QA
12 5 (0.80%) NCSC
13 3 (0.48%) Basel III
13 3 (0.48%) COBIT
13 3 (0.48%) MiFID
14 2 (0.32%) ISO/IEC 20000
14 2 (0.32%) ISO/IEC 27005
14 2 (0.32%) Sarbanes-Oxley
System Software
1 168 (27.01%) Active Directory
2 110 (17.68%) VMware Infrastructure
3 76 (12.22%) Hyper-V
4 62 (9.97%) Docker
5 33 (5.31%) Virtual Machines
6 25 (4.02%) vSphere
7 24 (3.86%) VMware ESXi
8 17 (2.73%) Virtual Servers
9 13 (2.09%) Virtual Desktop
10 9 (1.45%) Oracle RAC
11 8 (1.29%) vCloud
12 6 (0.96%) NFS
13 5 (0.80%) EMC RecoverPoint
14 4 (0.64%) BitLocker
14 4 (0.64%) Squid
15 2 (0.32%) Microsoft Virtual Server
15 2 (0.32%) pfSense
15 2 (0.32%) RACF
15 2 (0.32%) XenDesktop
16 1 (0.16%) Postfix
Systems Management
1 110 (17.68%) Terraform
2 93 (14.95%) Microsoft Intune
3 79 (12.70%) Kubernetes
4 71 (11.41%) Ansible
5 22 (3.54%) Grafana
6 21 (3.38%) Prometheus
7 18 (2.89%) vCenter Server
8 13 (2.09%) Nagios
9 10 (1.61%) Data Guard
10 9 (1.45%) Oracle RMAN
11 8 (1.29%) Oracle Enterprise Manager
11 8 (1.29%) Puppet
12 7 (1.13%) Avamar
13 6 (0.96%) Autotask
13 6 (0.96%) Failover Clustering
13 6 (0.96%) FortiGate
13 6 (0.96%) SCCM
14 5 (0.80%) Active Directory Federation Services
14 5 (0.80%) Nessus
14 5 (0.80%) SCOM
Vendors
1 299 (48.07%) Microsoft
2 134 (21.54%) VMware
3 80 (12.86%) Cisco
4 34 (5.47%) Veeam
5 33 (5.31%) Google
6 29 (4.66%) Oracle
7 28 (4.50%) Dell
8 24 (3.86%) Palo Alto
9 22 (3.54%) Commvault
10 21 (3.38%) Fortinet
11 15 (2.41%) SolarWinds
11 15 (2.41%) Sophos
12 13 (2.09%) Datto
12 13 (2.09%) HP
12 13 (2.09%) Splunk
13 12 (1.93%) CrowdStrike
14 11 (1.77%) Adobe
14 11 (1.77%) IBM
14 11 (1.77%) Meraki
14 11 (1.77%) ServiceNow