Data Protection Jobs

Data Protection
UK

The table below provides summary statistics for permanent job vacancies requiring Data Protection skills. It includes a benchmarking guide to the annual salaries offered in vacancies that cited Data Protection over the 6 months leading up to 1 May 2025, comparing them to the same period in the previous two years.

6 months to
1 May 2025
Same period 2024 Same period 2023
Rank 198 218 259
Rank change year-on-year +20 +41 +1
Permanent jobs citing Data Protection 808 1,355 1,465
As % of all permanent jobs advertised in the UK 1.55% 1.38% 1.41%
As % of the Processes & Methodologies category 1.66% 1.60% 1.47%
Number of salaries quoted 533 1,007 825
10th Percentile £29,000 £31,210 £36,250
25th Percentile £42,500 £37,500 £45,000
Median annual salary (50th Percentile) £60,000 £50,000 £55,398
Median % change year-on-year +20.00% -9.74% +0.72%
75th Percentile £77,500 £67,500 £73,750
90th Percentile £102,500 £85,000 £92,500
UK excluding London median annual salary £52,500 £48,750 £52,500
% change year-on-year +7.69% -7.14% +5.00%

All Process and Methodology Skills
UK

Data Protection falls under the Processes and Methodologies category. For comparison with the information above, the following table provides summary statistics for all permanent job vacancies requiring process or methodology skills.

Permanent vacancies with a requirement for process or methodology skills 48,568 84,685 99,386
As % of all permanent jobs advertised in the UK 93.32% 85.99% 95.63%
Number of salaries quoted 26,511 59,837 58,366
10th Percentile £30,500 £29,000 £34,000
25th Percentile £42,500 £40,000 £45,000
Median annual salary (50th Percentile) £57,500 £55,000 £61,500
Median % change year-on-year +4.55% -10.57% +2.50%
75th Percentile £76,009 £72,500 £82,500
90th Percentile £98,750 £92,500 £100,000
UK excluding London median annual salary £52,500 £50,000 £55,000
% change year-on-year +5.00% -9.09% +4.76%

Data Protection
Job Vacancy Trend

Job postings citing Data Protection as a proportion of all IT jobs advertised.
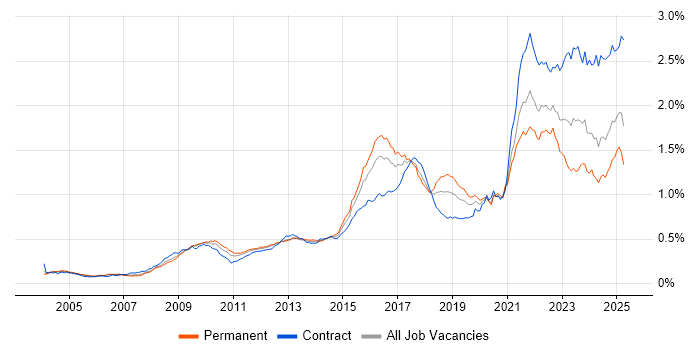
Job vacancy trend for Data Protection in the UK

Data Protection
Salary Trend

3-month moving average salary quoted in jobs citing Data Protection.

Salary trend for Data Protection in the UK

Data Protection
Salary Histogram

Salary distribution for jobs citing Data Protection over the 6 months to 1 May 2025.

Salary histogram for Data Protection in the UK

Data Protection
Top 18 Job Locations

The table below looks at the demand and provides a guide to the median salaries quoted in IT jobs citing Data Protection within the UK over the 6 months to 1 May 2025. The 'Rank Change' column provides an indication of the change in demand within each location based on the same 6 month period last year.

Location Rank Change
on Same Period
Last Year
Matching
Permanent
IT Job Ads
Median Salary
Past 6 Months
Median Salary
% Change
on Same Period
Last Year
Live
Jobs
England +8 720 £60,000 +20.00% 677
UK excluding London -9 406 £52,500 +7.69% 417
London +46 325 £77,000 +28.33% 345
Work from Home +66 257 £60,000 +10.09% 311
North of England -11 131 £55,000 +19.39% 88
South East +33 117 £45,000 -1.75% 140
North West -8 92 £50,000 +17.65% 49
Midlands -25 80 £50,000 - 55
West Midlands -12 65 £50,000 - 35
East of England +57 38 £51,250 -6.82% 55
Yorkshire +22 37 £58,500 +14.15% 34
South West +24 19 £62,500 +28.21% 40
Scotland +99 14 £53,250 +6.50% 31
East Midlands -4 14 £28,625 -42.75% 16
Wales +29 6 £87,500 +136.49% 6
North East +24 2 £51,250 +22.02% 5
Channel Islands +1 2 £78,750 -28.41%
Isle of Man - 1 £34,500 - 4

Data Protection
Co-occurring Skills and Capabilities by Category

The follow tables expand on the table above by listing co-occurrences grouped by category. The same employment type, locality and period is covered with up to 20 co-occurrences shown in each of the following categories:

Application Platforms
1 48 (5.94%) SharePoint
2 22 (2.72%) CMS
3 19 (2.35%) Microsoft Exchange
4 8 (0.99%) SAS
5 6 (0.74%) Confluence
6 4 (0.50%) Apache
6 4 (0.50%) Apache Spark
6 4 (0.50%) Drupal
6 4 (0.50%) Oracle Workflow
7 3 (0.37%) nginx
7 3 (0.37%) WordPress
8 2 (0.25%) GemFire
8 2 (0.25%) Umbraco
9 1 (0.12%) Adobe Experience Manager
9 1 (0.12%) Headless CMS
9 1 (0.12%) Jetty
9 1 (0.12%) OpenStack
9 1 (0.12%) SugarCRM
9 1 (0.12%) Tomcat
Applications
1 45 (5.57%) Microsoft Excel
2 44 (5.45%) Microsoft Office
3 9 (1.11%) Acrobat
3 9 (1.11%) Adobe Premiere
3 9 (1.11%) Photoshop
4 7 (0.87%) Microsoft PowerPoint
5 5 (0.62%) Adobe Illustrator
5 5 (0.62%) MS Visio
6 4 (0.50%) Microsoft Project
7 2 (0.25%) Spreadsheet
7 2 (0.25%) Trello
8 1 (0.12%) Chatbot
8 1 (0.12%) Sketch
Business Applications
1 25 (3.09%) Raiser’s Edge
2 20 (2.48%) Dynamics CRM
3 6 (0.74%) Oracle EBS
4 4 (0.50%) iTrent
4 4 (0.50%) NetSuite
4 4 (0.50%) Oracle Applications
4 4 (0.50%) SAP Business One
5 3 (0.37%) Adobe Campaign
5 3 (0.37%) SAP S/4HANA
6 1 (0.12%) Oracle Assets
6 1 (0.12%) Oracle EBS R12
6 1 (0.12%) Oracle General Ledger
6 1 (0.12%) Oracle Internet Expenses
6 1 (0.12%) Oracle Payables
6 1 (0.12%) Oracle Procure-to-Pay
6 1 (0.12%) Oracle Receivables
6 1 (0.12%) Payment Gateway
6 1 (0.12%) Salesforce CRM
6 1 (0.12%) SAP ERP
6 1 (0.12%) Sprinklr
Cloud Services
1 199 (24.63%) Azure
2 146 (18.07%) Microsoft 365
3 114 (14.11%) AWS
4 66 (8.17%) Power Platform
5 57 (7.05%) GCP
6 26 (3.22%) Entra ID
7 25 (3.09%) Serverless
8 22 (2.72%) SaaS
9 21 (2.60%) Rubrik
10 20 (2.48%) Azure DevOps
11 19 (2.35%) AWS Lambda
11 19 (2.35%) Dynamics 365
11 19 (2.35%) Microsoft Purview
12 16 (1.98%) AWS CloudFormation
12 16 (1.98%) Google Workspace
13 13 (1.61%) AWS KMS
13 13 (1.61%) Azure Data Factory
14 12 (1.49%) Cloud Computing
14 12 (1.49%) Google Analytics
15 11 (1.36%) PowerApps
Communications & Networking
1 79 (9.78%) Firewall
2 57 (7.05%) Network Security
3 28 (3.47%) DNS
4 26 (3.22%) Intrusion Detection
4 26 (3.22%) VPN
5 19 (2.35%) LAN
5 19 (2.35%) WAN
6 16 (1.98%) Internet
6 16 (1.98%) Intranet
6 16 (1.98%) TCP/IP
7 15 (1.86%) VLAN
8 13 (1.61%) Wi-Fi
9 11 (1.36%) DHCP
10 10 (1.24%) Remote Desktop
11 9 (1.11%) HTTP
11 9 (1.11%) SD-WAN
11 9 (1.11%) SMTP
12 8 (0.99%) VoIP
13 7 (0.87%) Ethernet
14 5 (0.62%) PBX
Database & Business Intelligence
1 53 (6.56%) Power BI
2 31 (3.84%) Data Warehouse
3 21 (2.60%) Metadata
3 21 (2.60%) SQL Server
4 20 (2.48%) Tableau
5 17 (2.10%) MySQL
6 15 (1.86%) NoSQL
7 12 (1.49%) PostgreSQL
8 11 (1.36%) Data Lake
9 10 (1.24%) MongoDB
9 10 (1.24%) Oracle Reports
9 10 (1.24%) SQL Server Reporting Services
10 9 (1.11%) IBM InfoSphere
11 8 (0.99%) Azure SQL Database
11 8 (0.99%) Metadata Repository
12 7 (0.87%) Relational Database
13 6 (0.74%) Amazon RDS
13 6 (0.74%) Big Data
14 5 (0.62%) SQL Server Integration Services
15 3 (0.37%) Hadoop
Development Applications
1 20 (2.48%) JIRA
2 8 (0.99%) Git
3 6 (0.74%) Jenkins
4 4 (0.50%) GitLab
4 4 (0.50%) JUnit
5 3 (0.37%) Gradle
5 3 (0.37%) Maven
5 3 (0.37%) Oracle Forms
5 3 (0.37%) Selenium
5 3 (0.37%) Sonatype Nexus
6 2 (0.25%) Cypress.io
6 2 (0.25%) Mockito
6 2 (0.25%) PHPUnit
7 1 (0.12%) Artifactory
7 1 (0.12%) Bitbucket
7 1 (0.12%) Jaeger
7 1 (0.12%) Postman
7 1 (0.12%) Rational Rhapsody
7 1 (0.12%) Spinnaker
7 1 (0.12%) TestNG
General
1 365 (45.17%) Social Skills
2 168 (20.79%) Finance
3 133 (16.46%) Analytical Skills
4 114 (14.11%) Legal
5 76 (9.41%) Law
6 69 (8.54%) Inclusion and Diversity
7 66 (8.17%) Marketing
8 48 (5.94%) Retail
9 34 (4.21%) Organisational Skills
10 26 (3.22%) Banking
11 24 (2.97%) Presentation Skills
12 18 (2.23%) Public Sector
12 18 (2.23%) Telecoms
13 17 (2.10%) Influencing Skills
14 15 (1.86%) Front Office
15 13 (1.61%) Documentation Skills
16 11 (1.36%) Publishing
17 9 (1.11%) Advertising
17 9 (1.11%) Manufacturing
17 9 (1.11%) Pharmaceutical
Job Titles
1 90 (11.14%) Lead
2 84 (10.40%) Senior
3 69 (8.54%) Analyst
4 66 (8.17%) Architect
5 43 (5.32%) Developer
6 38 (4.70%) Security Manager
7 33 (4.08%) IT Manager
8 32 (3.96%) Information Manager
9 31 (3.84%) Administrator
10 29 (3.59%) Infrastructure Engineer
11 27 (3.34%) Security Architect
11 27 (3.34%) Security Engineer
12 25 (3.09%) Consultant
12 25 (3.09%) IT Support
13 23 (2.85%) Data Manager
14 22 (2.72%) Senior Manager
15 21 (2.60%) Information Security Manager
16 20 (2.48%) Support Engineer
17 19 (2.35%) AWS Architect
17 19 (2.35%) Support Analyst
Libraries, Frameworks & Software Standards
1 32 (3.96%) React
2 26 (3.22%) Kafka
3 19 (2.35%) Elastic Stack
4 18 (2.23%) .NET
4 18 (2.23%) Node.js
5 17 (2.10%) CSS
6 16 (1.98%) HTML
7 12 (1.49%) Middleware
7 12 (1.49%) RESTful
8 10 (1.24%) RabbitMQ
9 9 (1.11%) Oracle Fusion
10 7 (0.87%) GraphQL
10 7 (0.87%) REST
10 7 (0.87%) Web Services
11 6 (0.74%) React Native
12 5 (0.62%) gRPC
12 5 (0.62%) Sequelize
13 4 (0.50%) Saxon XSLT
13 4 (0.50%) Spring
13 4 (0.50%) Spring Boot
Miscellaneous
1 217 (26.86%) Data Protection Act
2 151 (18.69%) Management Information System
3 61 (7.55%) Social Media
4 46 (5.69%) Security Posture
5 43 (5.32%) Self-Motivation
6 29 (3.59%) Data Centre
7 28 (3.47%) Product Ownership
8 27 (3.34%) Freedom of Information
9 26 (3.22%) Cyber Threat
10 21 (2.60%) Team-Oriented Environment
11 19 (2.35%) Freedom of Information Act
11 19 (2.35%) Onboarding
12 17 (2.10%) Cloud Native
12 17 (2.10%) e-Learning
13 13 (1.61%) Blog
13 13 (1.61%) Virtual Team
14 12 (1.49%) Analytical Mindset
15 10 (1.24%) Distributed Systems
15 10 (1.24%) Legacy Systems
16 9 (1.11%) CCTV
Operating Systems
1 111 (13.74%) Windows
2 39 (4.83%) Linux
3 38 (4.70%) Windows Server
4 34 (4.21%) Windows Vista
5 8 (0.99%) Unix
6 7 (0.87%) Windows 10
7 5 (0.62%) Windows Server 2016
7 5 (0.62%) Windows Server 2019
8 4 (0.50%) Windows Server 2012
9 3 (0.37%) Ubuntu
10 2 (0.25%) Android
10 2 (0.25%) Apple iOS
10 2 (0.25%) Debian
10 2 (0.25%) Mac OS
10 2 (0.25%) Red Hat Enterprise Linux
11 1 (0.12%) VMS
Processes & Methodologies
1 216 (26.73%) Problem-Solving
2 203 (25.12%) Cybersecurity
3 172 (21.29%) Information Security
4 143 (17.70%) Continuous Improvement
5 135 (16.71%) Risk Management
6 108 (13.37%) Project Management
7 103 (12.75%) Agile
8 100 (12.38%) Incident Response
9 86 (10.64%) Collaborative Working
10 80 (9.90%) Data Management
10 80 (9.90%) Stakeholder Management
11 79 (9.78%) Data Security
12 76 (9.41%) Cloud Security
12 76 (9.41%) Customer Service
13 75 (9.28%) DevOps
14 74 (9.16%) Computer Science
15 73 (9.03%) Disaster Recovery
16 72 (8.91%) CRM
17 70 (8.66%) CI/CD
18 69 (8.54%) Mentoring
Programming Languages
1 89 (11.01%) SQL
2 63 (7.80%) Python
3 44 (5.45%) Java
4 39 (4.83%) JavaScript
5 34 (4.21%) PowerShell
6 30 (3.71%) C#
7 14 (1.73%) R
8 13 (1.61%) TypeScript
9 7 (0.87%) PHP
10 6 (0.74%) C++
10 6 (0.74%) Go
11 5 (0.62%) Ruby
12 4 (0.50%) PL/SQL
13 3 (0.37%) Bash
13 3 (0.37%) Scala
14 2 (0.25%) Data Analysis Expressions
14 2 (0.25%) Shell Script
14 2 (0.25%) T-SQL
15 1 (0.12%) Kotlin
15 1 (0.12%) Swift
Qualifications
1 143 (17.70%) Degree
2 75 (9.28%) CISSP
3 69 (8.54%) DBS Check
4 59 (7.30%) CISM
5 55 (6.81%) Computer Science Degree
6 46 (5.69%) CISA
7 42 (5.20%) Security Cleared
8 38 (4.70%) Cisco Certification
9 34 (4.21%) SC Cleared
10 32 (3.96%) Microsoft Certification
11 29 (3.59%) (ISC)2 CCSP
12 28 (3.47%) Master's Degree
13 27 (3.34%) CEH
14 24 (2.97%) AWS Certification
15 20 (2.48%) AWS Certified Solutions Architect
16 19 (2.35%) Azure Certification
17 18 (2.23%) PMI Certification
17 18 (2.23%) PMP
18 13 (1.61%) CRISC
19 10 (1.24%) ISO 27001 Lead Implementer
Quality Assurance & Compliance
1 240 (29.70%) GDPR
2 127 (15.72%) ISO/IEC 27001
3 73 (9.03%) NIST
4 55 (6.81%) Cyber Essentials
5 52 (6.44%) Data Quality
6 44 (5.45%) SLA
7 39 (4.83%) PCI DSS
8 35 (4.33%) HIPAA
9 27 (3.34%) Accessibility
10 25 (3.09%) QA
11 19 (2.35%) Cyber Essentials PLUS
12 15 (1.86%) California Consumer Privacy Act
13 14 (1.73%) ISO/IEC 27002 (supersedes ISO/IEC 17799)
14 11 (1.36%) COBIT
14 11 (1.36%) PERC
15 10 (1.24%) GRC
16 8 (0.99%) Basel III
16 8 (0.99%) IFRS
16 8 (0.99%) IFRS 9
16 8 (0.99%) SOC 2
System Software
1 74 (9.16%) Active Directory
2 35 (4.33%) Docker
3 29 (3.59%) VMware Infrastructure
4 19 (2.35%) Hyper-V
5 16 (1.98%) Virtual Desktop
6 7 (0.87%) Virtual Machines
7 5 (0.62%) vSphere
8 3 (0.37%) Squid
8 3 (0.37%) Virtual Servers
8 3 (0.37%) VMware ESXi
9 2 (0.25%) EMC RecoverPoint
9 2 (0.25%) Firmware
9 2 (0.25%) VMware NSX
10 1 (0.12%) HDFS
10 1 (0.12%) pfSense
Systems Management
1 34 (4.21%) Kubernetes
2 28 (3.47%) Terraform
3 25 (3.09%) Microsoft Intune
4 20 (2.48%) Prometheus
5 19 (2.35%) Grafana
6 15 (1.86%) NetBackup
7 11 (1.36%) Avamar
8 9 (1.11%) Single Sign-On
9 6 (0.74%) Jamf Pro
9 6 (0.74%) SCCM
9 6 (0.74%) Tivoli Storage Manager
10 5 (0.62%) Ansible
10 5 (0.62%) EMC NetWorker
11 4 (0.50%) HP Fortify
12 3 (0.37%) CASB
12 3 (0.37%) HAProxy
12 3 (0.37%) Oracle RMAN
13 2 (0.25%) Nagios
13 2 (0.25%) Tivoli
13 2 (0.25%) vRealize
Vendors
1 218 (26.98%) Microsoft
2 57 (7.05%) Google
3 46 (5.69%) VMware
4 24 (2.97%) Oracle
5 19 (2.35%) Cisco
6 18 (2.23%) Citrix
7 17 (2.10%) Adobe
7 17 (2.10%) Veeam
8 16 (1.98%) IBM
8 16 (1.98%) Salesforce
9 14 (1.73%) Facebook
9 14 (1.73%) OneTrust
10 13 (1.61%) Informatica
11 12 (1.49%) Meraki
11 12 (1.49%) SolarWinds
12 11 (1.36%) SAP
12 11 (1.36%) ServiceNow
13 10 (1.24%) Commvault
14 8 (0.99%) Dell
14 8 (0.99%) Zerto