Roadmaps Jobs

Roadmaps
UK

The table below provides summary statistics for permanent job vacancies requiring Roadmaps skills. It includes a benchmarking guide to the annual salaries offered in vacancies that cited Roadmaps over the 6 months leading up to 25 April 2025, comparing them to the same period in the previous two years.

6 months to
25 Apr 2025
Same period 2024 Same period 2023
Rank 38 38 23
Rank change year-on-year 0 -15 +8
Permanent jobs citing Roadmaps 2,971 5,400 9,446
As % of all permanent jobs advertised in the UK 5.68% 5.51% 8.95%
As % of the Processes & Methodologies category 6.09% 6.40% 9.36%
Number of salaries quoted 1,871 3,512 5,129
10th Percentile £48,750 £42,500 £47,500
25th Percentile £60,000 £52,500 £55,000
Median annual salary (50th Percentile) £77,000 £70,000 £72,500
Median % change year-on-year +10.00% -3.45% +3.57%
75th Percentile £101,250 £87,500 £92,500
90th Percentile £126,250 £110,000 £115,000
UK excluding London median annual salary £69,040 £62,500 £65,000
% change year-on-year +10.46% -3.85% +6.12%

All Process and Methodology Skills
UK

Roadmaps falls under the Processes and Methodologies category. For comparison with the information above, the following table provides summary statistics for all permanent job vacancies requiring process or methodology skills.

Permanent vacancies with a requirement for process or methodology skills 48,773 84,346 100,923
As % of all permanent jobs advertised in the UK 93.27% 86.12% 95.65%
Number of salaries quoted 26,647 59,769 59,098
10th Percentile £31,000 £29,000 £34,000
25th Percentile £42,500 £40,000 £45,000
Median annual salary (50th Percentile) £57,500 £55,000 £61,900
Median % change year-on-year +4.55% -11.15% +3.17%
75th Percentile £76,250 £72,500 £82,500
90th Percentile £98,750 £92,500 £100,000
UK excluding London median annual salary £52,500 £50,000 £55,000
% change year-on-year +5.00% -9.09% +4.76%

Roadmaps
Job Vacancy Trend

Job postings citing Roadmaps as a proportion of all IT jobs advertised.
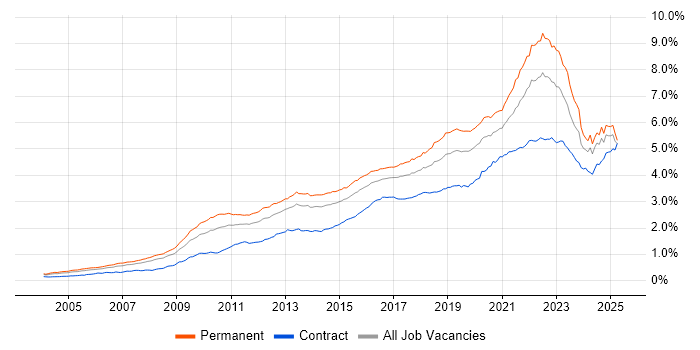
Job vacancy trend for Roadmaps in the UK

Roadmaps
Salary Trend

3-month moving average salary quoted in jobs citing Roadmaps.

Salary trend for Roadmaps in the UK

Roadmaps
Salary Histogram

Salary distribution for jobs citing Roadmaps over the 6 months to 25 April 2025.

Salary histogram for Roadmaps in the UK

Roadmaps
Top 19 Job Locations

The table below looks at the demand and provides a guide to the median salaries quoted in IT jobs citing Roadmaps within the UK over the 6 months to 25 April 2025. The 'Rank Change' column provides an indication of the change in demand within each location based on the same 6 month period last year.

Location Rank Change
on Same Period
Last Year
Matching
Permanent
IT Job Ads
Median Salary
Past 6 Months
Median Salary
% Change
on Same Period
Last Year
Live
Jobs
England -7 2,648 £77,500 +10.71% 5,043
UK excluding London -7 1,556 £69,040 +10.46% 2,122
London +5 1,240 £90,000 +5.88% 3,289
Work from Home -6 1,030 £77,500 +10.71% 2,239
North of England -28 498 £65,000 - 581
South East -8 368 £72,500 +16.00% 576
North West -23 343 £65,000 +8.33% 347
Midlands -16 257 £63,500 +1.60% 302
West Midlands -18 189 £62,500 -3.85% 182
Scotland +22 169 £75,000 +7.14% 155
South West -16 140 £67,500 +17.39% 224
Yorkshire -16 128 £73,152 -0.88% 193
East of England -11 105 £67,500 +8.00% 206
East Midlands -9 67 £64,750 +25.24% 112
North East -21 27 £63,889 +10.22% 41
Wales -4 17 £59,857 +14.01% 65
Channel Islands - 3 £80,000 -
Northern Ireland +11 1 - - 49
Isle of Man +7 1 £50,000 -39.39% 6

Roadmaps
Co-occurring Skills and Capabilities by Category

The follow tables expand on the table above by listing co-occurrences grouped by category. The same employment type, locality and period is covered with up to 20 co-occurrences shown in each of the following categories:

Application Platforms
1 82 (2.76%) SharePoint
2 43 (1.45%) Confluence
3 39 (1.31%) Microsoft Exchange
4 33 (1.11%) CMS
5 26 (0.88%) Apache Airflow
6 16 (0.54%) Apache Spark
7 12 (0.40%) Apache
8 11 (0.37%) IIS
9 9 (0.30%) Kentico
9 9 (0.30%) Tomcat
10 7 (0.24%) SAS
10 7 (0.24%) Umbraco
11 5 (0.17%) Sitecore CMS
12 4 (0.13%) IBM Domino
12 4 (0.13%) nginx
12 4 (0.13%) WordPress
13 3 (0.10%) Apache Solr
13 3 (0.10%) CICS
13 3 (0.10%) Drupal
13 3 (0.10%) OpenStack
Applications
1 52 (1.75%) Microsoft Excel
2 47 (1.58%) Microsoft Office
3 21 (0.71%) Microsoft PowerPoint
3 21 (0.71%) MS Visio
4 19 (0.64%) Maya
5 14 (0.47%) Microsoft Project
6 11 (0.37%) Chatbot
6 11 (0.37%) Trello
7 4 (0.13%) SPSS
8 2 (0.067%) Adobe Creative Suite
9 1 (0.034%) InDesign
9 1 (0.034%) Photoshop
9 1 (0.034%) Spreadsheet
Business Applications
1 66 (2.22%) Dynamics CRM
2 46 (1.55%) SAP S/4HANA
3 24 (0.81%) Ripple
3 24 (0.81%) Ripple XRP
4 22 (0.74%) NetSuite
5 10 (0.34%) Dynamics AX
5 10 (0.34%) SAP FI
6 9 (0.30%) Salesforce CRM
7 8 (0.27%) SAP CO
7 8 (0.27%) SAP FI/CO
7 8 (0.27%) SAP IBP
8 7 (0.24%) Oracle ERP
9 6 (0.20%) SAP SCM
10 5 (0.17%) Endur
10 5 (0.17%) SAP Oil and Gas
10 5 (0.17%) Sparx Enterprise Architect
11 4 (0.13%) SAP PM
11 4 (0.13%) Shopify
12 3 (0.10%) Dynamics GP
12 3 (0.10%) Dynamics NAV
Cloud Services
1 606 (20.40%) Azure
2 495 (16.66%) AWS
3 265 (8.92%) SaaS
4 170 (5.72%) Microsoft 365
5 164 (5.52%) GCP
6 153 (5.15%) Power Platform
7 71 (2.39%) Dynamics 365
8 70 (2.36%) Entra ID
9 55 (1.85%) Serverless
10 54 (1.82%) GitHub
11 47 (1.58%) Azure DevOps
12 46 (1.55%) PaaS
13 45 (1.51%) Cloud Computing
14 38 (1.28%) Azure Data Factory
15 37 (1.25%) Azure Synapse Analytics
16 34 (1.14%) Amazon S3
17 33 (1.11%) dbt
17 33 (1.11%) Microsoft Copilot
18 31 (1.04%) IaaS
19 29 (0.98%) PowerApps
Communications & Networking
1 85 (2.86%) Firewall
2 64 (2.15%) Network Security
3 40 (1.35%) VPN
4 37 (1.25%) WAN
5 29 (0.98%) Internet
5 29 (0.98%) LAN
6 28 (0.94%) Wireless
7 27 (0.91%) DNS
8 23 (0.77%) Wireshark
9 20 (0.67%) MPLS
9 20 (0.67%) SSL
10 19 (0.64%) Wi-Fi
11 18 (0.61%) DHCP
11 18 (0.61%) SD-WAN
12 17 (0.57%) TCP/IP
13 16 (0.54%) HTTP
14 15 (0.50%) Intrusion Detection
15 14 (0.47%) BGP
16 12 (0.40%) Cisco ISE
16 12 (0.40%) OSPF
Database & Business Intelligence
1 191 (6.43%) Data Lake
2 100 (3.37%) Power BI
3 87 (2.93%) PostgreSQL
4 72 (2.42%) Data Warehouse
5 66 (2.22%) SQL Server
6 62 (2.09%) Tableau
7 56 (1.88%) NoSQL
8 54 (1.82%) MongoDB
9 46 (1.55%) MySQL
10 32 (1.08%) Metadata
11 29 (0.98%) Relational Database
12 28 (0.94%) Data Mining
13 22 (0.74%) BigQuery
13 22 (0.74%) Dremio
14 21 (0.71%) Amazon Athena
15 20 (0.67%) Big Data
15 20 (0.67%) Elasticsearch
15 20 (0.67%) Looker
16 18 (0.61%) Apache Iceberg
16 18 (0.61%) RDBMS
Development Applications
1 149 (5.02%) JIRA
2 49 (1.65%) Git
3 25 (0.84%) Jenkins
4 15 (0.50%) GitLab
5 11 (0.37%) TeamCity
6 10 (0.34%) PowerBuilder
7 8 (0.27%) Maven
7 8 (0.27%) Oracle Forms
8 7 (0.24%) Bitbucket
8 7 (0.24%) Visual Studio
9 5 (0.17%) Postman
10 4 (0.13%) Balsamiq
10 4 (0.13%) Octopus Deploy
10 4 (0.13%) SoapUI
10 4 (0.13%) Storybook
11 3 (0.10%) ERwin
11 3 (0.10%) FitNesse
11 3 (0.10%) MSBuild
11 3 (0.10%) Selenium
11 3 (0.10%) Subversion
General
1 919 (30.93%) Social Skills
2 898 (30.23%) Finance
3 402 (13.53%) Analytical Skills
4 306 (10.30%) Law
5 238 (8.01%) Marketing
6 196 (6.60%) Retail
7 182 (6.13%) Banking
8 166 (5.59%) Front Office
9 154 (5.18%) Inclusion and Diversity
10 153 (5.15%) Influencing Skills
11 135 (4.54%) Legal
12 132 (4.44%) Presentation Skills
13 127 (4.27%) Manufacturing
14 96 (3.23%) Public Sector
15 67 (2.26%) Electronics
16 52 (1.75%) Games
17 48 (1.62%) Financial Institution
17 48 (1.62%) Telecoms
18 45 (1.51%) Organisational Skills
19 31 (1.04%) Advertising
Job Titles
1 557 (18.75%) Lead
2 527 (17.74%) Architect
3 367 (12.35%) Senior
4 315 (10.60%) Product Manager
5 250 (8.41%) Solutions Architect
6 185 (6.23%) Analyst
7 123 (4.14%) Product Owner
8 101 (3.40%) Business Manager
9 95 (3.20%) Senior Architect
10 94 (3.16%) Developer
11 89 (3.00%) Senior Manager
12 86 (2.89%) IT Manager
13 84 (2.83%) Enterprise Architect
14 79 (2.66%) Software Engineer
15 74 (2.49%) Consultant
16 73 (2.46%) Business Analyst
17 68 (2.29%) Principal Engineer
18 64 (2.15%) Data Architect
18 64 (2.15%) Data Engineer
19 61 (2.05%) Senior Solutions Architect
Libraries, Frameworks & Software Standards
1 178 (5.99%) React
2 118 (3.97%) .NET
3 75 (2.52%) REST
4 58 (1.95%) Node.js
5 54 (1.82%) HTML
6 52 (1.75%) CSS
6 52 (1.75%) Kafka
7 35 (1.18%) Middleware
8 32 (1.08%) AngularJS
9 31 (1.04%) Django
10 30 (1.01%) Next.js
10 30 (1.01%) NumPy
11 26 (0.88%) jQuery
11 26 (0.88%) RESTful
11 26 (0.88%) SOAP
12 25 (0.84%) PySpark
13 23 (0.77%) Ruby on Rails
14 22 (0.74%) ASP.NET
14 22 (0.74%) Pandas
15 20 (0.67%) Vue
Miscellaneous
1 431 (14.51%) Product Ownership
2 164 (5.52%) Equities
3 163 (5.49%) Fixed Income
4 148 (4.98%) Derivative
4 148 (4.98%) Foreign Exchange (FX)
5 146 (4.91%) Hedge funds
6 134 (4.51%) Management Information System
7 102 (3.43%) Cloud Native
8 87 (2.93%) Algorithms
9 83 (2.79%) Enterprise Software
10 74 (2.49%) Public Cloud
11 57 (1.92%) Distributed Systems
12 56 (1.88%) Self-Motivation
13 52 (1.75%) Data Centre
14 46 (1.55%) Onboarding
14 46 (1.55%) Private Cloud
15 44 (1.48%) Security Posture
16 43 (1.45%) Virtual Team
17 40 (1.35%) Analytical Mindset
17 40 (1.35%) Mobile App
Operating Systems
1 117 (3.94%) Windows
2 96 (3.23%) Linux
3 67 (2.26%) Apple iOS
4 37 (1.25%) Android
5 36 (1.21%) Windows Server
6 25 (0.84%) Unix
7 24 (0.81%) Red Hat Enterprise Linux
8 21 (0.71%) zOS
9 9 (0.30%) Solaris
10 6 (0.20%) Mac OS
10 6 (0.20%) Oracle Linux
10 6 (0.20%) Ubuntu
11 5 (0.17%) Windows Server 2019
12 4 (0.13%) CentOS
12 4 (0.13%) FreeRTOS
12 4 (0.13%) Windows 10
12 4 (0.13%) Windows Server 2012
12 4 (0.13%) Windows Server 2016
13 3 (0.10%) AIX
14 2 (0.067%) SUSE
Processes & Methodologies
1 1,155 (38.88%) Agile
2 539 (18.14%) Problem-Solving
3 501 (16.86%) Product Roadmap
4 478 (16.09%) Analytics
5 470 (15.82%) Stakeholder Management
6 461 (15.52%) Technology Roadmap
7 452 (15.21%) Strategic Roadmap
8 416 (14.00%) Continuous Improvement
9 384 (12.92%) Mentoring
10 376 (12.66%) DevOps
11 373 (12.55%) Software Engineering
12 358 (12.05%) Project Management
13 346 (11.65%) Artificial Intelligence
14 315 (10.60%) Decision-Making
15 300 (10.10%) Business Strategy
16 258 (8.68%) CI/CD
17 252 (8.48%) Product Management
18 237 (7.98%) Data Governance
19 232 (7.81%) IT Strategy
20 231 (7.78%) User Experience
Programming Languages
1 344 (11.58%) Python
2 189 (6.36%) SQL
3 170 (5.72%) JavaScript
4 168 (5.65%) Java
5 118 (3.97%) TypeScript
6 110 (3.70%) C#
7 70 (2.36%) PowerShell
8 53 (1.78%) C++
9 45 (1.51%) C
10 39 (1.31%) Ruby
11 35 (1.18%) PHP
12 27 (0.91%) Bash
13 20 (0.67%) Bicep
13 20 (0.67%) Kotlin
14 17 (0.57%) Go
15 16 (0.54%) Scala
16 15 (0.50%) R
17 13 (0.44%) Perl
18 10 (0.34%) Apex Code
19 9 (0.30%) PL/SQL
Qualifications
1 549 (18.48%) Degree
2 121 (4.07%) Security Cleared
3 118 (3.97%) Computer Science Degree
4 106 (3.57%) BPSS Clearance
5 88 (2.96%) Master's Degree
5 88 (2.96%) SC Cleared
6 81 (2.73%) CISSP
7 53 (1.78%) CISM
8 51 (1.72%) Azure Certification
9 48 (1.62%) AWS Certification
10 47 (1.58%) DBS Check
11 40 (1.35%) Microsoft Certification
12 31 (1.04%) PMI Certification
13 28 (0.94%) TOGAF Certification
14 26 (0.88%) Cisco Certification
14 26 (0.88%) DV Cleared
14 26 (0.88%) HND
14 26 (0.88%) PhD
15 23 (0.77%) Chartered Engineer
16 22 (0.74%) PMP
Quality Assurance & Compliance
1 100 (3.37%) GDPR
2 82 (2.76%) ISO/IEC 27001
3 78 (2.63%) QA
4 77 (2.59%) Data Quality
5 70 (2.36%) Accessibility
6 61 (2.05%) NIST
7 56 (1.88%) Cyber Essentials
8 55 (1.85%) MiFID
9 51 (1.72%) Sarbanes-Oxley
10 42 (1.41%) PCI DSS
11 34 (1.14%) PMO
12 28 (0.94%) California Consumer Privacy Act
13 21 (0.71%) Cyber Essentials PLUS
14 17 (0.57%) SOC 2
15 16 (0.54%) NCSC
16 15 (0.50%) SLA
17 14 (0.47%) HIPAA
18 12 (0.40%) COBIT
19 10 (0.34%) ISO 20022
19 10 (0.34%) NIST 800
System Software
1 124 (4.17%) Docker
2 65 (2.19%) Active Directory
3 40 (1.35%) Virtual Machines
4 36 (1.21%) Virtual Desktop
5 27 (0.91%) VMware Infrastructure
6 6 (0.20%) Hyper-V
7 3 (0.10%) RACF
7 3 (0.10%) vSphere
8 2 (0.067%) HDFS
8 2 (0.067%) KVM
8 2 (0.067%) Postfix
8 2 (0.067%) Sendmail
8 2 (0.067%) VirtualBox
9 1 (0.034%) Firmware
9 1 (0.034%) Virtual Servers
9 1 (0.034%) VMware NSX
Systems Management
1 139 (4.68%) Kubernetes
2 114 (3.84%) Terraform
3 37 (1.25%) Microsoft Intune
4 26 (0.88%) Ansible
5 17 (0.57%) Puppet
6 15 (0.50%) Grafana
7 11 (0.37%) FortiGate
7 11 (0.37%) Progress Chef
8 9 (0.30%) NetBackup
9 8 (0.27%) Jamf Pro
10 7 (0.24%) Prometheus
11 6 (0.20%) Single Sign-On
12 5 (0.17%) SCCM
13 4 (0.13%) Argo
13 4 (0.13%) CASB
13 4 (0.13%) Kustomize
13 4 (0.13%) Oozie
13 4 (0.13%) VxRail
14 3 (0.10%) Control-M
14 3 (0.10%) EMC VPLEX
Vendors
1 495 (16.66%) Microsoft
2 177 (5.96%) Google
3 168 (5.65%) SAP
4 124 (4.17%) Salesforce
5 85 (2.86%) ServiceNow
6 68 (2.29%) Oracle
7 66 (2.22%) Databricks
8 63 (2.12%) Cisco
9 50 (1.68%) IBM
10 40 (1.35%) VMware
11 36 (1.21%) Adobe
12 35 (1.18%) Apple
13 33 (1.11%) OpenAI
14 25 (0.84%) Informatica
15 24 (0.81%) Fortinet
16 21 (0.71%) Palo Alto
17 20 (0.67%) Dell
18 19 (0.64%) Meraki
18 19 (0.64%) NetApp
19 18 (0.61%) Red Hat