Onboarding Jobs

Onboarding
UK

The table below looks at the prevalence of the term Onboarding in permanent job vacancies. Included is a benchmarking guide to the salaries offered in vacancies that cited Onboarding over the 6 months leading up to 24 March 2025, comparing them to the same period in the previous two years.

6 months to
24 Mar 2025
Same period 2024 Same period 2023
Rank 210 168 213
Rank change year-on-year -42 +45 +41
Permanent jobs citing Onboarding 731 1,640 1,961
As % of all permanent jobs advertised in the UK 1.42% 1.82% 1.77%
As % of the Miscellaneous category 3.95% 5.08% 4.05%
Number of salaries quoted 538 917 1,102
10th Percentile £27,750 £27,750 £35,500
25th Percentile £36,250 £31,750 £46,250
Median annual salary (50th Percentile) £55,000 £50,000 £65,000
Median % change year-on-year +10.00% -23.08% +8.33%
75th Percentile £75,000 £70,000 £83,750
90th Percentile £102,500 £80,000 £96,250
UK excluding London median annual salary £47,500 £41,000 £55,000
% change year-on-year +15.85% -25.45% +10.00%

All Generic Skills
UK

Onboarding falls under the General and Transferable Skills category. For comparison with the information above, the following table provides summary statistics for all permanent job vacancies requiring generic IT skills.

Permanent vacancies with a requirement for generic IT skills 18,505 32,295 48,412
As % of all permanent jobs advertised in the UK 35.85% 35.77% 43.67%
Number of salaries quoted 9,386 22,081 25,118
10th Percentile £32,500 £28,500 £35,750
25th Percentile £45,000 £38,750 £46,250
Median annual salary (50th Percentile) £60,000 £55,000 £65,000
Median % change year-on-year +9.09% -15.38% +4.00%
75th Percentile £80,000 £75,000 £87,500
90th Percentile £110,625 £97,500 £107,500
UK excluding London median annual salary £55,000 £50,000 £55,000
% change year-on-year +10.00% -9.09% +4.76%

Onboarding
Job Vacancy Trend

Job postings citing Onboarding as a proportion of all IT jobs advertised.
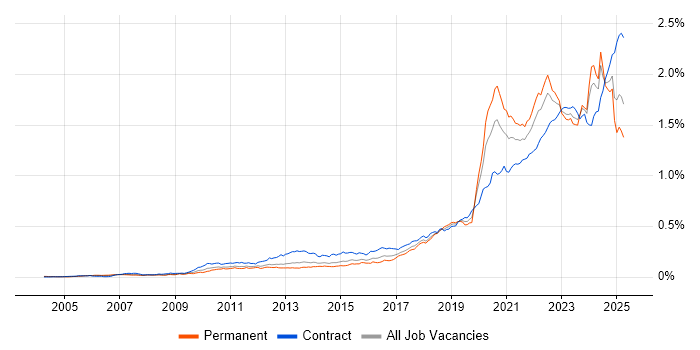
Job vacancy trend for Onboarding in the UK

Onboarding
Salary Trend

3-month moving average salary quoted in jobs citing Onboarding.

Salary trend for Onboarding in the UK

Onboarding
Salary Histogram

Salary distribution for jobs citing Onboarding over the 6 months to 24 March 2025.

Salary histogram for Onboarding in the UK

Onboarding
Top 17 Job Locations

The table below looks at the demand and provides a guide to the median salaries quoted in IT jobs citing Onboarding within the UK over the 6 months to 24 March 2025. The 'Rank Change' column provides an indication of the change in demand within each location based on the same 6 month period last year.

Location Rank Change
on Same Period
Last Year
Matching
Permanent
IT Job Ads
Median Salary
Past 6 Months
Median Salary
% Change
on Same Period
Last Year
Live
Jobs
England -40 623 £55,000 +15.79% 1,342
UK excluding London -55 406 £47,500 +15.85% 500
Work from Home +24 297 £60,000 +10.09% 623
London -46 249 £65,000 +8.33% 974
Midlands -4 123 £50,000 +43.20% 61
South East -16 102 £37,500 -13.79% 202
North of England -14 86 £40,000 -5.88% 104
West Midlands -15 78 £62,500 +56.25% 28
East Midlands +39 45 £37,500 +11.94% 30
North West -31 43 £43,750 +9.38% 69
South West +66 41 £62,500 +43.68% 55
Scotland -20 39 £37,500 -25.00% 33
Yorkshire +23 35 £37,500 -34.78% 22
East of England -8 20 £47,500 +4.40% 45
Wales +27 14 £65,000 +73.33% 8
North East +44 8 £70,000 +47.37% 16
Northern Ireland +31 2 - - 5

Onboarding
Co-occurring Skills and Capabilities by Category

The follow tables expand on the table above by listing co-occurrences grouped by category. The same employment type, locality and period is covered with up to 20 co-occurrences shown in each of the following categories:

Application Platforms
1 50 (6.84%) SharePoint
2 49 (6.70%) Microsoft Exchange
3 19 (2.60%) Confluence
4 9 (1.23%) WordPress
5 5 (0.68%) Apache
5 5 (0.68%) IIS
5 5 (0.68%) Jupyter
6 4 (0.55%) CMS
6 4 (0.55%) Mule
6 4 (0.55%) SAS
7 3 (0.41%) Apache Airflow
8 2 (0.27%) Liferay
8 2 (0.27%) Skype for Business
9 1 (0.14%) Camunda
9 1 (0.14%) Headless CMS
9 1 (0.14%) IBM HTTP Server
9 1 (0.14%) SharePoint Server
Applications
1 72 (9.85%) Microsoft Office
2 53 (7.25%) Microsoft Excel
3 17 (2.33%) Microsoft PowerPoint
4 8 (1.09%) Microsoft Project
5 7 (0.96%) Chatbot
6 3 (0.41%) MS Visio
6 3 (0.41%) SOLIDWORKS
6 3 (0.41%) Spreadsheet
7 2 (0.27%) Acrobat
7 2 (0.27%) Adobe XD
8 1 (0.14%) 1Password
8 1 (0.14%) Adobe Creative Suite
8 1 (0.14%) Adobe Illustrator
8 1 (0.14%) Photoshop
Business Applications
1 10 (1.37%) TrackWise
2 9 (1.23%) Oracle Payroll
3 8 (1.09%) Aladdin
3 8 (1.09%) SAP HR
3 8 (1.09%) thinkFolio
4 5 (0.68%) Markit EDM
4 5 (0.68%) Payment Gateway
5 4 (0.55%) Dynamics CRM
5 4 (0.55%) Shopify
6 3 (0.41%) Dynamics NAV
6 3 (0.41%) Magento
7 2 (0.27%) NetSuite
8 1 (0.14%) Academy Revenues and Benefits
8 1 (0.14%) Dynamics AX
8 1 (0.14%) Eikon
8 1 (0.14%) Fidessa
8 1 (0.14%) Lawson
8 1 (0.14%) RMDS
8 1 (0.14%) Sage 200
8 1 (0.14%) SAP Business One
Cloud Services
1 159 (21.75%) Azure
2 143 (19.56%) Microsoft 365
3 90 (12.31%) SaaS
4 69 (9.44%) AWS
5 42 (5.75%) Entra ID
6 28 (3.83%) Power Platform
7 27 (3.69%) GitHub
8 26 (3.56%) Azure DevOps
9 25 (3.42%) Mimecast
10 23 (3.15%) GitHub Actions
11 20 (2.74%) IaaS
11 20 (2.74%) OneDrive
12 18 (2.46%) PaaS
13 16 (2.19%) Microsoft Copilot
14 13 (1.78%) GCP
14 13 (1.78%) SuccessFactors
15 10 (1.37%) Veeva
16 9 (1.23%) Asana
17 8 (1.09%) Cloud Computing
17 8 (1.09%) Google Workspace
Communications & Networking
1 42 (5.75%) Firewall
2 41 (5.61%) LAN
3 37 (5.06%) DNS
3 37 (5.06%) WAN
4 27 (3.69%) VPN
5 25 (3.42%) DHCP
6 21 (2.87%) Internet
7 12 (1.64%) TCP/IP
8 11 (1.50%) Intranet
9 9 (1.23%) Network Security
9 9 (1.23%) Wi-Fi
10 8 (1.09%) VoIP
11 7 (0.96%) VLAN
12 6 (0.82%) IPsec
12 6 (0.82%) Telnet
13 5 (0.68%) Wireless
14 3 (0.41%) IP Telephony
14 3 (0.41%) Kerberos
14 3 (0.41%) SAN
14 3 (0.41%) SSL
Database & Business Intelligence
1 19 (2.60%) PostgreSQL
2 18 (2.46%) SQL Server
3 17 (2.33%) Redis
4 14 (1.92%) MongoDB
4 14 (1.92%) Relational Database
5 13 (1.78%) Power BI
6 11 (1.50%) Tableau
7 9 (1.23%) MySQL
8 7 (0.96%) Data Lake
9 5 (0.68%) Big Data
9 5 (0.68%) Dremio
10 4 (0.55%) GIS
10 4 (0.55%) Metadata
11 3 (0.41%) Amazon RDS
11 3 (0.41%) Data Warehouse
12 2 (0.27%) Amazon Redshift
13 1 (0.14%) BusinessObjects
13 1 (0.14%) Data Mining
13 1 (0.14%) Looker
13 1 (0.14%) MS Access
Development Applications
1 37 (5.06%) JIRA
2 23 (3.15%) SonarQube
3 21 (2.87%) Git
4 5 (0.68%) Jenkins
4 5 (0.68%) Selenium
5 4 (0.55%) Postman
6 3 (0.41%) GitLab
6 3 (0.41%) MLflow
7 2 (0.27%) Maven
7 2 (0.27%) Visual Studio
8 1 (0.14%) Android Studio
8 1 (0.14%) Bitbucket
8 1 (0.14%) Cypress.io
8 1 (0.14%) HP UFT
8 1 (0.14%) Hudson
8 1 (0.14%) IntelliJ
8 1 (0.14%) Sonatype Nexus
8 1 (0.14%) TestComplete
8 1 (0.14%) Xcode
8 1 (0.14%) Zephyr
General
1 362 (49.52%) Social Skills
2 182 (24.90%) Finance
3 86 (11.76%) Analytical Skills
4 55 (7.52%) Law
5 53 (7.25%) Banking
6 52 (7.11%) Legal
7 51 (6.98%) Public Sector
8 49 (6.70%) Marketing
9 47 (6.43%) Organisational Skills
10 41 (5.61%) Inclusion and Diversity
11 32 (4.38%) Retail
12 30 (4.10%) Front Office
13 24 (3.28%) Financial Institution
14 23 (3.15%) Local Government
15 20 (2.74%) Telecoms
16 19 (2.60%) Back Office
16 19 (2.60%) Manufacturing
17 17 (2.33%) Pharmaceutical
17 17 (2.33%) Presentation Skills
18 16 (2.19%) Documentation Skills
Job Titles
1 139 (19.02%) Analyst
2 88 (12.04%) Senior
3 58 (7.93%) Support Engineer
4 44 (6.02%) Lead
5 43 (5.88%) IT Support
6 39 (5.34%) Developer
7 38 (5.20%) Consultant
7 38 (5.20%) Senior Analyst
8 36 (4.92%) Business Manager
9 35 (4.79%) IT Manager
10 24 (3.28%) Development Manager
10 24 (3.28%) Project Manager
11 22 (3.01%) Administrator
12 21 (2.87%) Support Analyst
13 20 (2.74%) IT Engineer
14 19 (2.60%) Business Development Manager
14 19 (2.60%) Desktop Support
14 19 (2.60%) Service Analyst
15 18 (2.46%) Business Analyst
15 18 (2.46%) Service Desk Analyst
Libraries, Frameworks & Software Standards
1 27 (3.69%) .NET
2 19 (2.60%) OAuth
3 16 (2.19%) RESTful
4 15 (2.05%) FIX Protocol
5 14 (1.92%) GraphQL
6 13 (1.78%) ARM Templates
6 13 (1.78%) Azure Blueprints
6 13 (1.78%) Django
7 12 (1.64%) Laravel
7 12 (1.64%) WebSockets
8 11 (1.50%) Flask
8 11 (1.50%) HTML
9 10 (1.37%) FastAPI
9 10 (1.37%) Keycloak
9 10 (1.37%) pytest
9 10 (1.37%) SAML
9 10 (1.37%) SQLAlchemy
10 9 (1.23%) Node.js
10 9 (1.23%) React
11 8 (1.09%) SailPoint
Miscellaneous
1 65 (8.89%) Management Information System
2 40 (5.47%) Self-Motivation
3 33 (4.51%) Virtual Team
4 25 (3.42%) Data Centre
5 23 (3.15%) Derivative
6 21 (2.87%) Social Media
7 20 (2.74%) Enterprise Software
8 18 (2.46%) Driving Licence
8 18 (2.46%) Fixed Income
9 15 (2.05%) CSOC
9 15 (2.05%) Tandem
10 14 (1.92%) CMDB
10 14 (1.92%) Equities
10 14 (1.92%) Hedge funds
11 13 (1.78%) Mobile App
12 10 (1.37%) Reference Data
12 10 (1.37%) Robotics
13 9 (1.23%) FMCG
13 9 (1.23%) NHS
14 8 (1.09%) Client/Server
Operating Systems
1 133 (18.19%) Windows
2 40 (5.47%) Windows Server
3 34 (4.65%) Linux
4 33 (4.51%) Windows 10
5 19 (2.60%) Mac OS
6 17 (2.33%) Windows Server 2016
7 14 (1.92%) Windows Server 2019
8 12 (1.64%) Unix
9 10 (1.37%) Android
9 10 (1.37%) Apple iOS
10 6 (0.82%) Red Hat Enterprise Linux
10 6 (0.82%) Rocky
10 6 (0.82%) Ubuntu
11 4 (0.55%) CentOS
12 3 (0.41%) Mac OS X
12 3 (0.41%) Windows 7
13 1 (0.14%) Debian
13 1 (0.14%) SUSE
Processes & Methodologies
1 189 (25.85%) Problem-Solving
2 163 (22.30%) Client Onboarding
3 125 (17.10%) Project Management
4 109 (14.91%) Agile
5 88 (12.04%) Mentoring
6 81 (11.08%) Project Delivery
7 80 (10.94%) Customer Service
8 74 (10.12%) Cybersecurity
9 72 (9.85%) Continuous Improvement
10 70 (9.58%) Service Delivery
11 66 (9.03%) ITIL
11 66 (9.03%) Stakeholder Management
12 63 (8.62%) CRM
13 60 (8.21%) Business Development
14 58 (7.93%) DevOps
15 57 (7.80%) Artificial Intelligence
16 53 (7.25%) Change Management
16 53 (7.25%) Software Engineering
17 52 (7.11%) Asset Management
18 47 (6.43%) Roadmaps
Programming Languages
1 84 (11.49%) SQL
2 68 (9.30%) Python
3 52 (7.11%) PowerShell
4 32 (4.38%) JavaScript
5 28 (3.83%) C#
6 14 (1.92%) PHP
7 12 (1.64%) Bash
7 12 (1.64%) Java
8 8 (1.09%) TypeScript
8 8 (1.09%) VB.NET
9 3 (0.41%) R
9 3 (0.41%) VB
10 2 (0.27%) T-SQL
10 2 (0.27%) VBA
11 1 (0.14%) Go
11 1 (0.14%) IronPython
11 1 (0.14%) Kusto Query Language
11 1 (0.14%) Perl
11 1 (0.14%) VBScript
11 1 (0.14%) XAML
Qualifications
1 119 (16.28%) Degree
2 75 (10.26%) Security Cleared
3 36 (4.92%) BPSS Clearance
4 32 (4.38%) SC Cleared
5 19 (2.60%) Computer Science Degree
6 17 (2.33%) Master's Degree
7 14 (1.92%) Azure Certification
7 14 (1.92%) Microsoft Certification
8 11 (1.50%) DBS Check
9 8 (1.09%) ITIL Certification
10 7 (0.96%) CIPD
10 7 (0.96%) PMI Certification
10 7 (0.96%) PMP
11 6 (0.82%) CISSP
11 6 (0.82%) HND
12 5 (0.68%) Postgraduate
13 4 (0.55%) CISM
14 3 (0.41%) GSEC
15 2 (0.27%) GCFA
15 2 (0.27%) GCIH
Quality Assurance & Compliance
1 54 (7.39%) QA
2 28 (3.83%) ISO/IEC 27001
3 27 (3.69%) GDPR
4 16 (2.19%) SLA
5 15 (2.05%) NCSC
6 13 (1.78%) PCI DSS
7 12 (1.64%) ISO 9001
8 10 (1.37%) Cyber Essentials
8 10 (1.37%) GMP
9 9 (1.23%) Data Quality
10 8 (1.09%) PMO
11 7 (0.96%) ISO 14001
12 6 (0.82%) GLP
13 4 (0.55%) Accessibility
13 4 (0.55%) NIST
14 3 (0.41%) Cyber Essentials PLUS
14 3 (0.41%) GRC
15 2 (0.27%) HL7
15 2 (0.27%) Software Quality Assurance
16 1 (0.14%) GxP
System Software
1 105 (14.36%) Active Directory
2 43 (5.88%) VMware Infrastructure
3 34 (4.65%) Docker
4 21 (2.87%) Hyper-V
5 12 (1.64%) XenApp
6 10 (1.37%) Virtual Desktop
7 4 (0.55%) VMware ESXi
8 3 (0.41%) Virtual Machines
9 2 (0.27%) VirtualBox
10 1 (0.14%) BitLocker
10 1 (0.14%) Firmware
10 1 (0.14%) Microsoft App-V
Systems Management
1 49 (6.70%) Microsoft Intune
2 36 (4.92%) Kubernetes
3 26 (3.56%) Terraform
4 18 (2.46%) QRadar
5 16 (2.19%) SCCM
6 15 (2.05%) Ansible
7 14 (1.92%) Grafana
8 12 (1.64%) Single Sign-On
9 10 (1.37%) Prometheus
10 4 (0.55%) ZABBIX
11 3 (0.41%) Active Directory Federation Services
11 3 (0.41%) vCenter Server
12 2 (0.27%) Forefront Identity Manager
13 1 (0.14%) Backup Exec
13 1 (0.14%) CSIRT
13 1 (0.14%) Jamf Pro
13 1 (0.14%) NetBackup
13 1 (0.14%) Netcool
13 1 (0.14%) WMI
13 1 (0.14%) WSUS
Vendors
1 241 (32.97%) Microsoft
2 43 (5.88%) VMware
3 40 (5.47%) SAP
4 35 (4.79%) Cisco
5 34 (4.65%) Meraki
6 31 (4.24%) Oracle
7 28 (3.83%) Salesforce
8 21 (2.87%) Google
9 18 (2.46%) Citrix
10 16 (2.19%) SonicWALL
11 15 (2.05%) ServiceNow
12 14 (1.92%) Charles River
13 13 (1.78%) Dell
14 12 (1.64%) CheckPoint
14 12 (1.64%) YouTube
15 10 (1.37%) Veeam
16 9 (1.23%) Apple
16 9 (1.23%) Bloomberg
17 8 (1.09%) Calypso
17 8 (1.09%) SimCorp