Ubuntu Linux
UK

The table below provides summary statistics for permanent job vacancies requiring Ubuntu skills. It includes a benchmarking guide to the annual salaries offered in vacancies that cited Ubuntu over the 6 months leading up to 16 January 2025, comparing them to the same period in the previous two years.

6 months to
16 Jan 2025
Same period 2024 Same period 2023
Rank 562 507 666
Rank change year-on-year -55 +159 -9
Permanent jobs citing Ubuntu 206 240 367
As % of all permanent jobs advertised in the UK 0.32% 0.41% 0.34%
As % of the Operating Systems category 2.46% 2.62% 2.10%
Number of salaries quoted 122 147 289
10th Percentile £32,500 £36,250 £38,745
25th Percentile £37,500 £42,250 £45,000
Median annual salary (50th Percentile) £50,000 £57,500 £57,500
Median % change year-on-year -13.04% - +4.55%
75th Percentile £60,000 £67,500 £70,000
90th Percentile £67,500 £90,000 £87,750
UK excluding London median annual salary £45,000 £50,000 £52,500
% change year-on-year -10.00% -4.76% +10.53%

All Operating Systems
UK

Ubuntu falls under the Operating Systems category. For comparison with the information above, the following table provides summary statistics for all permanent job vacancies requiring operating system skills.

Permanent vacancies with a requirement for operating system skills 8,371 9,147 17,457
As % of all permanent jobs advertised in the UK 12.86% 15.52% 16.28%
Number of salaries quoted 4,622 7,097 12,389
10th Percentile £28,500 £27,000 £27,500
25th Percentile £36,250 £34,000 £36,250
Median annual salary (50th Percentile) £50,000 £50,000 £52,500
Median % change year-on-year - -4.76% +5.00%
75th Percentile £71,250 £67,500 £72,500
90th Percentile £87,500 £85,000 £93,130
UK excluding London median annual salary £46,500 £45,000 £45,000
% change year-on-year +3.33% - -

Ubuntu
Job Vacancy Trend

Job postings citing Ubuntu as a proportion of all IT jobs advertised.
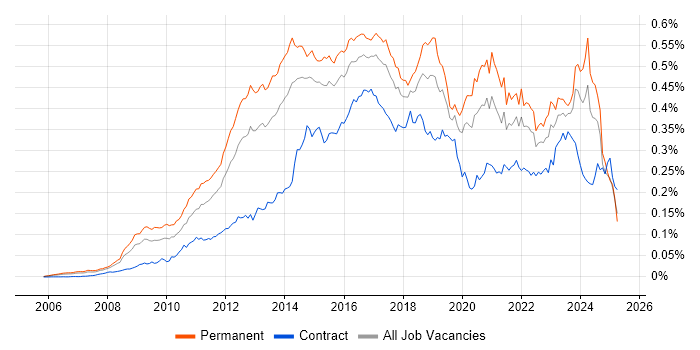
Job vacancy trend for Ubuntu in the UK

Ubuntu
Salary Trend

3-month moving average salary quoted in jobs citing Ubuntu.

Salary trend for Ubuntu in the UK

Ubuntu
Salary Histogram

Salary distribution for jobs citing Ubuntu over the 6 months to 16 January 2025.

Salary histogram for Ubuntu in the UK

Ubuntu
Top 15 Job Locations

The table below looks at the demand and provides a guide to the median salaries quoted in IT jobs citing Ubuntu within the UK over the 6 months to 16 January 2025. The 'Rank Change' column provides an indication of the change in demand within each location based on the same 6 month period last year.

Location Rank Change
on Same Period
Last Year
Matching
Permanent
IT Job Ads
Median Salary
Past 6 Months
Median Salary
% Change
on Same Period
Last Year
Live
Jobs
England -36 196 £50,000 -13.04% 32
UK excluding London -31 130 £45,000 -10.00% 23
Work from Home +21 97 £55,320 +25.85% 42
London -21 67 £61,000 -6.15% 9
South East 0 53 £49,479 -10.04% 7
Midlands +3 37 £35,000 -7.89% 1
West Midlands -8 31 £35,000 -7.89%
North of England -38 16 £40,000 -11.11% 9
East of England -34 13 £50,000 -16.67% 3
North West -40 9 £39,500 -1.60% 8
South West -5 8 £46,250 +8.82% 3
East Midlands -18 6 - - 1
Yorkshire +20 4 - -
Scotland +7 3 £37,500 -25.00%
North East -10 3 £50,000 -4.76% 1

Ubuntu
Co-occurring Skills and Capabilities by Category

The follow tables expand on the table above by listing co-occurrences grouped by category. The same employment type, locality and period is covered with up to 20 co-occurrences shown in each of the following categories:

Application Platforms
1 22 (10.68%) nginx
2 18 (8.74%) Microsoft Exchange
3 15 (7.28%) Apache
3 15 (7.28%) SharePoint
4 14 (6.80%) CloudStack
4 14 (6.80%) OpenStack
5 5 (2.43%) Apache Airflow
6 4 (1.94%) CMS
6 4 (1.94%) Headless CMS
6 4 (1.94%) IIS
7 3 (1.46%) Confluence
8 2 (0.97%) Tomcat
9 1 (0.49%) WordPress
Applications
1 27 (13.11%) Microsoft Excel
1 27 (13.11%) Microsoft Office
2 10 (4.85%) Simulink
3 2 (0.97%) 3ds Max
3 2 (0.97%) AutoCAD
4 1 (0.49%) Mozilla Thunderbird
Business Applications
1 6 (2.91%) Fidessa
2 1 (0.49%) Sparx Enterprise Architect
Cloud Services
1 102 (49.51%) AWS
2 81 (39.32%) Azure
3 27 (13.11%) Google Workspace
4 24 (11.65%) Microsoft 365
5 19 (9.22%) GCP
6 17 (8.25%) Entra ID
7 10 (4.85%) Amazon S3
8 9 (4.37%) GitHub
9 8 (3.88%) Amazon EC2
10 7 (3.40%) AWS Lambda
10 7 (3.40%) Serverless
11 6 (2.91%) OpenShift
12 4 (1.94%) Google Analytics
12 4 (1.94%) Google Tag Manager
13 3 (1.46%) Virtual Private Cloud
14 2 (0.97%) Adobe Creative Cloud
14 2 (0.97%) Amazon ECS
14 2 (0.97%) Azure AKS
14 2 (0.97%) Nutanix
14 2 (0.97%) Rubrik
Communications & Networking
1 79 (38.35%) Firewall
2 69 (33.50%) DNS
3 67 (32.52%) DHCP
4 46 (22.33%) TCP/IP
5 34 (16.50%) VLAN
6 31 (15.05%) BGP
7 26 (12.62%) OSPF
7 26 (12.62%) WLAN
8 22 (10.68%) Broadband
9 14 (6.80%) Unified Communications
10 8 (3.88%) SSL
11 6 (2.91%) Bluetooth
11 6 (2.91%) FIX Connectivity
11 6 (2.91%) SAN
11 6 (2.91%) Wireshark
12 5 (2.43%) NAS
12 5 (2.43%) VSAN
13 3 (1.46%) Telnet
13 3 (1.46%) VPN
13 3 (1.46%) Wi-Fi
Database & Business Intelligence
1 27 (13.11%) MySQL
2 22 (10.68%) SQL Server
3 17 (8.25%) NoSQL
4 14 (6.80%) PostgreSQL
5 11 (5.34%) MariaDB
6 6 (2.91%) Amazon RDS
7 5 (2.43%) Airbyte
7 5 (2.43%) Data Warehouse
7 5 (2.43%) Metadata
7 5 (2.43%) Qlik Sense
8 4 (1.94%) Apache Cassandra
9 3 (1.46%) MongoDB
10 2 (0.97%) Cloud Spanner
10 2 (0.97%) Couchbase
10 2 (0.97%) Elasticsearch
11 1 (0.49%) Big Data
11 1 (0.49%) Redis
11 1 (0.49%) Relational Database
11 1 (0.49%) SQLite
Development Applications
1 35 (16.99%) Git
2 15 (7.28%) Vagrant
3 12 (5.83%) Jenkins
4 9 (4.37%) GitLab
5 7 (3.40%) JIRA
6 6 (2.91%) Mercurial
7 4 (1.94%) Octopus Deploy
8 2 (0.97%) Subversion
9 1 (0.49%) Artifactory
9 1 (0.49%) Bitbucket Server
9 1 (0.49%) Maven
9 1 (0.49%) Sonatype Nexus
General
1 75 (36.41%) Social Skills
2 27 (13.11%) Automotive
3 26 (12.62%) Retail
4 22 (10.68%) Finance
5 21 (10.19%) Analytical Skills
6 16 (7.77%) Inclusion and Diversity
7 12 (5.83%) Banking
8 9 (4.37%) Telecoms
9 7 (3.40%) Games
10 6 (2.91%) Legal
11 5 (2.43%) Aerospace
12 3 (1.46%) Spanish Language
13 2 (0.97%) Manufacturing
13 2 (0.97%) Public Sector
14 1 (0.49%) Electronics
14 1 (0.49%) Marketing
14 1 (0.49%) Military
14 1 (0.49%) Organisational Skills
14 1 (0.49%) Tech for Good
Job Titles
1 58 (28.16%) IT Engineer
2 57 (27.67%) Systems Engineer
3 42 (20.39%) Infrastructure Engineer
4 36 (17.48%) Linux Engineer
5 31 (15.05%) Senior
6 23 (11.17%) IT Infrastructure Engineer
7 20 (9.71%) Linux Systems Engineer
8 17 (8.25%) Technical Specialist
9 16 (7.77%) Software Engineer
10 15 (7.28%) Linux Specialist
11 14 (6.80%) Administrator
11 14 (6.80%) Senior Data Warehouse Specialist
11 14 (6.80%) Senior Linux Specialist
11 14 (6.80%) Senior Technical Specialist
11 14 (6.80%) Senior Unix Technical Specialist
12 12 (5.83%) Developer
13 11 (5.34%) Systems Administrator
14 10 (4.85%) SC Cleared Software Engineer
15 9 (4.37%) Linux Infrastructure Engineer
15 9 (4.37%) Support Analyst
Libraries, Frameworks & Software Standards
1 11 (5.34%) Middleware
2 9 (4.37%) CSS
2 9 (4.37%) FIX Protocol
3 8 (3.88%) HTML
3 8 (3.88%) LAMP
4 6 (2.91%) Django
4 6 (2.91%) LAPP Stack
4 6 (2.91%) LEMP Stack
4 6 (2.91%) WebSockets
5 5 (2.43%) GraphQL
5 5 (2.43%) NumPy
5 5 (2.43%) Pandas
5 5 (2.43%) SQLAlchemy
6 4 (1.94%) REST
7 3 (1.46%) Laravel
7 3 (1.46%) LDAP
8 2 (0.97%) CodeIgniter
8 2 (0.97%) jQuery
8 2 (0.97%) Kafka
8 2 (0.97%) RabbitMQ
Miscellaneous
1 36 (17.48%) Management Information System
2 29 (14.08%) Data Centre
3 26 (12.62%) Smartphone
4 25 (12.14%) Security Posture
5 15 (7.28%) Video Conferencing
6 14 (6.80%) Social Media
7 9 (4.37%) FPGA
8 7 (3.40%) Enterprise Storage
8 7 (3.40%) Public Cloud
9 6 (2.91%) Algorithms
9 6 (2.91%) Client/Server
9 6 (2.91%) Clustering
9 6 (2.91%) Cyber Security Posture
9 6 (2.91%) Embedded Systems
9 6 (2.91%) Eurex
9 6 (2.91%) IoT
9 6 (2.91%) Mobile App
10 5 (2.43%) Cyber Threat
10 5 (2.43%) NHS
11 3 (1.46%) Equities
Operating Systems
1 206 (100.00%) Linux
2 122 (59.22%) Windows
3 80 (38.83%) CentOS
4 55 (26.70%) Windows Server
5 40 (19.42%) Debian
6 33 (16.02%) Windows Server 2016
6 33 (16.02%) Windows Server 2019
7 32 (15.53%) Windows 10
8 31 (15.05%) Red Hat Enterprise Linux
9 26 (12.62%) Mac OS X
10 17 (8.25%) Android
11 13 (6.31%) Mac OS
12 11 (5.34%) Unix
13 10 (4.85%) Solaris
13 10 (4.85%) SUSE
14 4 (1.94%) AIX
15 3 (1.46%) Rocky
16 2 (0.97%) Apple iOS
16 2 (0.97%) Fedora
17 1 (0.49%) openSUSE
Processes & Methodologies
1 53 (25.73%) Infrastructure Engineering
2 44 (21.36%) Computer Science
3 32 (15.53%) Performance Tuning
4 27 (13.11%) Systems Engineering
5 26 (12.62%) Business Case
6 25 (12.14%) Cybersecurity
7 23 (11.17%) Agile
7 23 (11.17%) Collaborative Working
7 23 (11.17%) DevOps
7 23 (11.17%) Problem-Solving
8 21 (10.19%) ITIL
8 21 (10.19%) Open Source
9 18 (8.74%) Software Engineering
10 17 (8.25%) Artificial Intelligence
11 16 (7.77%) Analytics
11 16 (7.77%) Infrastructure as Code
11 16 (7.77%) Roadmaps
12 15 (7.28%) Disaster Recovery
12 15 (7.28%) Machine Learning
12 15 (7.28%) Microservices
Programming Languages
1 65 (31.55%) SQL
2 57 (27.67%) PowerShell
2 57 (27.67%) Python
3 50 (24.27%) Bash
4 24 (11.65%) JavaScript
5 17 (8.25%) C++
6 16 (7.77%) Java
6 16 (7.77%) PHP
7 12 (5.83%) Perl
8 11 (5.34%) Kotlin
9 8 (3.88%) Ruby
10 7 (3.40%) T-SQL
10 7 (3.40%) TypeScript
11 6 (2.91%) C
11 6 (2.91%) Ladder Logic
11 6 (2.91%) Shell Script
12 4 (1.94%) C#
12 4 (1.94%) Go
13 2 (0.97%) PL/SQL
14 1 (0.49%) VBA
Qualifications
1 54 (26.21%) Degree
2 43 (20.87%) Computer Science Degree
3 32 (15.53%) MCSE
3 32 (15.53%) Microsoft Certification
4 27 (13.11%) HNC
4 27 (13.11%) HND
5 24 (11.65%) Security Cleared
6 19 (9.22%) SC Cleared
7 8 (3.88%) Cisco Certification
7 8 (3.88%) LPIC
7 8 (3.88%) RHCE
8 7 (3.40%) CCNA
8 7 (3.40%) CCNP
8 7 (3.40%) ITIL Certification
8 7 (3.40%) Network+ Certification
9 6 (2.91%) MCSA
9 6 (2.91%) VMware Certified Professional (VCP)
10 5 (2.43%) DV Cleared
11 4 (1.94%) BPSS Clearance
12 2 (0.97%) Azure Certification
Quality Assurance & Compliance
1 14 (6.80%) ISO/IEC 27001
2 13 (6.31%) Cyber Essentials
3 11 (5.34%) Cyber Essentials PLUS
4 5 (2.43%) NIST
4 5 (2.43%) NIST 800
System Software
1 81 (39.32%) Active Directory
2 24 (11.65%) Docker
3 23 (11.17%) pfSense
3 23 (11.17%) VMware Infrastructure
4 8 (3.88%) vSphere
5 5 (2.43%) Microsoft Virtual Server
5 5 (2.43%) Virtual Machines
5 5 (2.43%) Virtual Servers
5 5 (2.43%) VMware NSX
6 3 (1.46%) Samba
7 2 (0.97%) NFS
8 1 (0.49%) Hyper-V
8 1 (0.49%) Virtual Desktop
8 1 (0.49%) VMware ESXi
Systems Management
1 51 (24.76%) Ansible
2 40 (19.42%) Terraform
3 35 (16.99%) Kubernetes
4 17 (8.25%) Grafana
5 15 (7.28%) Jamf Pro
5 15 (7.28%) Microsoft Intune
6 14 (6.80%) Puppet
7 12 (5.83%) vCenter Server
8 9 (4.37%) Progress Chef
8 9 (4.37%) Prometheus
8 9 (4.37%) ZABBIX
9 8 (3.88%) Nagios
10 7 (3.40%) WSUS
11 5 (2.43%) Proxmox
12 4 (1.94%) Nessus
13 2 (0.97%) SCCM
14 1 (0.49%) Docker Swarm
14 1 (0.49%) Failover Clustering
14 1 (0.49%) Fluentd
14 1 (0.49%) Podman
Vendors
1 75 (36.41%) Microsoft
2 70 (33.98%) Red Hat
3 40 (19.42%) Google
4 33 (16.02%) Cisco
5 32 (15.53%) VMware
6 26 (12.62%) Apple
6 26 (12.62%) Dell
6 26 (12.62%) Fortinet
6 26 (12.62%) Ubiquiti
7 14 (6.80%) CyberArk
7 14 (6.80%) Tanium
8 13 (6.31%) Oracle
9 10 (4.85%) Xilinx
10 8 (3.88%) Palo Alto
11 7 (3.40%) Commvault
12 6 (2.91%) ION Trading
12 6 (2.91%) Patsystems
12 6 (2.91%) Reuters
12 6 (2.91%) Siemens
12 6 (2.91%) Trayport