Continuous Improvement Jobs

Continual Improvement
UK

The table below provides summary statistics for permanent job vacancies requiring Continuous Improvement skills. It includes a benchmarking guide to the annual salaries offered in vacancies that cited Continuous Improvement over the 6 months leading up to 15 March 2025, comparing them to the same period in the previous two years.

6 months to
15 Mar 2025
Same period 2024 Same period 2023
Rank 21 38 53
Rank change year-on-year +17 +15 +5
Permanent jobs citing Continuous Improvement 4,353 4,844 6,197
As % of all permanent jobs advertised in the UK 8.01% 5.54% 5.58%
As % of the Processes & Methodologies category 8.52% 6.31% 5.83%
Number of salaries quoted 2,157 2,990 3,161
10th Percentile £35,650 £32,500 £32,500
25th Percentile £42,500 £42,000 £43,750
Median annual salary (50th Percentile) £57,560 £57,500 £60,000
Median % change year-on-year +0.10% -4.17% -
75th Percentile £77,500 £74,110 £77,715
90th Percentile £95,000 £92,500 £96,250
UK excluding London median annual salary £52,500 £52,500 £54,882
% change year-on-year - -4.34% +4.54%

All Process and Methodology Skills
UK

Continuous Improvement falls under the Processes and Methodologies category. For comparison with the information above, the following table provides summary statistics for all permanent job vacancies requiring process or methodology skills.

Permanent vacancies with a requirement for process or methodology skills 51,094 76,717 106,265
As % of all permanent jobs advertised in the UK 94.00% 87.74% 95.67%
Number of salaries quoted 25,702 56,130 62,837
10th Percentile £32,500 £29,000 £34,481
25th Percentile £45,000 £40,000 £45,300
Median annual salary (50th Percentile) £58,984 £55,000 £62,500
Median % change year-on-year +7.24% -12.00% +4.17%
75th Percentile £77,500 £73,750 £82,500
90th Percentile £100,000 £93,750 £100,000
UK excluding London median annual salary £54,000 £50,000 £55,000
% change year-on-year +8.00% -9.09% +4.76%

Continuous Improvement
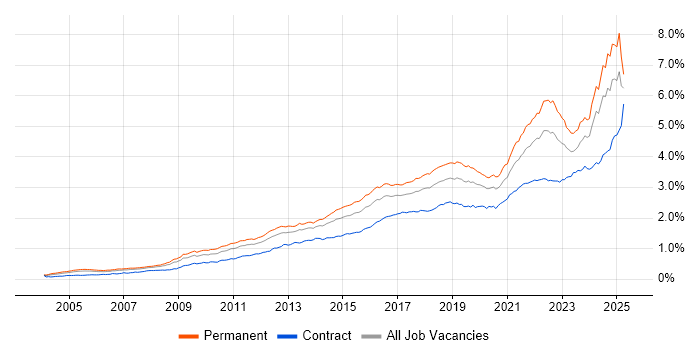
Job Vacancy Trend

Job postings citing Continuous Improvement as a proportion of all IT jobs advertised.

Job vacancy trend for Continuous Improvement in the UK

Continuous Improvement
Salary Trend

3-month moving average salary quoted in jobs citing Continuous Improvement.

Salary trend for Continuous Improvement in the UK

Continuous Improvement
Salary Histogram

Salary distribution for jobs citing Continuous Improvement over the 6 months to 15 March 2025.

Salary histogram for Continuous Improvement in the UK

Continuous Improvement
Top 18 Job Locations

The table below looks at the demand and provides a guide to the median salaries quoted in IT jobs citing Continuous Improvement within the UK over the 6 months to 15 March 2025. The 'Rank Change' column provides an indication of the change in demand within each location based on the same 6 month period last year.

Location Rank Change
on Same Period
Last Year
Matching
Permanent
IT Job Ads
Median Salary
Past 6 Months
Median Salary
% Change
on Same Period
Last Year
Live
Jobs
England +21 3,948 £57,560 +0.10% 4,113
UK excluding London +16 3,055 £52,500 - 2,345
Work from Home +38 1,299 £61,644 +2.74% 1,839
London +31 1,121 £75,000 +3.45% 2,133
North of England +21 1,067 £56,000 +9.80% 598
South East +28 661 £60,000 +15.94% 600
North West +7 537 £56,000 +12.00% 359
Yorkshire +27 465 £47,500 -20.24% 181
Midlands -2 458 £50,000 - 367
East of England +36 321 £50,967 -7.33% 262
West Midlands -11 283 £52,500 -1.87% 222
South West +20 271 £50,000 -4.57% 260
Scotland -27 213 £50,445 -10.43% 185
East Midlands +19 173 £40,101 -10.89% 136
North East +19 65 £59,967 +38.81% 68
Wales -10 53 £44,344 -11.31% 84
Northern Ireland +22 17 £72,215 +3.16% 48
Channel Islands +3 1 - - 1

Continuous Improvement
Co-occurring Skills and Capabilities by Category

The follow tables expand on the table above by listing co-occurrences grouped by category. The same employment type, locality and period is covered with up to 20 co-occurrences shown in each of the following categories:

Application Platforms
1 103 (2.37%) SharePoint
2 52 (1.19%) Confluence
3 47 (1.08%) Microsoft Exchange
4 42 (0.96%) CMS
5 23 (0.53%) OpenEdge
5 23 (0.53%) WordPress
6 21 (0.48%) nginx
7 13 (0.30%) SAS
8 12 (0.28%) Apache Solr
9 11 (0.25%) Apache
9 11 (0.25%) Drupal
10 10 (0.23%) Adobe Experience Manager
11 5 (0.11%) Apache Airflow
11 5 (0.11%) Apache Spark
11 5 (0.11%) IIS
12 4 (0.092%) Jupyter
13 3 (0.069%) Kinematics
13 3 (0.069%) OpenStack
14 2 (0.046%) Oracle SOA Suite
14 2 (0.046%) Oracle Workflow
Applications
1 291 (6.69%) Microsoft Excel
2 259 (5.95%) Microsoft Office
3 148 (3.40%) Simulink
4 82 (1.88%) Microsoft Project
5 58 (1.33%) Chatbot
6 40 (0.92%) Microsoft PowerPoint
7 36 (0.83%) Trello
8 30 (0.69%) MS Visio
9 9 (0.21%) Acrobat
9 9 (0.21%) AutoCAD
9 9 (0.21%) SOLIDWORKS
10 7 (0.16%) Spreadsheet
11 4 (0.092%) Maple
12 3 (0.069%) Photoshop
12 3 (0.069%) Productboard
13 2 (0.046%) Adobe Premiere
13 2 (0.046%) GNU Octave
13 2 (0.046%) Sketch
14 1 (0.023%) Adobe XD
14 1 (0.023%) PTC Creo
Business Applications
1 145 (3.33%) Teamcenter
2 29 (0.67%) Dynamics CRM
3 28 (0.64%) SAP S/4HANA
4 17 (0.39%) Oracle ERP
5 11 (0.25%) Oracle EBS
6 9 (0.21%) NetSuite
7 6 (0.14%) NEC Housing
7 6 (0.14%) Salesforce CRM
8 5 (0.11%) Elite 3E
8 5 (0.11%) Payment Gateway
8 5 (0.11%) SAP ERP
9 4 (0.092%) Adobe Campaign
9 4 (0.092%) Dynamics NAV
9 4 (0.092%) SAP MDG
9 4 (0.092%) SAP SD
10 3 (0.069%) Maximo
10 3 (0.069%) Sparx Enterprise Architect
11 2 (0.046%) Lawson
11 2 (0.046%) SAP FI
11 2 (0.046%) SAP GRC
Cloud Services
1 637 (14.63%) Azure
2 463 (10.64%) AWS
3 240 (5.51%) Microsoft 365
4 167 (3.84%) Power Platform
5 152 (3.49%) SaaS
6 118 (2.71%) GCP
7 103 (2.37%) Azure DevOps
8 87 (2.00%) Serverless
9 61 (1.40%) GitHub
10 58 (1.33%) Cloud Computing
11 53 (1.22%) Entra ID
12 48 (1.10%) Amazon S3
13 45 (1.03%) AWS Lambda
13 45 (1.03%) Dynamics 365
14 44 (1.01%) PowerApps
15 37 (0.85%) PaaS
16 35 (0.80%) Google Workspace
17 33 (0.76%) IaaS
18 32 (0.74%) Amazon SQS
19 30 (0.69%) Azure Synapse Analytics
Communications & Networking
1 261 (6.00%) Wireless
2 254 (5.84%) Wi-Fi
3 237 (5.44%) LTE
4 232 (5.33%) 5G
4 232 (5.33%) Bluetooth
5 230 (5.28%) GSM
6 227 (5.21%) UMTS
7 166 (3.81%) Firewall
8 149 (3.42%) Broadband
9 70 (1.61%) DNS
10 63 (1.45%) WAN
11 62 (1.42%) Network Security
11 62 (1.42%) VPN
12 53 (1.22%) LAN
13 47 (1.08%) TCP/IP
14 37 (0.85%) Intrusion Detection
14 37 (0.85%) VLAN
15 36 (0.83%) DHCP
16 29 (0.67%) Internet
16 29 (0.67%) SD-WAN
Database & Business Intelligence
1 134 (3.08%) Power BI
2 120 (2.76%) SQL Server
3 79 (1.81%) MySQL
4 58 (1.33%) NoSQL
5 55 (1.26%) Data Warehouse
6 51 (1.17%) Tableau
7 40 (0.92%) Relational Database
8 38 (0.87%) Data Lake
9 35 (0.80%) DynamoDB
10 34 (0.78%) Amazon Aurora
11 31 (0.71%) PostgreSQL
12 28 (0.64%) Amazon RDS
13 26 (0.60%) MongoDB
14 24 (0.55%) Azure SQL Database
15 21 (0.48%) Big Data
16 18 (0.41%) Power Query
17 15 (0.34%) Elasticsearch
18 14 (0.32%) Metadata
19 13 (0.30%) Amazon QuickSight
19 13 (0.30%) BigQuery
Development Applications
1 181 (4.16%) JIRA
2 145 (3.33%) Rational DOORS
3 91 (2.09%) Git
4 41 (0.94%) GitLab
5 40 (0.92%) Jenkins
6 30 (0.69%) Selenium
7 16 (0.37%) TeamCity
8 15 (0.34%) JUnit
9 11 (0.25%) Octopus Deploy
10 10 (0.23%) Maven
10 10 (0.23%) Mocha
11 9 (0.21%) Cucumber
11 9 (0.21%) Jasmine
11 9 (0.21%) Postman
11 9 (0.21%) TestNG
12 8 (0.18%) Artifactory
12 8 (0.18%) SonarQube
12 8 (0.18%) Visual Studio
13 7 (0.16%) JMeter
14 6 (0.14%) LoadRunner
General
1 2,078 (47.74%) Social Skills
2 863 (19.83%) Finance
3 810 (18.61%) Analytical Skills
4 578 (13.28%) Manufacturing
5 442 (10.15%) Marketing
6 434 (9.97%) Electronics
7 414 (9.51%) Inclusion and Diversity
8 285 (6.55%) Presentation Skills
9 263 (6.04%) Automotive
10 228 (5.24%) Aerospace
11 163 (3.74%) Legal
12 154 (3.54%) Law
12 154 (3.54%) Retail
13 150 (3.45%) Banking
14 149 (3.42%) Influencing Skills
15 136 (3.12%) Organisational Skills
16 132 (3.03%) Public Sector
17 70 (1.61%) Advertising
18 62 (1.42%) Telecoms
19 46 (1.06%) Publishing
Job Titles
1 618 (14.20%) Lead
2 442 (10.15%) Senior
3 404 (9.28%) Analyst
4 271 (6.23%) Developer
5 248 (5.70%) Technical Manager
6 241 (5.54%) Test Engineer
7 226 (5.19%) EMC Engineer
7 226 (5.19%) EMC Test Engineer
8 206 (4.73%) Systems Engineer
9 186 (4.27%) Project Manager
10 182 (4.18%) Junior
11 167 (3.84%) Graduate
12 158 (3.63%) Senior Manager
13 155 (3.56%) Product Manager
14 145 (3.33%) Junior Systems Engineer
15 142 (3.26%) Help Desk Manager
16 134 (3.08%) Team Leader
17 129 (2.96%) Architect
18 126 (2.89%) Engineering Manager
19 115 (2.64%) Software Engineer
Libraries, Frameworks & Software Standards
1 162 (3.72%) .NET
2 140 (3.22%) React
3 111 (2.55%) CSS
4 96 (2.21%) HTML
5 86 (1.98%) AngularJS
5 86 (1.98%) Elastic Stack
6 75 (1.72%) Node.js
7 62 (1.42%) Spring
8 59 (1.36%) RESTful
9 56 (1.29%) REST
10 49 (1.13%) Spring Boot
11 48 (1.10%) ASP.NET
12 40 (0.92%) .NET Core
13 37 (0.85%) .NET Framework
14 36 (0.83%) Web Services
15 35 (0.80%) React Native
16 33 (0.76%) jQuery
17 30 (0.69%) JSON
18 26 (0.60%) Kafka
19 24 (0.55%) RabbitMQ
Miscellaneous
1 239 (5.49%) Management Information System
2 227 (5.21%) Satnav
3 204 (4.69%) Product Ownership
4 104 (2.39%) Self-Motivation
5 91 (2.09%) Private Cloud
6 89 (2.04%) Security Posture
7 81 (1.86%) Onboarding
8 72 (1.65%) Social Media
9 69 (1.59%) Data Centre
10 60 (1.38%) Digital Media
11 52 (1.19%) Cloud Native
12 49 (1.13%) Mobile App
13 43 (0.99%) Enterprise Software
14 42 (0.96%) Data Protection Act
15 39 (0.90%) Analytical Mindset
15 39 (0.90%) Marketing Technology
15 39 (0.90%) Robotics
15 39 (0.90%) Virtual Team
16 37 (0.85%) Team-Oriented Environment
17 33 (0.76%) Driving Licence
Operating Systems
1 251 (5.77%) Windows
2 200 (4.59%) Linux
3 81 (1.86%) Windows Server
4 34 (0.78%) Windows Vista
5 31 (0.71%) Windows 10
6 24 (0.55%) Mac OS
7 17 (0.39%) Android
7 17 (0.39%) Apple iOS
8 14 (0.32%) Unix
9 12 (0.28%) VMS
10 10 (0.23%) Windows Server 2019
11 8 (0.18%) Windows Server 2012
12 7 (0.16%) Windows Server 2016
13 5 (0.11%) Red Hat Enterprise Linux
14 4 (0.092%) Mac OS X
15 3 (0.069%) CentOS
15 3 (0.069%) Oracle Linux
15 3 (0.069%) SUSE
16 2 (0.046%) AIX
16 2 (0.046%) Ubuntu
Processes & Methodologies
1 1,313 (30.16%) Problem-Solving
2 909 (20.88%) Agile
3 790 (18.15%) Project Management
4 590 (13.55%) Mentoring
5 528 (12.13%) Roadmaps
6 501 (11.51%) DevOps
7 500 (11.49%) Computer Science
8 483 (11.10%) Process Improvement
9 465 (10.68%) Decision-Making
10 456 (10.48%) Stakeholder Management
11 436 (10.02%) Mathematics
12 427 (9.81%) Coaching
13 414 (9.51%) Data Management
14 392 (9.01%) Service Delivery
15 391 (8.98%) Customer Experience
16 390 (8.96%) Physics
17 388 (8.91%) Customer Service
18 371 (8.52%) Test Automation
19 366 (8.41%) CI/CD
20 348 (7.99%) Data Analysis
Programming Languages
1 381 (8.75%) Python
2 368 (8.45%) SQL
3 230 (5.28%) Java
4 206 (4.73%) JavaScript
5 169 (3.88%) C#
6 150 (3.45%) MATLAB
7 123 (2.83%) Bash
8 118 (2.71%) PowerShell
9 76 (1.75%) Shell Script
10 72 (1.65%) TypeScript
11 60 (1.38%) PHP
12 50 (1.15%) C++
13 32 (0.74%) C
14 30 (0.69%) R
15 27 (0.62%) Data Analysis Expressions
15 27 (0.62%) Go
15 27 (0.62%) Progress 4GL
16 18 (0.41%) Ruby
17 16 (0.37%) T-SQL
18 14 (0.32%) VBA
Qualifications
1 1,736 (39.88%) Degree
2 244 (5.61%) BPSS Clearance
3 216 (4.96%) Computer Science Degree
4 175 (4.02%) Master's Degree
5 151 (3.47%) Security Cleared
6 126 (2.89%) DBS Check
7 96 (2.21%) CISSP
8 93 (2.14%) NVQ Level 3
9 91 (2.09%) NVQ Level 4
10 90 (2.07%) CBAP
11 87 (2.00%) SC Cleared
12 86 (1.98%) Chartered Engineer
12 86 (1.98%) PMI Certification
13 70 (1.61%) PMP
14 69 (1.59%) LPIC
14 69 (1.59%) RHCSA
15 68 (1.56%) Cisco Certification
15 68 (1.56%) CISM
16 66 (1.52%) Azure Certification
17 62 (1.42%) AWS Certification
Quality Assurance & Compliance
1 253 (5.81%) QA
2 175 (4.02%) NIST
3 133 (3.06%) ISO/IEC 27001
4 111 (2.55%) GDPR
5 108 (2.48%) SLA
6 93 (2.14%) Data Quality
7 79 (1.81%) SOC 2
8 63 (1.45%) Accessibility
9 60 (1.38%) COBIT
9 60 (1.38%) GMP
10 58 (1.33%) PMO
11 55 (1.26%) ISO 9001
12 49 (1.13%) PCI DSS
13 43 (0.99%) Sarbanes-Oxley
14 42 (0.96%) Cyber Essentials
15 22 (0.51%) Actionable Recommendations
16 18 (0.41%) GRC
16 18 (0.41%) NCSC
17 15 (0.34%) GLP
18 13 (0.30%) IFRS
System Software
1 196 (4.50%) Docker
2 144 (3.31%) Active Directory
3 55 (1.26%) VMware Infrastructure
4 32 (0.74%) Hyper-V
5 20 (0.46%) Virtual Desktop
6 14 (0.32%) Firmware
7 12 (0.28%) vSphere
8 9 (0.21%) Virtual Machines
9 8 (0.18%) VMware ESXi
10 6 (0.14%) Embedded Firmware
11 5 (0.11%) Virtual Servers
12 3 (0.069%) XenApp
12 3 (0.069%) XenDesktop
13 2 (0.046%) KVM
13 2 (0.046%) pfSense
13 2 (0.046%) Postfix
13 2 (0.046%) Sendmail
13 2 (0.046%) VMware NSX
14 1 (0.023%) BitLocker
14 1 (0.023%) Microsoft App-V
Systems Management
1 188 (4.32%) Kubernetes
2 131 (3.01%) Ansible
2 131 (3.01%) Terraform
3 104 (2.39%) Grafana
4 98 (2.25%) Prometheus
5 42 (0.96%) Microsoft Intune
6 27 (0.62%) SCCM
7 16 (0.37%) Progress Chef
8 14 (0.32%) CASB
9 12 (0.28%) Single Sign-On
10 10 (0.23%) Jamf Pro
11 9 (0.21%) Argo
11 9 (0.21%) Kibana
11 9 (0.21%) Puppet
12 7 (0.16%) Istio
12 7 (0.16%) Nessus
13 5 (0.11%) Active Directory Federation Services
13 5 (0.11%) linkerd
13 5 (0.11%) vCenter Server
14 4 (0.092%) HP Quality Center
Vendors
1 642 (14.75%) Microsoft
2 234 (5.38%) EMC
3 162 (3.72%) IBM
4 136 (3.12%) Google
4 136 (3.12%) Oracle
5 115 (2.64%) SAP
6 87 (2.00%) Salesforce
6 87 (2.00%) VMware
7 81 (1.86%) ServiceNow
8 66 (1.52%) Cisco
9 60 (1.38%) Databricks
10 31 (0.71%) Adobe
11 29 (0.67%) Progress
12 24 (0.55%) Citrix
13 23 (0.53%) Dynatrace
14 21 (0.48%) Meraki
15 20 (0.46%) Dell
15 20 (0.46%) HP
16 19 (0.44%) Splunk
17 18 (0.41%) Avaya