Analyst
UK

The median Analyst salary in the UK is £45,000 per year, according to job vacancies posted during the 6 months leading to 26 July 2024.

The table below provides salary benchmarking and summary statistics, comparing them to the same period in the previous two years.

6 months to
26 Jul 2024
Same period 2023 Same period 2022
Rank 14 14 24
Rank change year-on-year 0 +10 0
Permanent jobs requiring an Analyst 8,362 9,396 17,700
As % of all permanent jobs advertised in the UK 9.25% 11.64% 10.10%
As % of the Job Titles category 9.76% 12.68% 10.57%
Number of salaries quoted 5,029 6,736 11,847
10th Percentile £26,250 £26,391 £26,250
25th Percentile £32,500 £33,500 £34,000
Median annual salary (50th Percentile) £45,000 £45,000 £47,154
Median % change year-on-year - -4.57% +6.34%
75th Percentile £60,000 £60,000 £61,125
90th Percentile £77,500 £72,500 £73,750
UK excluding London median annual salary £39,500 £40,000 £40,310
% change year-on-year -1.25% -0.77% +0.78%

All Permanent IT Job Vacancies
UK

For comparison with the information above, the following table provides summary statistics for all permanent IT job vacancies. Most job vacancies include a discernible job title that can be normalized. As such, the figures in the second row provide an indication of the number of permanent jobs in our overall sample.

Permanent vacancies in the UK with a recognized job title 85,709 74,085 167,386
% of permanent jobs with a recognized job title 94.83% 91.81% 95.50%
Number of salaries quoted 58,134 51,472 87,435
10th Percentile £30,000 £32,500 £32,500
25th Percentile £40,000 £43,800 £43,750
Median annual salary (50th Percentile) £55,000 £60,000 £60,000
Median % change year-on-year -8.33% - +9.09%
75th Percentile £71,250 £80,000 £78,750
90th Percentile £90,000 £100,000 £95,000
UK excluding London median annual salary £50,000 £53,000 £52,000
% change year-on-year -5.66% +1.92% +9.47%

Analyst
Job Vacancy Trend

Job postings that featured Analyst in the job title as a proportion of all IT jobs advertised.
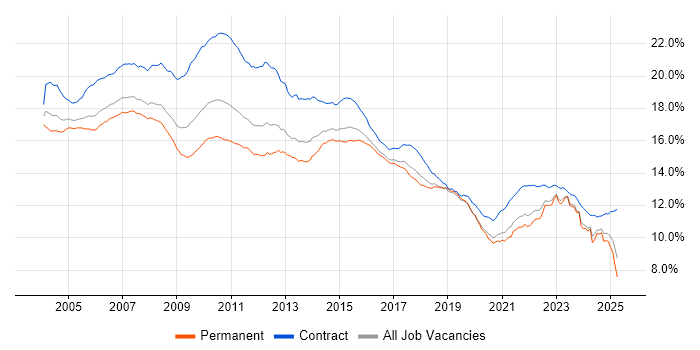
Job vacancy trend for Analyst in the UK

Analyst
Salary Trend

3-month moving average salary quoted in jobs citing Analyst.

Salary trend for Analyst in the UK

Analyst
Salary Histogram

Salary distribution for jobs citing Analyst over the 6 months to 26 July 2024.

Salary histogram for Analyst in the UK

Analyst
Top 19 Job Locations

The table below looks at the demand and provides a guide to the median salaries quoted in IT jobs citing Analyst within the UK over the 6 months to 26 July 2024. The 'Rank Change' column provides an indication of the change in demand within each location based on the same 6 month period last year.

Location Rank Change
on Same Period
Last Year
Matching
Permanent
IT Job Ads
Median Salary
Past 6 Months
Median Salary
% Change
on Same Period
Last Year
Live
Jobs
England 0 7,614 £45,000 - 769
UK excluding London -2 5,329 £39,500 -1.25% 715
Work from Home +3 2,944 £45,249 -0.20% 406
London 0 2,722 £62,500 +13.64% 215
North of England -2 1,318 £40,000 - 158
South East +1 1,280 £40,000 - 163
Midlands -5 1,059 £37,500 -6.25% 130
North West 0 781 £40,000 - 100
South West +7 676 £42,500 +6.25% 91
West Midlands -6 648 £37,500 -6.25% 87
East of England +8 497 £35,000 -4.11% 55
East Midlands +6 408 £35,000 -11.95% 43
Yorkshire -9 369 £37,500 -5.06% 46
Scotland -33 313 £38,500 -7.62% 63
North East +8 168 £37,500 +3.52% 12
Wales -2 152 £35,738 +2.11% 22
Northern Ireland +17 26 £40,000 +3.23% 51
Isle of Man -7 12 £46,500 +3.33% 3
Channel Islands -3 3 £62,000 +55.00%

Analyst Skill Set
Top 30 Co-occurring Skills and Capabilities

For the 6 months to 26 July 2024, Analyst job roles required the following skills and capabilities in order of popularity. The figures indicate the absolute number co-occurrences and as a proportion of all permanent job ads featuring Analyst in the job title.

1 2,968 (35.49%) Social Skills
2 2,541 (30.39%) Finance
3 2,450 (29.30%) Analytical Skills
4 2,215 (26.49%) Microsoft
5 1,829 (21.87%) SQL
6 1,798 (21.50%) Problem-Solving
7 1,594 (19.06%) Degree
8 1,487 (17.78%) Agile
9 1,397 (16.71%) Microsoft Excel
10 1,187 (14.20%) Decision-Making
11 1,001 (11.97%) Windows
12 943 (11.28%) Actionable Insight
13 912 (10.91%) Analytics
14 904 (10.81%) Customer Service
15 832 (9.95%) Business Intelligence
16 811 (9.70%) Retail
17 799 (9.56%) Microsoft 365
17 799 (9.56%) Power Platform
18 795 (9.51%) Active Directory
19 787 (9.41%) Business Analysis
20 782 (9.35%) Data Analysis
20 782 (9.35%) Microsoft Office
21 772 (9.23%) Python
22 771 (9.22%) Azure
23 764 (9.14%) Legal
24 750 (8.97%) Power BI
25 722 (8.63%) ITIL
26 674 (8.06%) Continuous Improvement
27 662 (7.92%) Mentoring
28 641 (7.67%) Influencing Skills

Analyst Skill Set
Co-occurring Skills and Capabilities by Category

The follow tables expand on the table above by listing co-occurrences grouped by category. The same employment type, locality and period is covered with up to 20 co-occurrences shown in each of the following categories:

Application Platforms
1 266 (3.18%) SharePoint
2 246 (2.94%) Microsoft Exchange
3 114 (1.36%) SAS
4 112 (1.34%) Confluence
5 39 (0.47%) WebLogic
6 32 (0.38%) Apache
7 27 (0.32%) Oracle Service Bus
8 24 (0.29%) CMS
9 22 (0.26%) IIS
10 16 (0.19%) Oracle Workflow
11 12 (0.14%) Skype for Business
12 10 (0.12%) WebSphere
13 9 (0.11%) Tomcat
14 8 (0.096%) IBM Notes
15 7 (0.084%) ArcGIS
16 6 (0.072%) Apache Airflow
17 5 (0.060%) WordPress
18 4 (0.048%) Jupyter
18 4 (0.048%) Oracle Application Server
19 3 (0.036%) IBM Domino
Applications
1 1,397 (16.71%) Microsoft Excel
2 782 (9.35%) Microsoft Office
3 156 (1.87%) Microsoft PowerPoint
4 149 (1.78%) MS Visio
5 31 (0.37%) Spreadsheet
6 19 (0.23%) Microsoft Project
7 15 (0.18%) SPSS
8 13 (0.16%) Trello
9 7 (0.084%) Chatbot
10 6 (0.072%) SOLIDWORKS
11 3 (0.036%) Stata
12 1 (0.012%) Adobe Creative Suite
12 1 (0.012%) AutoCAD
12 1 (0.012%) UserZoom
Business Applications
1 56 (0.67%) Dynamics CRM
2 51 (0.61%) iTrent
3 47 (0.56%) Aladdin
4 32 (0.38%) Remedy ITSM
5 27 (0.32%) SAP S/4HANA
6 23 (0.28%) Elite 3E
7 22 (0.26%) Endur
7 22 (0.26%) NEC Housing
8 20 (0.24%) SAP CO
8 20 (0.24%) SAP FI
8 20 (0.24%) SAP FI/CO
9 19 (0.23%) Dynamics NAV
10 18 (0.22%) Maximo
11 17 (0.20%) NetSuite
12 14 (0.17%) Magento
13 13 (0.16%) Infor SunSystems
14 12 (0.14%) SAP Business One
15 11 (0.13%) Oracle EBS
15 11 (0.13%) Oracle Financials
15 11 (0.13%) ResourceLink
Cloud Services
1 799 (9.56%) Microsoft 365
1 799 (9.56%) Power Platform
2 771 (9.22%) Azure
3 438 (5.24%) AWS
4 205 (2.45%) Entra ID
5 166 (1.99%) SaaS
6 146 (1.75%) Dynamics 365
7 90 (1.08%) Azure DevOps
8 64 (0.77%) GCP
9 53 (0.63%) SuccessFactors
10 49 (0.59%) Google Analytics
10 49 (0.59%) Mimecast
11 42 (0.50%) PowerApps
12 41 (0.49%) Azure Sentinel
13 40 (0.48%) Google Sheets
13 40 (0.48%) PaaS
14 36 (0.43%) OneDrive
15 33 (0.39%) dbt
15 33 (0.39%) Power Automate
16 32 (0.38%) WhatsApp
Communications & Networking
1 501 (5.99%) Broadband
2 383 (4.58%) Firewall
3 206 (2.46%) LAN
4 192 (2.30%) WAN
5 182 (2.18%) DNS
6 150 (1.79%) TCP/IP
7 137 (1.64%) DHCP
8 115 (1.38%) Internet
8 115 (1.38%) VPN
9 86 (1.03%) Wireless
10 85 (1.02%) VoIP
11 68 (0.81%) Wi-Fi
12 63 (0.75%) Network Security
13 58 (0.69%) WLAN
14 54 (0.65%) Intrusion Detection
15 52 (0.62%) SD-WAN
16 46 (0.55%) VLAN
17 32 (0.38%) Remote Desktop
17 32 (0.38%) SSL
18 30 (0.36%) OSPF
Database & Business Intelligence
1 750 (8.97%) Power BI
2 494 (5.91%) Tableau
3 248 (2.97%) SQL Server
4 144 (1.72%) Data Warehouse
5 112 (1.34%) SQL Server Reporting Services
6 67 (0.80%) Relational Database
7 65 (0.78%) Data Mining
8 64 (0.77%) SQL Server Integration Services
9 60 (0.72%) Big Data
10 55 (0.66%) Power Query
11 53 (0.63%) Oracle Database
12 48 (0.57%) BigQuery
13 40 (0.48%) Data Lake
14 36 (0.43%) MySQL
15 35 (0.42%) QlikView
16 31 (0.37%) Amazon QuickSight
16 31 (0.37%) Metadata
17 30 (0.36%) Qlik Sense
18 28 (0.33%) MS Access
19 27 (0.32%) VLDB
Development Applications
1 272 (3.25%) JIRA
2 148 (1.77%) Git
3 39 (0.47%) Selenium
4 36 (0.43%) SQL Server Management Studio (SSMS)
5 25 (0.30%) Visual Studio
6 22 (0.26%) Postman
7 21 (0.25%) Eclipse
8 18 (0.22%) Burp Suite
8 18 (0.22%) JMeter
9 14 (0.17%) Metasploit
10 11 (0.13%) WebDriver
11 10 (0.12%) TestRail
12 9 (0.11%) Oracle Forms
12 9 (0.11%) SpecFlow
12 9 (0.11%) Subversion
12 9 (0.11%) Toad
13 7 (0.084%) Jenkins
13 7 (0.084%) Team Foundation Server
13 7 (0.084%) TeamCity
14 6 (0.072%) SoapUI
General
1 2,968 (35.49%) Social Skills
2 2,541 (30.39%) Finance
3 2,450 (29.30%) Analytical Skills
4 811 (9.70%) Retail
5 764 (9.14%) Legal
6 641 (7.67%) Influencing Skills
7 601 (7.19%) Banking
8 539 (6.45%) Inclusion and Diversity
9 514 (6.15%) Law
10 310 (3.71%) Organisational Skills
11 303 (3.62%) Presentation Skills
12 289 (3.46%) Marketing
13 235 (2.81%) Manufacturing
14 200 (2.39%) Front Office
15 199 (2.38%) Investment Banking
16 183 (2.19%) Public Sector
17 134 (1.60%) Pharmaceutical
18 122 (1.46%) Telecoms
19 74 (0.88%) Local Government
20 68 (0.81%) Back Office
Libraries, Frameworks & Software Standards
1 84 (1.00%) .NET
2 77 (0.92%) HTML
3 47 (0.56%) REST
4 46 (0.55%) XML
5 34 (0.41%) EDI
5 34 (0.41%) FIX Protocol
6 32 (0.38%) Oracle Fusion
7 31 (0.37%) CSS
7 31 (0.37%) JSON
8 23 (0.28%) Web Services
9 18 (0.22%) ADO
10 17 (0.20%) OLE
11 16 (0.19%) SOAP
12 15 (0.18%) RESTful
13 14 (0.17%) 802.1X
14 13 (0.16%) Lightning Web Components
14 13 (0.16%) SAML
15 12 (0.14%) ASP.NET
15 12 (0.14%) J2EE
15 12 (0.14%) Middleware
Miscellaneous
1 371 (4.44%) Management Information System
2 247 (2.95%) Product Ownership
3 215 (2.57%) Onboarding
4 190 (2.27%) Self-Motivation
5 151 (1.81%) Foreign Exchange (FX)
6 139 (1.66%) Fixed Income
7 124 (1.48%) Hedge funds
8 122 (1.46%) Derivative
9 104 (1.24%) Equities
10 88 (1.05%) Driving Licence
11 82 (0.98%) Analytical Mindset
12 80 (0.96%) Life Science
13 78 (0.93%) Cyber Threat
14 75 (0.90%) Security Operations Centre
15 69 (0.83%) Cyberattack
16 61 (0.73%) Credit Risk
17 60 (0.72%) Data Centre
18 59 (0.71%) NHS
19 50 (0.60%) Video Conferencing
20 47 (0.56%) Enterprise Software
Operating Systems
1 1,001 (11.97%) Windows
2 376 (4.50%) Windows 10
3 299 (3.58%) Windows Server
4 233 (2.79%) Linux
5 109 (1.30%) Unix
6 98 (1.17%) Android
6 98 (1.17%) Apple iOS
7 65 (0.78%) Windows Server 2019
8 53 (0.63%) Windows Server 2016
9 43 (0.51%) Mac OS
10 41 (0.49%) Windows 7
11 39 (0.47%) Solaris
12 35 (0.42%) Windows Server 2012
13 20 (0.24%) Windows Vista
14 17 (0.20%) Mac OS X
15 14 (0.17%) CentOS
15 14 (0.17%) Windows Server 2008
16 12 (0.14%) Windows 8
17 9 (0.11%) Ubuntu
18 6 (0.072%) Red Hat Enterprise Linux
Processes & Methodologies
1 1,798 (21.50%) Problem-Solving
2 1,487 (17.78%) Agile
3 1,187 (14.20%) Decision-Making
4 943 (11.28%) Actionable Insight
5 912 (10.91%) Analytics
6 904 (10.81%) Customer Service
7 832 (9.95%) Business Intelligence
8 787 (9.41%) Business Analysis
9 782 (9.35%) Data Analysis
10 722 (8.63%) ITIL
11 674 (8.06%) Continuous Improvement
12 662 (7.92%) Mentoring
13 607 (7.26%) Cybersecurity
14 588 (7.03%) Visualisation
15 578 (6.91%) Business Case
16 539 (6.45%) Mathematics
17 513 (6.13%) Budgeting
18 511 (6.11%) Budgeting and Forecasting
19 474 (5.67%) Process Improvement
20 472 (5.64%) Change Management
Programming Languages
1 1,829 (21.87%) SQL
2 772 (9.23%) Python
3 173 (2.07%) PowerShell
4 143 (1.71%) R
5 133 (1.59%) VBA
6 113 (1.35%) C#
7 86 (1.03%) T-SQL
8 84 (1.00%) Java
9 79 (0.94%) JavaScript
10 62 (0.74%) Data Analysis Expressions
11 56 (0.67%) PL/SQL
12 47 (0.56%) Bash
13 36 (0.43%) C++
14 23 (0.28%) Shell Script
15 22 (0.26%) RPG
16 18 (0.22%) MATLAB
16 18 (0.22%) VB
17 16 (0.19%) PHP
18 14 (0.17%) Perl
19 11 (0.13%) TypeScript
Qualifications
1 1,594 (19.06%) Degree
2 539 (6.45%) ACCA
3 538 (6.43%) CIMA
4 439 (5.25%) Security Cleared
5 293 (3.50%) SC Cleared
6 187 (2.24%) DBS Check
7 169 (2.02%) CISSP
8 144 (1.72%) Master's Degree
9 119 (1.42%) Computer Science Degree
10 95 (1.14%) CISM
11 91 (1.09%) DV Cleared
12 77 (0.92%) Microsoft Certification
13 74 (0.88%) Cisco Certification
14 68 (0.81%) CISA
14 68 (0.81%) CompTIA Security+
15 54 (0.65%) A+ Certification
16 53 (0.63%) PhD
17 50 (0.60%) ISTQB
18 40 (0.48%) CCNA
19 38 (0.45%) CompTIA CySA+
Quality Assurance & Compliance
1 301 (3.60%) SLA
2 282 (3.37%) Data Quality
3 263 (3.15%) QA
4 226 (2.70%) ISO/IEC 27001
5 209 (2.50%) GDPR
6 138 (1.65%) NIST
7 82 (0.98%) GRC
8 81 (0.97%) Cyber Essentials
9 75 (0.90%) PMO
10 70 (0.84%) Sarbanes-Oxley
11 52 (0.62%) PCI DSS
12 43 (0.51%) NCSC
13 37 (0.44%) IFRS
14 35 (0.42%) Accessibility
15 32 (0.38%) GAAP
16 29 (0.35%) COBIT
17 26 (0.31%) Actionable Recommendations
18 24 (0.29%) ISO 9001
19 18 (0.22%) Cyber Essentials PLUS
19 18 (0.22%) GLP
System Software
1 795 (9.51%) Active Directory
2 121 (1.45%) VMware Infrastructure
3 52 (0.62%) RACF
4 49 (0.59%) XenApp
5 48 (0.57%) XenDesktop
6 47 (0.56%) Hyper-V
7 27 (0.32%) Oracle RAC
8 26 (0.31%) Virtual Desktop
9 20 (0.24%) vSphere
10 16 (0.19%) Firmware
11 15 (0.18%) VMware ESXi
12 11 (0.13%) Virtual Machines
13 7 (0.084%) Terminal Services
13 7 (0.084%) Virtual Servers
13 7 (0.084%) VMware Workstation
14 5 (0.060%) Embedded Firmware
15 3 (0.036%) Docker
15 3 (0.036%) Microsoft Virtual Server
16 1 (0.012%) DFS Replication
16 1 (0.012%) IAG
Systems Management
1 162 (1.94%) Microsoft Intune
2 138 (1.65%) SCCM
3 41 (0.49%) Single Sign-On
4 40 (0.48%) Terraform
5 29 (0.35%) Jamf Pro
6 27 (0.32%) Data Guard
6 27 (0.32%) Oracle RMAN
7 21 (0.25%) WSUS
8 15 (0.18%) CASB
9 13 (0.16%) FortiGate
9 13 (0.16%) QRadar
10 12 (0.14%) Active Directory Federation Services
10 12 (0.14%) Nessus
10 12 (0.14%) OpenSSO
11 11 (0.13%) CSIRT
11 11 (0.13%) EnCase
11 11 (0.13%) Nmap
12 9 (0.11%) Failover Clustering
13 8 (0.096%) Control-M
13 8 (0.096%) Grafana
Vendors
1 2,215 (26.49%) Microsoft
2 279 (3.34%) SAP
3 229 (2.74%) Oracle
4 211 (2.52%) VMware
5 157 (1.88%) Databricks
6 155 (1.85%) Cisco
7 150 (1.79%) Google
8 129 (1.54%) ServiceNow
9 111 (1.33%) Citrix
10 107 (1.28%) Bloomberg
11 99 (1.18%) Salesforce
12 73 (0.87%) Alteryx
13 60 (0.72%) IFS
14 58 (0.69%) Adobe
15 56 (0.67%) Apple
16 55 (0.66%) Remedy
17 53 (0.63%) CyberArk
18 51 (0.61%) IBM
19 42 (0.50%) Dell
20 38 (0.45%) HP