Information Security Contract Job Trends in the City of London

Information Security (InfoSec)
Central London > City of London

The table below provides summary statistics and contractor rates for jobs advertised in the City of London requiring Information Security skills. It covers vacancies from the 6 months leading up to 17 September 2025, with comparisons to the same periods in the previous two years.

6 months to
17 Sep 2025
Same period 2024 Same period 2023
Rank 88 73 65
Rank change year-on-year -15 -8 +47
Contract jobs citing Information Security 33 56 97
As % of all contract jobs advertised in the City of London 1.87% 2.69% 3.22%
As % of the Processes & Methodologies category 1.99% 2.93% 3.57%
Number of daily rates quoted 19 33 73
10th Percentile £330 £425 £459
25th Percentile £438 £450 £538
Median daily rate (50th Percentile) £525 £525 £655
Median % change year-on-year - -19.85% +0.77%
75th Percentile £602 £625 £788
90th Percentile £645 £700 £850
Central London median daily rate £525 £500 £650
% change year-on-year +5.00% -23.08% -
Number of hourly rates quoted 1 1 0
Median hourly rate £22.00 £17.00 -
Median % change year-on-year +29.41% - -
Central London median hourly rate £22.00 £17.00 -
% change year-on-year +29.41% - -

All Process and Methodology Skills
City of London

Information Security falls under the Processes and Methodologies category. For comparison with the information above, the following table provides summary statistics for all contract job vacancies requiring process or methodology skills in the City of London.

Contract vacancies with a requirement for process or methodology skills 1,661 1,913 2,719
As % of all contract IT jobs advertised in the City of London 94.27% 92.02% 90.30%
Number of daily rates quoted 1,107 1,212 1,878
10th Percentile £325 £375 £363
25th Percentile £419 £475 £475
Median daily rate (50th Percentile) £550 £575 £600
Median % change year-on-year -4.35% -4.17% +4.35%
75th Percentile £675 £688 £705
90th Percentile £763 £788 £813
Central London median daily rate £550 £575 £600
% change year-on-year -4.35% -4.17% +4.35%
Number of hourly rates quoted 22 17 16
10th Percentile £17.35 £15.20 £14.25
25th Percentile £23.98 £20.22 £16.02
Median hourly rate £28.33 £27.00 £25.00
Median % change year-on-year +4.91% +8.00% -41.86%
75th Percentile £53.50 £78.75 £44.87
90th Percentile £63.75 £137.50 £60.88
Central London median hourly rate £31.25 £35.00 £26.00
% change year-on-year -10.71% +34.62% -38.82%

Information Security
Job Vacancy Trend in the City of London

Job postings citing Information Security as a proportion of all IT jobs advertised in the City of London.
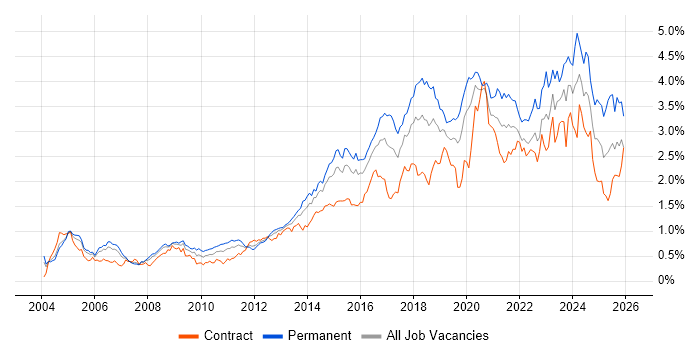
Job vacancy trend for Information Security in the City of London

Information Security
Daily Rate Trend in the City of London

Contractor daily rate distribution trend for jobs in the City of London citing Information Security.

Contractor daily rate distribution trend for jobs in the City of London citing Information Security

Information Security
Daily Rate Histogram in the City of London

Daily rate distribution for jobs citing Information Security in the City of London over the 6 months to 17 September 2025.

Daily rate histogram for Information Security in the City of London

Information Security
Hourly Rate Trend in the City of London

Contractor hourly rate distribution trend for jobs in the City of London citing Information Security.

Contractor hourly rate distribution trend for jobs in the City of London citing Information Security

Information Security
Co-occurring Skills and Capabilities in the City of London by Category

The follow tables expand on the table above by listing co-occurrences grouped by category. The same employment type, locality and period is covered with up to 20 co-occurrences shown in each of the following categories:

Application Platforms
1 3 (9.09%) Confluence
2 2 (6.06%) SharePoint
Applications
1 5 (15.15%) Microsoft Office
2 3 (9.09%) Microsoft Excel
3 2 (6.06%) MS Visio
4 1 (3.03%) Microsoft PowerPoint
Cloud Services
1 7 (21.21%) Azure
2 3 (9.09%) AWS
2 3 (9.09%) Microsoft 365
2 3 (9.09%) Power Platform
3 2 (6.06%) Azure DevOps
3 2 (6.06%) Entra ID
3 2 (6.06%) GCP
4 1 (3.03%) Azure Sentinel
4 1 (3.03%) Dynamics 365
Communications & Networking
1 4 (12.12%) Firewall
2 3 (9.09%) Intrusion Detection
2 3 (9.09%) Network Security
3 2 (6.06%) Modbus
4 1 (3.03%) LAN
4 1 (3.03%) SSH
4 1 (3.03%) WAN
4 1 (3.03%) Wi-Fi
Database & Business Intelligence
1 2 (6.06%) Power BI
2 1 (3.03%) Tableau
Development Applications
1 5 (15.15%) JIRA
General
1 16 (48.48%) Finance
2 10 (30.30%) Social Skills
3 6 (18.18%) Banking
4 5 (15.15%) Legal
5 4 (12.12%) Analytical Skills
6 3 (9.09%) Law
6 3 (9.09%) Public Sector
6 3 (9.09%) Telecoms
7 2 (6.06%) Corporate Banking
7 2 (6.06%) Manufacturing
7 2 (6.06%) Retail Banking
8 1 (3.03%) Back Office
8 1 (3.03%) Inclusion and Diversity
8 1 (3.03%) Influencing Skills
8 1 (3.03%) Investment Banking
8 1 (3.03%) Marketing
8 1 (3.03%) Presentation Skills
8 1 (3.03%) Private Banking
8 1 (3.03%) Retail
Job Titles
1 5 (15.15%) Analyst
1 5 (15.15%) Consultant
1 5 (15.15%) Security Engineer
2 4 (12.12%) Security Consultant
3 3 (9.09%) Project Manager
3 3 (9.09%) Senior
4 2 (6.06%) Cybersecurity Consultant
4 2 (6.06%) Cybersecurity Engineer
4 2 (6.06%) Designer
4 2 (6.06%) Infrastructure Manager
4 2 (6.06%) Lead
4 2 (6.06%) Security Analyst
4 2 (6.06%) Senior Security Engineer
4 2 (6.06%) Service Designer
5 1 (3.03%) AML Business Analyst
5 1 (3.03%) ICT Support
5 1 (3.03%) IT Analyst
5 1 (3.03%) KYC Analyst
5 1 (3.03%) Transformation Director
5 1 (3.03%) Vulnerability Consultant
Libraries, Frameworks & Software Standards
1 1 (3.03%) OAuth
1 1 (3.03%) OpenID
1 1 (3.03%) SailPoint
Miscellaneous
1 9 (27.27%) Management Information System
2 7 (21.21%) Security Posture
3 3 (9.09%) Enterprise Software
4 2 (6.06%) Data Centre
4 2 (6.06%) Data Protection Act
4 2 (6.06%) Insider Threat
4 2 (6.06%) Life Science
4 2 (6.06%) Onboarding
4 2 (6.06%) Operational Technology
4 2 (6.06%) Renewable Energy
4 2 (6.06%) SCADA
5 1 (3.03%) Cyber Threat
5 1 (3.03%) Fat Client
5 1 (3.03%) Hedge funds
5 1 (3.03%) iPad
5 1 (3.03%) iPhone
5 1 (3.03%) Product Ownership
5 1 (3.03%) Tandem
5 1 (3.03%) Thin Client
Operating Systems
1 5 (15.15%) Windows
2 2 (6.06%) Linux
3 1 (3.03%) Apple iOS
3 1 (3.03%) Unix
3 1 (3.03%) Windows Server
Processes & Methodologies
1 14 (42.42%) Cybersecurity
2 7 (21.21%) Continuous Improvement
2 7 (21.21%) Incident Response
2 7 (21.21%) Project Management
3 6 (18.18%) Data Protection
3 6 (18.18%) ITIL
3 6 (18.18%) Roadmaps
3 6 (18.18%) Security Management
4 5 (15.15%) Information Security Management
4 5 (15.15%) Risk Assessment
4 5 (15.15%) Risk Management
5 4 (12.12%) Disaster Recovery
5 4 (12.12%) Problem-Solving
5 4 (12.12%) Remediation Plan
5 4 (12.12%) Service Management
5 4 (12.12%) Stakeholder Engagement
5 4 (12.12%) Stakeholder Management
6 3 (9.09%) Application Security
6 3 (9.09%) Cloud Security
6 3 (9.09%) Impact Assessments
Programming Languages
1 2 (6.06%) Python
2 1 (3.03%) Java
2 1 (3.03%) Perl
2 1 (3.03%) PowerShell
2 1 (3.03%) SQL
Qualifications
1 9 (27.27%) CISSP
2 7 (21.21%) Degree
3 6 (18.18%) CISA
4 5 (15.15%) CISM
5 4 (12.12%) SC Cleared
5 4 (12.12%) Security Cleared
6 3 (9.09%) Computer Science Degree
6 3 (9.09%) CRISC
7 2 (6.06%) BPSS Clearance
7 2 (6.06%) CCNA
7 2 (6.06%) CCNP
7 2 (6.06%) Cisco Certification
7 2 (6.06%) ISO 27001 Lead Auditor
7 2 (6.06%) SANS
8 1 (3.03%) CompTIA Security+
8 1 (3.03%) GIAC
8 1 (3.03%) GSEC
8 1 (3.03%) ISO 27001 Lead Implementer
8 1 (3.03%) ISSMP
8 1 (3.03%) SSCP
Quality Assurance & Compliance
1 10 (30.30%) ISO/IEC 27001
2 6 (18.18%) NIST
3 3 (9.09%) Accessibility
3 3 (9.09%) COBIT
4 2 (6.06%) GDPR
4 2 (6.06%) GRC
4 2 (6.06%) ISO/IEC 27002 (supersedes ISO/IEC 17799)
4 2 (6.06%) ITGC
5 1 (3.03%) COSO
5 1 (3.03%) Cyber Essentials
5 1 (3.03%) ISO 9001
5 1 (3.03%) ISO/IEC 20000
5 1 (3.03%) PCI DSS
5 1 (3.03%) PMO
5 1 (3.03%) QA
5 1 (3.03%) Sarbanes-Oxley
5 1 (3.03%) SLA
System Software
1 4 (12.12%) Active Directory
2 2 (6.06%) Virtual Machines
3 1 (3.03%) Hyper-V
3 1 (3.03%) VMware Infrastructure
Systems Management
1 1 (3.03%) Microsoft Intune
1 1 (3.03%) QRadar
1 1 (3.03%) SCCM
Vendors
1 11 (33.33%) Microsoft
2 3 (9.09%) Tenable
3 2 (6.06%) Cisco
3 2 (6.06%) Google
3 2 (6.06%) Palo Alto
3 2 (6.06%) Rockwell
4 1 (3.03%) Apple
4 1 (3.03%) Citrix
4 1 (3.03%) CyberArk
4 1 (3.03%) Exabeam
4 1 (3.03%) IBM
4 1 (3.03%) Infoblox
4 1 (3.03%) Okta
4 1 (3.03%) Ping Identity
4 1 (3.03%) Qualys
4 1 (3.03%) Rapid7
4 1 (3.03%) Salesforce
4 1 (3.03%) Splunk
4 1 (3.03%) VMware