User Acceptance Testing Contracts with Hybrid/Remote/WFH Options

User Acceptance Testing (UAT)
UK > Work from Home

The table below provides summary statistics for remote or hybrid contract work requiring User Acceptance Testing skills. It includes a benchmarking guide to the contractor rates offered in vacancies that cited User Acceptance Testing over the 6 months leading up to 1 May 2025, comparing them to the same period in the previous two years.

6 months to
1 May 2025
Same period 2024 Same period 2023
Rank 105 94 163
Rank change year-on-year -11 +69 -26
Contract jobs citing User Acceptance Testing 243 351 403
As % of all contract jobs with a WFH option 2.45% 2.29% 1.56%
As % of the Processes & Methodologies category 2.69% 2.60% 1.73%
Number of daily rates quoted 161 249 301
10th Percentile £313 £350 £350
25th Percentile £406 £413 £413
Median daily rate (50th Percentile) £500 £500 £500
75th Percentile £613 £600 £638
90th Percentile £788 £725 £750
UK median daily rate £500 £500 £525
% change year-on-year - -4.76% +5.00%
Number of hourly rates quoted 6 3 1
10th Percentile £36.75 £36.10 -
25th Percentile £54.69 £53.88 £61.25
Median hourly rate £62.50 £85.00 £62.50
Median % change year-on-year -26.47% +36.00% +38.89%
75th Percentile £64.69 £86.50 £63.75
90th Percentile £75.13 - -
UK median hourly rate £58.75 £36.25 £62.50
% change year-on-year +62.07% -42.00% +56.25%

All Process and Methodology Skills
Work from Home

User Acceptance Testing falls under the Processes and Methodologies category. For comparison with the information above, the following table provides summary statistics for all contract job vacancies with remote or hybrid options requiring process or methodology skills.

Contract vacancies with a requirement for process or methodology skills 9,021 13,483 23,229
As % of all contract jobs with a WFH option 91.08% 87.87% 89.84%
Number of daily rates quoted 6,191 8,996 16,418
10th Percentile £340 £325 £363
25th Percentile £419 £425 £450
Median daily rate (50th Percentile) £525 £525 £540
Median % change year-on-year - -2.78% +2.86%
75th Percentile £638 £638 £650
90th Percentile £763 £750 £750
UK median daily rate £520 £525 £550
% change year-on-year -0.95% -4.55% +4.76%
Number of hourly rates quoted 224 579 532
10th Percentile £14.20 £15.17 £19.00
25th Percentile £19.56 £25.25 £30.54
Median hourly rate £39.52 £43.00 £55.00
Median % change year-on-year -8.09% -21.82% +57.14%
75th Percentile £66.13 £60.00 £68.75
90th Percentile £75.00 £75.25 £80.23
UK median hourly rate £29.00 £35.65 £37.30
% change year-on-year -18.65% -4.42% +49.20%

User Acceptance Testing
Trend for Jobs with a WFH Option

Job vacancies with remote working options citing User Acceptance Testing as a proportion of all IT jobs advertised.
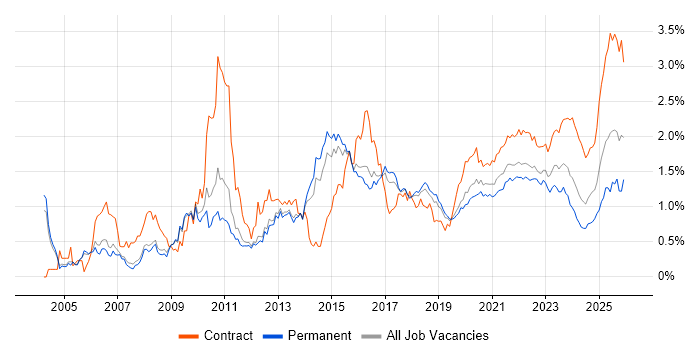
User Acceptance Testing trend for jobs with Hybrid/Remote/WFH options

User Acceptance Testing
Daily Rate Trend for Jobs with a WFH Option

3-month moving average daily rate quoted in job vacancies with remote working options citing User Acceptance Testing.

User Acceptance Testing daily rate for jobs with a WFH option

User Acceptance Testing
Daily Rate Histogram for Jobs with a WFH Option

Daily rate distribution for jobs with remote working options citing User Acceptance Testing over the 6 months to 1 May 2025.

User Acceptance Testing daily rate histogram for jobs with a WFH option

User Acceptance Testing
Hourly Rate Trend for Jobs with a WFH Option

3-month moving average hourly rate quoted in job vacancies with remote working options citing User Acceptance Testing.

User Acceptance Testing hourly rate for jobs with a WFH option

User Acceptance Testing
Hourly Rate Histogram for Jobs with a WFH Option

Hourly rate distribution for jobs with remote working options citing User Acceptance Testing over the 6 months to 1 May 2025.

User Acceptance Testing hourly rate histogram for jobs with a WFH option

User Acceptance Testing
Co-occurring Skills and Capabilities with WFH Options by Category

The follow tables expand on the table above by listing co-occurrences grouped by category. The same employment type, locality and period is covered with up to 20 co-occurrences shown in each of the following categories:

Application Platforms
1 12 (4.94%) Confluence
2 5 (2.06%) NetWeaver
2 5 (2.06%) SharePoint
3 1 (0.41%) Apache
3 1 (0.41%) CMS
3 1 (0.41%) Drupal
3 1 (0.41%) Microsoft Exchange
3 1 (0.41%) SAS
3 1 (0.41%) Sitecore CMS
Applications
1 15 (6.17%) Microsoft Excel
2 12 (4.94%) MS Visio
3 11 (4.53%) Microsoft Office
4 9 (3.70%) Microsoft PowerPoint
5 6 (2.47%) Microsoft Project
6 1 (0.41%) Fusion 360
6 1 (0.41%) Notepad++
6 1 (0.41%) Siemens NX
Business Applications
1 19 (7.82%) Aladdin
2 16 (6.58%) SAP S/4HANA
3 5 (2.06%) Dynamics CRM
4 4 (1.65%) CA PPM
4 4 (1.65%) Oracle EBS
4 4 (1.65%) SAP MDG
4 4 (1.65%) Unit4 Business World
5 3 (1.23%) Dynamics AX
5 3 (1.23%) NetSuite
5 3 (1.23%) SimCorp Dimension
6 2 (0.82%) Actimize
6 2 (0.82%) Oracle Payroll
6 2 (0.82%) Payment Gateway
6 2 (0.82%) PeopleSoft Financials
6 2 (0.82%) Salesforce CRM
6 2 (0.82%) SAP CO
6 2 (0.82%) SAP FI
6 2 (0.82%) SAP FI/CO
6 2 (0.82%) SAP GTS
7 1 (0.41%) SAP IBP
Cloud Services
1 22 (9.05%) Azure
2 14 (5.76%) Power Platform
3 11 (4.53%) Azure DevOps
3 11 (4.53%) Dynamics 365
4 9 (3.70%) AWS
5 6 (2.47%) Cloud Computing
5 6 (2.47%) SaaS
6 5 (2.06%) GCP
6 5 (2.06%) SuccessFactors
7 4 (1.65%) GitHub
7 4 (1.65%) OCI
8 3 (1.23%) Adobe Analytics
8 3 (1.23%) Power Automate
9 2 (0.82%) Amazon S3
9 2 (0.82%) PowerApps
10 1 (0.41%) GitHub Actions
10 1 (0.41%) Google Analytics
10 1 (0.41%) Microsoft 365
10 1 (0.41%) Smartsheet
10 1 (0.41%) WhatsApp
Communications & Networking
1 5 (2.06%) HTTP
2 2 (0.82%) Cisco Nexus
2 2 (0.82%) Firewall
3 1 (0.41%) VPN
Database & Business Intelligence
1 12 (4.94%) Power BI
1 12 (4.94%) SQL Server
2 10 (4.12%) Data Warehouse
3 4 (1.65%) MS Access
3 4 (1.65%) PostgreSQL
3 4 (1.65%) Tableau
4 3 (1.23%) SQL Server Reporting Services
5 2 (0.82%) Amazon Athena
5 2 (0.82%) Apache Iceberg
5 2 (0.82%) DataStage
5 2 (0.82%) Delta Lake
5 2 (0.82%) Oracle Reports
5 2 (0.82%) Qlik Sense
5 2 (0.82%) Relational Database
6 1 (0.41%) BusinessObjects Business Intelligence
6 1 (0.41%) Looker
6 1 (0.41%) Metadata
6 1 (0.41%) Oracle Database
6 1 (0.41%) Parquet
6 1 (0.41%) Tableau Server
Development Applications
1 28 (11.52%) JIRA
2 8 (3.29%) QARun
2 8 (3.29%) WinRunner
3 5 (2.06%) Postman
4 3 (1.23%) MSI
4 3 (1.23%) Oracle APEX
5 2 (0.82%) Jenkins
5 2 (0.82%) Selenium
5 2 (0.82%) Sonatype Nexus
5 2 (0.82%) Zephyr
6 1 (0.41%) Cucumber
6 1 (0.41%) Cypress.io
6 1 (0.41%) Gatling
6 1 (0.41%) GCC
6 1 (0.41%) Git
6 1 (0.41%) GitLab
6 1 (0.41%) REST Assured
6 1 (0.41%) SpecFlow
6 1 (0.41%) TestRail
6 1 (0.41%) Travis CI
General
1 95 (39.09%) Social Skills
2 88 (36.21%) Finance
3 34 (13.99%) Analytical Skills
4 28 (11.52%) Front Office
5 20 (8.23%) Banking
6 14 (5.76%) Presentation Skills
7 12 (4.94%) Marketing
7 12 (4.94%) Retail
8 11 (4.53%) Financial Institution
8 11 (4.53%) Public Sector
9 10 (4.12%) Organisational Skills
10 8 (3.29%) Back Office
10 8 (3.29%) Manufacturing
11 7 (2.88%) Documentation Skills
12 6 (2.47%) Pharmaceutical
13 4 (1.65%) Arabic Language
13 4 (1.65%) Billing
13 4 (1.65%) Czech Language
13 4 (1.65%) Inclusion and Diversity
14 3 (1.23%) General Ledger
Job Titles
1 104 (42.80%) Analyst
2 69 (28.40%) Business Analyst
3 25 (10.29%) Consultant
4 23 (9.47%) Test Analyst
5 20 (8.23%) Developer
6 19 (7.82%) Fixed Income Business Analyst
7 17 (7.00%) Business Manager
8 15 (6.17%) Project Manager
8 15 (6.17%) Test Manager
9 14 (5.76%) Lead
10 11 (4.53%) Financial Analyst
10 11 (4.53%) Senior
11 10 (4.12%) Data Analyst
11 10 (4.12%) UAT Analyst
12 9 (3.70%) Electronic Trading Business Analyst
12 9 (3.70%) Front Office Business Analyst
12 9 (3.70%) Investment Banking Business Analyst
12 9 (3.70%) SAP Consultant
13 8 (3.29%) SAP Analyst
13 8 (3.29%) UAT Test Analyst
Libraries, Frameworks & Software Standards
1 12 (4.94%) Middleware
2 9 (3.70%) REST
3 8 (3.29%) Oracle Fusion
3 8 (3.29%) SOAP
4 7 (2.88%) .NET
4 7 (2.88%) EDI
4 7 (2.88%) Web Services
4 7 (2.88%) XML
5 6 (2.47%) IDoc
6 5 (2.06%) JDBC
6 5 (2.06%) JMS
6 5 (2.06%) SAP PI
6 5 (2.06%) XSLT
7 3 (1.23%) PySpark
7 3 (1.23%) SAP Fiori
8 2 (0.82%) ADO
8 2 (0.82%) BAPI
8 2 (0.82%) FpML
8 2 (0.82%) SailPoint
9 1 (0.41%) SAML
Miscellaneous
1 27 (11.11%) Fixed Income
2 20 (8.23%) Derivative
3 17 (7.00%) Hedge funds
4 12 (4.94%) Virtual Team
5 11 (4.53%) Legacy Systems
5 11 (4.53%) Product Ownership
6 8 (3.29%) Legacy Applications
7 6 (2.47%) Data Structures
8 5 (2.06%) Enterprise Software
8 5 (2.06%) PMI
9 4 (1.65%) Management Information System
9 4 (1.65%) Onboarding
10 3 (1.23%) CMDB
10 3 (1.23%) Data Centre
10 3 (1.23%) Data Protection Act
10 3 (1.23%) Reference Data
11 2 (0.82%) EPoS
11 2 (0.82%) OTC Derivatives
11 2 (0.82%) Reinsurance
12 1 (0.41%) Public Cloud
Operating Systems
1 14 (5.76%) Windows
2 7 (2.88%) Unix
3 4 (1.65%) Linux
4 2 (0.82%) Windows 7
5 1 (0.41%) Android
5 1 (0.41%) Apple iOS
5 1 (0.41%) Windows 10
5 1 (0.41%) Windows Server
Processes & Methodologies
1 87 (35.80%) Agile
2 69 (28.40%) Problem-Solving
3 49 (20.16%) Migration
4 44 (18.11%) Business Analysis
5 38 (15.64%) Test Automation
6 35 (14.40%) Business Intelligence
7 33 (13.58%) Analytics
7 33 (13.58%) Stakeholder Management
7 33 (13.58%) System Integration Testing
8 29 (11.93%) Validation
9 28 (11.52%) DevOps
10 27 (11.11%) Asset Management
11 26 (10.70%) Quantitative Research
12 24 (9.88%) Portfolio Management
13 23 (9.47%) Data Migration
13 23 (9.47%) Project Management
14 22 (9.05%) Integration Testing
14 22 (9.05%) Investment Management
14 22 (9.05%) Waterfall
15 21 (8.64%) User Stories
Programming Languages
1 58 (23.87%) SQL
2 21 (8.64%) Python
3 13 (5.35%) C#
4 9 (3.70%) ABAP
4 9 (3.70%) PL/SQL
5 7 (2.88%) Java
6 5 (2.06%) JavaScript
7 4 (1.65%) VB
8 3 (1.23%) PowerShell
9 1 (0.41%) Bash
9 1 (0.41%) Data Analysis Expressions
9 1 (0.41%) F#
9 1 (0.41%) PeopleCode
9 1 (0.41%) RPG
9 1 (0.41%) RPG IV
9 1 (0.41%) Ruby
9 1 (0.41%) Shell Script
9 1 (0.41%) SOQL
Qualifications
1 31 (12.76%) Security Cleared
2 30 (12.35%) Degree
3 29 (11.93%) SC Cleared
4 9 (3.70%) PMI Certification
5 7 (2.88%) ISTQB
6 4 (1.65%) BPSS Clearance
6 4 (1.65%) PMP
7 3 (1.23%) Computer Science Degree
7 3 (1.23%) ISTQB Advanced Certification
8 2 (0.82%) CTC Cleared
9 1 (0.41%) AAT
9 1 (0.41%) ACCA
9 1 (0.41%) CCNP
9 1 (0.41%) CIMA
9 1 (0.41%) Cisco Certification
9 1 (0.41%) ISEB
9 1 (0.41%) ISTQB Foundation Certification
9 1 (0.41%) MBA
9 1 (0.41%) Network+ Certification
9 1 (0.41%) SAP Certification
Quality Assurance & Compliance
1 45 (18.52%) QA
2 5 (2.06%) Data Quality
3 4 (1.65%) PMO
4 3 (1.23%) GDPR
4 3 (1.23%) IFRS
5 2 (0.82%) GAAP
5 2 (0.82%) GxP
5 2 (0.82%) MiFID
6 1 (0.41%) Accessibility
6 1 (0.41%) Disclosure Scotland
6 1 (0.41%) EMIR
6 1 (0.41%) HIPAA
6 1 (0.41%) IFRS 9
6 1 (0.41%) PCI DSS
6 1 (0.41%) Sarbanes-Oxley
6 1 (0.41%) SOC 2
System Software
1 3 (1.23%) Docker
1 3 (1.23%) Microsoft App-V
2 1 (0.41%) VMware Infrastructure
Systems Management
1 6 (2.47%) HP ALM
2 4 (1.65%) Ansible
2 4 (1.65%) SCCM
3 3 (1.23%) Kubernetes
3 3 (1.23%) Microsoft Intune
4 2 (0.82%) Grafana
4 2 (0.82%) Progress Chef
4 2 (0.82%) Prometheus
4 2 (0.82%) Terraform
5 1 (0.41%) CEMLI
5 1 (0.41%) HP Quality Center
5 1 (0.41%) Oracle Enterprise Manager
5 1 (0.41%) Puppet
5 1 (0.41%) Single Sign-On
Vendors
1 46 (18.93%) SAP
2 35 (14.40%) Microsoft
3 34 (13.99%) Oracle
4 17 (7.00%) BISAM
5 14 (5.76%) Salesforce
6 9 (3.70%) ION Trading
7 7 (2.88%) ServiceNow
8 6 (2.47%) HP
8 6 (2.47%) Workday
9 5 (2.06%) Citrix
10 4 (1.65%) Broadcom
10 4 (1.65%) Google
11 3 (1.23%) Adobe
11 3 (1.23%) SimCorp
11 3 (1.23%) Snow
11 3 (1.23%) UiPath
12 2 (0.82%) Cisco
12 2 (0.82%) MuleSoft
12 2 (0.82%) Murex
12 2 (0.82%) Palo Alto