Process Improvement Contracts with Hybrid/Remote/WFH Options

Process Improvement
UK > Work from Home

The table below provides summary statistics for remote or hybrid contract work requiring Process Improvement skills. It includes a benchmarking guide to the contractor rates offered in vacancies that cited Process Improvement over the 6 months leading up to 1 May 2025, comparing them to the same period in the previous two years.

6 months to
1 May 2025
Same period 2024 Same period 2023
Rank 115 163 204
Rank change year-on-year +48 +41 +4
Contract jobs citing Process Improvement 225 196 316
As % of all contract jobs with a WFH option 2.27% 1.28% 1.22%
As % of the Processes & Methodologies category 2.49% 1.45% 1.36%
Number of daily rates quoted 161 119 223
10th Percentile £315 £356 £376
25th Percentile £402 £437 £438
Median daily rate (50th Percentile) £500 £525 £500
Median % change year-on-year -4.76% +5.00% -
75th Percentile £588 £594 £575
90th Percentile £730 £730 £655
UK median daily rate £500 £513 £525
% change year-on-year -2.44% -2.38% +3.96%
Number of hourly rates quoted 7 9 4
10th Percentile £28.00 - £37.80
25th Percentile £54.20 £15.85 £47.25
Median hourly rate £75.00 £30.12 £57.50
Median % change year-on-year +149.00% -47.62% +156.70%
75th Percentile £83.75 £35.00 £60.00
90th Percentile £92.50 £45.30 -
UK median hourly rate £32.81 £26.75 £43.93
% change year-on-year +22.65% -39.11% -2.38%

All Process and Methodology Skills
Work from Home

Process Improvement falls under the Processes and Methodologies category. For comparison with the information above, the following table provides summary statistics for all contract job vacancies with remote or hybrid options requiring process or methodology skills.

Contract vacancies with a requirement for process or methodology skills 9,021 13,483 23,229
As % of all contract jobs with a WFH option 91.08% 87.87% 89.84%
Number of daily rates quoted 6,191 8,996 16,418
10th Percentile £340 £325 £363
25th Percentile £419 £425 £450
Median daily rate (50th Percentile) £525 £525 £540
Median % change year-on-year - -2.78% +2.86%
75th Percentile £638 £638 £650
90th Percentile £763 £750 £750
UK median daily rate £520 £525 £550
% change year-on-year -0.95% -4.55% +4.76%
Number of hourly rates quoted 224 579 532
10th Percentile £14.20 £15.17 £19.00
25th Percentile £19.56 £25.25 £30.54
Median hourly rate £39.52 £43.00 £55.00
Median % change year-on-year -8.09% -21.82% +57.14%
75th Percentile £66.13 £60.00 £68.75
90th Percentile £75.00 £75.25 £80.23
UK median hourly rate £29.00 £35.65 £37.30
% change year-on-year -18.65% -4.42% +49.20%

Process Improvement
Trend for Jobs with a WFH Option

Job vacancies with remote working options citing Process Improvement as a proportion of all IT jobs advertised.
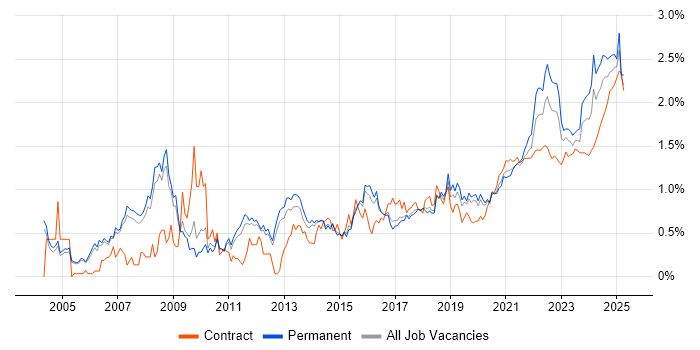
Process Improvement trend for jobs with Hybrid/Remote/WFH options

Process Improvement
Daily Rate Trend for Jobs with a WFH Option

3-month moving average daily rate quoted in job vacancies with remote working options citing Process Improvement.

Process Improvement daily rate for jobs with a WFH option

Process Improvement
Daily Rate Histogram for Jobs with a WFH Option

Daily rate distribution for jobs with remote working options citing Process Improvement over the 6 months to 1 May 2025.

Process Improvement daily rate histogram for jobs with a WFH option

Process Improvement
Hourly Rate Trend for Jobs with a WFH Option

3-month moving average hourly rate quoted in job vacancies with remote working options citing Process Improvement.

Process Improvement hourly rate for jobs with a WFH option

Process Improvement
Hourly Rate Histogram for Jobs with a WFH Option

Hourly rate distribution for jobs with remote working options citing Process Improvement over the 6 months to 1 May 2025.

Process Improvement hourly rate histogram for jobs with a WFH option

Process Improvement
Co-occurring Skills and Capabilities with WFH Options by Category

The follow tables expand on the table above by listing co-occurrences grouped by category. The same employment type, locality and period is covered with up to 20 co-occurrences shown in each of the following categories:

Application Platforms
1 13 (5.78%) Confluence
2 5 (2.22%) SharePoint
3 3 (1.33%) Apache Spark
4 2 (0.89%) JBoss
4 2 (0.89%) WebSphere
4 2 (0.89%) WebSphere Application Server
5 1 (0.44%) Microsoft Exchange
5 1 (0.44%) SAS
5 1 (0.44%) ThingWorx
Applications
1 14 (6.22%) Microsoft Excel
2 5 (2.22%) Microsoft Office
2 5 (2.22%) Microsoft Project
2 5 (2.22%) MS Visio
3 3 (1.33%) Spreadsheet
4 2 (0.89%) Microsoft PowerPoint
4 2 (0.89%) Trello
5 1 (0.44%) Fusion 360
5 1 (0.44%) Siemens NX
Business Applications
1 13 (5.78%) SAP S/4HANA
2 5 (2.22%) Dynamics CRM
3 3 (1.33%) Workday HCM
4 2 (0.89%) Teamcenter
5 1 (0.44%) Actimize
5 1 (0.44%) Endur
5 1 (0.44%) IBM Planning Analytics
5 1 (0.44%) Oracle Financials
5 1 (0.44%) Oracle General Ledger
5 1 (0.44%) Oracle Payables
5 1 (0.44%) Oracle Procure-to-Pay
5 1 (0.44%) Remedy ITSM
5 1 (0.44%) Salesforce CRM
5 1 (0.44%) SAP EHS
5 1 (0.44%) SAP GRC
5 1 (0.44%) SAP MDG
5 1 (0.44%) SAP Oil and Gas
5 1 (0.44%) SAP PP
5 1 (0.44%) SAP SD
5 1 (0.44%) Shopify
Cloud Services
1 29 (12.89%) AWS
2 22 (9.78%) Azure
3 14 (6.22%) Power Platform
4 5 (2.22%) Entra ID
4 5 (2.22%) Microsoft 365
4 5 (2.22%) PowerApps
5 4 (1.78%) Amazon S3
5 4 (1.78%) Dynamics 365
5 4 (1.78%) GCP
6 3 (1.33%) Amazon EKS
6 3 (1.33%) AWS CloudFormation
6 3 (1.33%) AWS Lambda
6 3 (1.33%) Azure DevOps
6 3 (1.33%) Power Automate
6 3 (1.33%) SaaS
6 3 (1.33%) Serverless
6 3 (1.33%) SuccessFactors
7 2 (0.89%) Cloud Computing
7 2 (0.89%) Datadog
7 2 (0.89%) GitHub
Communications & Networking
1 3 (1.33%) SSL
2 2 (0.89%) Firewall
2 2 (0.89%) HTTPS
2 2 (0.89%) SSH
3 1 (0.44%) FTP
3 1 (0.44%) Intrusion Detection
3 1 (0.44%) Network Security
3 1 (0.44%) TCP/IP
3 1 (0.44%) Wireshark
Database & Business Intelligence
1 12 (5.33%) Power BI
2 10 (4.44%) SAP HANA
3 7 (3.11%) Tableau
4 5 (2.22%) MySQL
4 5 (2.22%) PostgreSQL
5 4 (1.78%) MongoDB
5 4 (1.78%) Relational Database
5 4 (1.78%) SQL Server
6 3 (1.33%) Big Data
6 3 (1.33%) Looker
6 3 (1.33%) NoSQL
7 2 (0.89%) Amazon Athena
7 2 (0.89%) Data Mining
7 2 (0.89%) DB2
7 2 (0.89%) Hadoop
7 2 (0.89%) IMS/DB
7 2 (0.89%) MS Access
7 2 (0.89%) SQL Server Integration Services
8 1 (0.44%) Oracle Reports
8 1 (0.44%) RDBMS
Development Applications
1 24 (10.67%) JIRA
2 7 (3.11%) Jenkins
3 6 (2.67%) Git
4 4 (1.78%) GitLab
5 2 (0.89%) Bitbucket
5 2 (0.89%) Gradle
5 2 (0.89%) SonarQube
5 2 (0.89%) Toad
6 1 (0.44%) CircleCI
6 1 (0.44%) IntelliJ
6 1 (0.44%) JMeter
6 1 (0.44%) JProfiler
6 1 (0.44%) LoadRunner
6 1 (0.44%) Mockito
6 1 (0.44%) Selenium
6 1 (0.44%) Subversion
6 1 (0.44%) Zephyr
General
1 98 (43.56%) Social Skills
2 74 (32.89%) Finance
3 52 (23.11%) Analytical Skills
4 21 (9.33%) Public Sector
5 20 (8.89%) Banking
6 15 (6.67%) Pharmaceutical
7 12 (5.33%) Inclusion and Diversity
8 11 (4.89%) Presentation Skills
9 9 (4.00%) Organisational Skills
9 9 (4.00%) Telecoms
10 7 (3.11%) Legal
10 7 (3.11%) Manufacturing
10 7 (3.11%) Marketing
11 6 (2.67%) Influencing Skills
11 6 (2.67%) Retail
12 5 (2.22%) Billing
12 5 (2.22%) Retail Banking
13 4 (1.78%) Investment Banking
14 3 (1.33%) Automotive
14 3 (1.33%) Law
Job Titles
1 69 (30.67%) Analyst
2 39 (17.33%) Business Analyst
3 26 (11.56%) Developer
4 19 (8.44%) Senior
5 16 (7.11%) Consultant
6 14 (6.22%) Lead
7 12 (5.33%) Project Manager
8 10 (4.44%) ABAP Developer
8 10 (4.44%) SAP Developer
9 9 (4.00%) Architect
10 8 (3.56%) Data Analyst
11 7 (3.11%) React Developer
11 7 (3.11%) Senior Analyst
12 6 (2.67%) Java Developer
12 6 (2.67%) SAP Consultant
13 5 (2.22%) Delivery Manager
13 5 (2.22%) Process Analyst
13 5 (2.22%) Software Engineer
13 5 (2.22%) Systems Analyst
13 5 (2.22%) Technical Analyst
Libraries, Frameworks & Software Standards
1 15 (6.67%) Web Services
2 10 (4.44%) BAPI
2 10 (4.44%) Spring
2 10 (4.44%) Spring Boot
3 9 (4.00%) React
4 7 (3.11%) REST
5 4 (1.78%) .NET
6 3 (1.33%) AWS CDK
6 3 (1.33%) JSON
6 3 (1.33%) Symfony
7 2 (0.89%) .NET Core
7 2 (0.89%) ASP.NET
7 2 (0.89%) ASP.NET Core
7 2 (0.89%) EJB
7 2 (0.89%) HTML
7 2 (0.89%) J2EE
7 2 (0.89%) OAuth
7 2 (0.89%) RESTful
7 2 (0.89%) XML
7 2 (0.89%) XSLT
Miscellaneous
1 13 (5.78%) Management Information System
2 7 (3.11%) Operational Technology
2 7 (3.11%) Product Ownership
3 4 (1.78%) Data Protection Act
3 4 (1.78%) Derivative
3 4 (1.78%) Onboarding
4 3 (1.33%) CMDB
4 3 (1.33%) Frameworx
4 3 (1.33%) PMI
4 3 (1.33%) TM Forum
5 2 (0.89%) Algorithms
5 2 (0.89%) Analytical Mindset
5 2 (0.89%) Data Structures
5 2 (0.89%) Enterprise Software
5 2 (0.89%) Equities
5 2 (0.89%) Fixed Income
5 2 (0.89%) Foreign Exchange (FX)
5 2 (0.89%) Low-Code
5 2 (0.89%) Self-Motivation
5 2 (0.89%) Virtual Team
Operating Systems
1 10 (4.44%) Windows
2 8 (3.56%) Unix
3 6 (2.67%) Linux
4 1 (0.44%) Red Hat Enterprise Linux
4 1 (0.44%) Windows Server
4 1 (0.44%) Windows Server 2008
4 1 (0.44%) Windows Server 2019
Processes & Methodologies
1 63 (28.00%) Agile
1 63 (28.00%) Stakeholder Management
2 62 (27.56%) Problem-Solving
3 38 (16.89%) Project Management
4 27 (12.00%) Decision-Making
5 26 (11.56%) Data Analysis
6 24 (10.67%) Change Management
6 24 (10.67%) Project Delivery
7 23 (10.22%) ITIL
8 22 (9.78%) CI/CD
8 22 (9.78%) DevOps
9 19 (8.44%) Continuous Improvement
10 18 (8.00%) Requirements Gathering
11 17 (7.56%) Stakeholder Engagement
12 16 (7.11%) Analytics
12 16 (7.11%) Business Intelligence
12 16 (7.11%) Regulatory Compliance
13 15 (6.67%) Risk Management
14 14 (6.22%) Business Analysis
15 13 (5.78%) Software Engineering
Programming Languages
1 27 (12.00%) SQL
2 18 (8.00%) Java
3 11 (4.89%) Python
4 10 (4.44%) ABAP
5 6 (2.67%) TypeScript
6 4 (1.78%) PowerShell
6 4 (1.78%) R
7 3 (1.33%) Bash
7 3 (1.33%) PHP
7 3 (1.33%) PL/SQL
8 2 (0.89%) ActionScript
8 2 (0.89%) ActionScript 2.0
8 2 (0.89%) C#
8 2 (0.89%) JavaScript
8 2 (0.89%) REXX
8 2 (0.89%) T-SQL
9 1 (0.44%) Apex Code
9 1 (0.44%) Go
9 1 (0.44%) Groovy
9 1 (0.44%) Scala
Qualifications
1 41 (18.22%) Security Cleared
2 31 (13.78%) Degree
3 29 (12.89%) SC Cleared
4 15 (6.67%) BPSS Clearance
5 9 (4.00%) DV Cleared
5 9 (4.00%) PMP
6 8 (3.56%) ITIL Certification
6 8 (3.56%) PMI Certification
7 7 (3.11%) Computer Science Degree
8 4 (1.78%) Microsoft Certification
9 3 (1.33%) CBAP
10 2 (0.89%) ACCA
10 2 (0.89%) CTC Cleared
11 1 (0.44%) CIMA
11 1 (0.44%) CISA
11 1 (0.44%) CISSP
11 1 (0.44%) IIBA
11 1 (0.44%) ISTQB
11 1 (0.44%) SAP Certification
11 1 (0.44%) SAS Certification
Quality Assurance & Compliance
1 8 (3.56%) SLA
2 7 (3.11%) Data Quality
2 7 (3.11%) QA
2 7 (3.11%) Sarbanes-Oxley
3 5 (2.22%) Accessibility
3 5 (2.22%) Actionable Recommendations
3 5 (2.22%) PMO
4 4 (1.78%) EMIR
4 4 (1.78%) GDPR
4 4 (1.78%) MiFID
5 2 (0.89%) Dodd-Frank
5 2 (0.89%) Government Security Classifications
6 1 (0.44%) COREP
6 1 (0.44%) Cyber Essentials
6 1 (0.44%) GRC
6 1 (0.44%) HAZOP
6 1 (0.44%) ISO 13485
6 1 (0.44%) ISO/IEC 27001
6 1 (0.44%) NCSC
6 1 (0.44%) NIST
System Software
1 10 (4.44%) Docker
2 7 (3.11%) Active Directory
3 2 (0.89%) RACF
4 1 (0.44%) VMware Infrastructure
Systems Management
1 15 (6.67%) Terraform
2 8 (3.56%) Kubernetes
3 3 (1.33%) Ansible
3 3 (1.33%) Grafana
3 3 (1.33%) Prometheus
4 1 (0.44%) Argo
4 1 (0.44%) Consul
4 1 (0.44%) Istio
4 1 (0.44%) linkerd
4 1 (0.44%) Opsview
4 1 (0.44%) Progress Chef
4 1 (0.44%) QRadar
4 1 (0.44%) SCCM
Vendors
1 39 (17.33%) SAP
2 19 (8.44%) Microsoft
3 17 (7.56%) ServiceNow
4 16 (7.11%) Oracle
5 12 (5.33%) Salesforce
6 8 (3.56%) IBM
7 6 (2.67%) VMware
8 5 (2.22%) Atlassian
8 5 (2.22%) Workday
9 4 (1.78%) CyberArk
9 4 (1.78%) MuleSoft
10 2 (0.89%) Alteryx
10 2 (0.89%) Ariba
10 2 (0.89%) Google
10 2 (0.89%) IBM Sterling
10 2 (0.89%) Siemens
10 2 (0.89%) Splunk
11 1 (0.44%) BMC
11 1 (0.44%) Hitachi
11 1 (0.44%) Hyperion