SaaS Jobs in the City of London

Software as a Service (SaaS)
Central London > City of London

The following table provides summary statistics for permanent job vacancies advertised in the City of London with a requirement for SaaS skills. Included is a benchmarking guide to the salaries offered in vacancies that have cited SaaS over the 6 months to 7 May 2024 with a comparison to the same period in the previous 2 years.

6 months to
7 May 2024
Same period 2023 Same period 2022
Rank 48 38 66
Rank change year-on-year -10 +28 +2
Permanent jobs citing SaaS 166 331 309
As % of all permanent jobs advertised in the City of London 4.97% 7.15% 4.33%
As % of the Cloud Services category 9.61% 13.12% 9.50%
Number of salaries quoted 126 251 291
10th Percentile £55,000 £52,500 £49,750
25th Percentile £72,500 £62,500 £57,000
Median annual salary (50th Percentile) £93,750 £80,500 £72,500
Median % change year-on-year +16.46% +11.03% +3.57%
75th Percentile £105,313 £100,000 £95,000
90th Percentile £112,500 £103,750 £110,000
Central London median annual salary £90,000 £80,500 £70,000
% change year-on-year +11.80% +15.00% -

All Cloud Skills
City of London

SaaS is in the Cloud Services category. The following table is for comparison with the above and provides summary statistics for all permanent job vacancies advertised in the City of London with a requirement for cloud computing skills.

Permanent vacancies with a requirement for cloud computing skills 1,728 2,523 3,251
As % of all permanent jobs advertised in the City of London 51.71% 54.50% 45.58%
Number of salaries quoted 1,403 2,120 2,809
10th Percentile £41,250 £42,444 £43,150
25th Percentile £56,250 £55,000 £56,250
Median annual salary (50th Percentile) £75,000 £75,000 £75,000
Median % change year-on-year - - +3.45%
75th Percentile £95,000 £95,000 £95,000
90th Percentile £112,500 £110,000 £110,000
Central London median annual salary £75,000 £75,000 £72,500
% change year-on-year - +3.45% -

SaaS
Job Vacancy Trend in the City of London

Job postings citing SaaS as a proportion of all IT jobs advertised in the City of London.
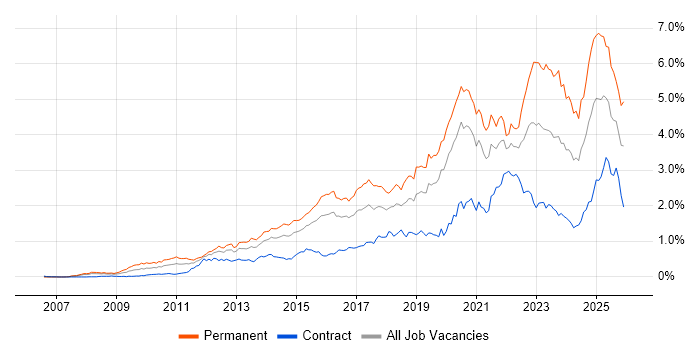
Job vacancy trend for SaaS in the City of London

SaaS
Salary Trend in the City of London

3-month moving average salary quoted in jobs citing SaaS in the City of London.

Salary trend for SaaS in the City of London

SaaS
Salary Histogram in the City of London

Salary distribution for jobs citing SaaS in the City of London over the 6 months to 7 May 2024.

Salary histogram for SaaS in the City of London

SaaS
Co-occurring Skills and Capabilities in the City of London by Category

The follow tables expand on the table above by listing co-occurrences grouped by category. The same employment type, locality and period is covered with up to 20 co-occurrences shown in each of the following categories:

Application Platforms
1 15 (9.04%) Microsoft Exchange
2 3 (1.81%) IIS
2 3 (1.81%) SharePoint
3 1 (0.60%) Tomcat
Applications
1 5 (3.01%) Microsoft Excel
2 3 (1.81%) Microsoft Office
3 1 (0.60%) Microsoft PowerPoint
Business Applications
1 2 (1.20%) Dynamics NAV
2 1 (0.60%) SAP Business One
2 1 (0.60%) SAP ERP
2 1 (0.60%) SAP IBP
2 1 (0.60%) SAP S/4HANA
Cloud Services
1 74 (44.58%) Azure
2 53 (31.93%) AWS
3 31 (18.67%) PaaS
4 22 (13.25%) IaaS
5 21 (12.65%) GCP
6 18 (10.84%) Entra ID
6 18 (10.84%) Microsoft 365
7 14 (8.43%) AWS CloudFormation
8 12 (7.23%) Azure AKS
9 11 (6.63%) AWS Lambda
9 11 (6.63%) Serverless
10 10 (6.02%) Amazon EKS
10 10 (6.02%) Amazon S3
10 10 (6.02%) AWS Fargate
10 10 (6.02%) GitHub
10 10 (6.02%) WhatsApp
11 9 (5.42%) Amazon ECS
11 9 (5.42%) Amazon SQS
11 9 (5.42%) Azure Functions
11 9 (5.42%) Cloudflare
Communications & Networking
1 7 (4.22%) WAN
2 6 (3.61%) SD-WAN
2 6 (3.61%) Wi-Fi
3 5 (3.01%) VPN
4 4 (2.41%) Firewall
4 4 (2.41%) LAN
5 3 (1.81%) BGP
5 3 (1.81%) HSRP
5 3 (1.81%) Network Security
5 3 (1.81%) OSPF
5 3 (1.81%) SAN
5 3 (1.81%) Unified Communications
6 2 (1.20%) Internet
6 2 (1.20%) SSL
6 2 (1.20%) TCP/IP
Database & Business Intelligence
1 16 (9.64%) SQL Server
2 6 (3.61%) RDBMS
2 6 (3.61%) Relational Database
3 5 (3.01%) PostgreSQL
4 4 (2.41%) SQL Server Integration Services
5 3 (1.81%) Amazon RDS
5 3 (1.81%) MySQL
5 3 (1.81%) NoSQL
5 3 (1.81%) Oracle Database
5 3 (1.81%) Oracle Reports
5 3 (1.81%) SQL Server Reporting Services
5 3 (1.81%) SQLite
6 2 (1.20%) Big Data
6 2 (1.20%) Elasticsearch
6 2 (1.20%) Geospatial Data
6 2 (1.20%) GIS
7 1 (0.60%) Azure SQL Database
7 1 (0.60%) Data Lake
7 1 (0.60%) Data Warehouse
7 1 (0.60%) SAP HANA
Development Applications
1 40 (24.10%) Jenkins
2 32 (19.28%) Cucumber
3 30 (18.07%) Postman
4 23 (13.86%) Selenium
5 16 (9.64%) Git
6 13 (7.83%) Cypress.io
7 10 (6.02%) GitLab
8 3 (1.81%) Team Foundation Server
8 3 (1.81%) Visual Studio
9 2 (1.20%) JIRA
9 2 (1.20%) Visual Studio Code
10 1 (0.60%) Bitbucket
10 1 (0.60%) SoapUI
10 1 (0.60%) Terragrunt
General
1 36 (21.69%) Social Skills
2 29 (17.47%) Finance
3 26 (15.66%) Analytical Skills
4 10 (6.02%) Automotive
5 8 (4.82%) Law
5 8 (4.82%) Presentation Skills
5 8 (4.82%) Retail
6 7 (4.22%) Marketing
7 6 (3.61%) Health Technology
7 6 (3.61%) Legal
8 5 (3.01%) Documentation Skills
8 5 (3.01%) Pharmaceutical
9 4 (2.41%) Advertising
9 4 (2.41%) Games
9 4 (2.41%) Inclusion and Diversity
10 3 (1.81%) Banking
10 3 (1.81%) Billing
10 3 (1.81%) Japanese Language
11 2 (1.20%) Telecoms
12 1 (0.60%) Financial Institution
Job Titles
1 56 (33.73%) Senior
2 37 (22.29%) Lead
3 21 (12.65%) Architect
4 14 (8.43%) Support Engineer
5 13 (7.83%) Infrastructure Engineer
6 11 (6.63%) Cloud Architect
6 11 (6.63%) Senior Infrastructure Engineer
7 10 (6.02%) Infrastructure Support
7 10 (6.02%) Infrastructure Support Engineer
7 10 (6.02%) Senior Infrastructure Support Engineer
7 10 (6.02%) Senior Support Engineer
8 9 (5.42%) Consultant
9 7 (4.22%) Applications Support
9 7 (4.22%) Software Engineer
10 6 (3.61%) Azure Engineer
10 6 (3.61%) Platform Engineer
11 5 (3.01%) AWS DevOps
11 5 (3.01%) Cloud Engineer
11 5 (3.01%) Senior Platform Engineer
11 5 (3.01%) Technical Consultant
Libraries, Frameworks & Software Standards
1 36 (21.69%) REST
2 19 (11.45%) .NET
3 14 (8.43%) JSON
4 13 (7.83%) React
5 11 (6.63%) WebdriverIO
6 8 (4.82%) Node.js
6 8 (4.82%) XML
7 7 (4.22%) RESTful
8 6 (3.61%) Web Services
9 4 (2.41%) .NET Core
9 4 (2.41%) ASP.NET
9 4 (2.41%) FastAPI
9 4 (2.41%) jQuery
9 4 (2.41%) Playwright
9 4 (2.41%) SAML
10 3 (1.81%) .NET Framework
10 3 (1.81%) Next.js
10 3 (1.81%) OAuth
10 3 (1.81%) XSD
11 2 (1.20%) XSLT
Miscellaneous
1 18 (10.84%) Self-Motivation
2 14 (8.43%) Public Cloud
3 9 (5.42%) Mobile App
4 7 (4.22%) PKI
5 6 (3.61%) Analytical Mindset
6 5 (3.01%) Cloud Native
6 5 (3.01%) Life Science
7 4 (2.41%) Enterprise Software
7 4 (2.41%) Foreign Exchange (FX)
7 4 (2.41%) Management Information System
7 4 (2.41%) Media Streaming
8 3 (1.81%) Biopharmaceutical
8 3 (1.81%) Driving Licence
8 3 (1.81%) Learning Management System
8 3 (1.81%) LIMS
8 3 (1.81%) Onboarding
8 3 (1.81%) Social Media
9 2 (1.20%) Clustering
9 2 (1.20%) Data Centre
9 2 (1.20%) Replication
Operating Systems
1 23 (13.86%) Windows
2 17 (10.24%) Windows Server
3 10 (6.02%) Windows Server 2012
4 4 (2.41%) Linux
5 2 (1.20%) VMS
6 1 (0.60%) Unix
Processes & Methodologies
1 46 (27.71%) CI/CD
2 37 (22.29%) Problem-Solving
3 36 (21.69%) Clean Code
4 35 (21.08%) SDET
5 32 (19.28%) API Testing
6 31 (18.67%) Test Strategy
7 30 (18.07%) BDD
8 29 (17.47%) Agile
9 24 (14.46%) Software Engineering
10 22 (13.25%) DevOps
11 17 (10.24%) Microservices
12 16 (9.64%) Computer Science
13 15 (9.04%) Infrastructure Engineering
13 15 (9.04%) Project Management
13 15 (9.04%) Roadmaps
14 14 (8.43%) Migration
15 13 (7.83%) Test Automation
15 13 (7.83%) TOGAF
16 12 (7.23%) B2B
16 12 (7.23%) DevSecOps
Programming Languages
1 37 (22.29%) Java
2 28 (16.87%) SQL
3 22 (13.25%) JavaScript
4 21 (12.65%) Python
5 14 (8.43%) C#
6 10 (6.02%) TypeScript
7 7 (4.22%) PowerShell
8 6 (3.61%) T-SQL
9 5 (3.01%) Go
10 4 (2.41%) C++
10 4 (2.41%) PHP
10 4 (2.41%) Ruby
11 3 (1.81%) PL/SQL
12 2 (1.20%) Bicep
12 2 (1.20%) Scala
12 2 (1.20%) XPath
13 1 (0.60%) Bash
13 1 (0.60%) Shell Script
Qualifications
1 24 (14.46%) Degree
2 12 (7.23%) Computer Science Degree
3 9 (5.42%) Master's Degree
4 7 (4.22%) AWS Certification
5 4 (2.41%) Security Cleared
6 3 (1.81%) Azure Certification
7 2 (1.20%) PMI Certification
7 2 (1.20%) SC Cleared
7 2 (1.20%) TOGAF Certification
8 1 (0.60%) MBA
8 1 (0.60%) PMP
8 1 (0.60%) PRINCE2 Certification
Quality Assurance & Compliance
1 34 (20.48%) QA
2 2 (1.20%) ISO/IEC 27001
2 2 (1.20%) PMO
3 1 (0.60%) PCI DSS
3 1 (0.60%) SLA
System Software
1 19 (11.45%) Active Directory
2 16 (9.64%) Docker
3 11 (6.63%) VMware Infrastructure
4 10 (6.02%) VMware ESXi
5 9 (5.42%) Virtual Machines
6 1 (0.60%) XenApp
Systems Management
1 21 (12.65%) Kubernetes
2 17 (10.24%) Terraform
3 10 (6.02%) vCenter Server
4 3 (1.81%) Active Directory Federation Services
4 3 (1.81%) FortiGate
5 2 (1.20%) Ansible
5 2 (1.20%) Failover Clustering
5 2 (1.20%) Foglight
6 1 (0.60%) Microsoft Intune
Vendors
1 37 (22.29%) Microsoft
2 12 (7.23%) VMware
3 10 (6.02%) Google
4 9 (5.42%) ForgeRock
4 9 (5.42%) Sitecore
5 7 (4.22%) Oracle
6 6 (3.61%) Cisco
7 3 (1.81%) Meraki
8 2 (1.20%) AppDynamics
8 2 (1.20%) Apple
8 2 (1.20%) IDERA
8 2 (1.20%) SAP
8 2 (1.20%) Sparx
9 1 (0.60%) Aderant
9 1 (0.60%) Citrix
9 1 (0.60%) Dell
9 1 (0.60%) iManage
9 1 (0.60%) Intapp
9 1 (0.60%) Qualys
9 1 (0.60%) Salesforce