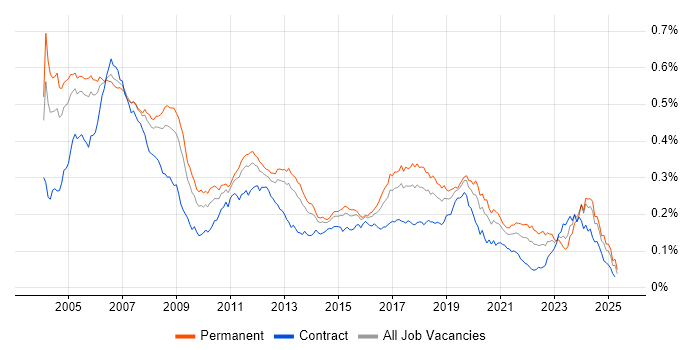
Embedded C Jobs in England

Embedded C
UK > England

The table below provides summary statistics for permanent job vacancies advertised in England requiring Embedded C skills. It includes a benchmarking guide to the annual salaries offered in vacancies that cited Embedded C over the 6 months leading up to 26 July 2024, comparing them to the same period in the previous two years.

6 months to
26 Jul 2024
Same period 2023 Same period 2022
Rank 598 751 995
Rank change year-on-year +153 +244 -177
Permanent jobs citing Embedded C 205 83 195
As % of all permanent jobs advertised in England 0.26% 0.12% 0.13%
As % of the Programming Languages category 0.88% 0.29% 0.26%
Number of salaries quoted 149 51 55
10th Percentile £37,500 £35,000 £33,000
25th Percentile £45,000 £39,500 £37,500
Median annual salary (50th Percentile) £55,000 £53,250 £55,000
Median % change year-on-year +3.29% -3.18% +10.00%
75th Percentile £65,000 £60,625 £62,500
90th Percentile £80,000 £67,500 £76,250
UK median annual salary £52,500 £55,000 £57,500
% change year-on-year -4.55% -4.35% +15.00%

All Programming Languages
England

Embedded C falls under the Programming Languages category. For comparison with the information above, the following table provides summary statistics for all permanent job vacancies requiring coding skills in England.

Permanent vacancies with a requirement for coding skills 23,314 28,657 75,412
As % of all permanent jobs advertised in England 29.75% 40.31% 51.29%
Number of salaries quoted 17,627 21,657 38,997
10th Percentile £36,250 £40,000 £37,500
25th Percentile £45,500 £50,000 £46,250
Median annual salary (50th Percentile) £60,000 £65,000 £62,500
Median % change year-on-year -7.69% +4.00% +8.70%
75th Percentile £82,500 £86,250 £85,000
90th Percentile £102,500 £110,000 £101,250
UK median annual salary £60,000 £65,000 £62,500
% change year-on-year -7.69% +4.00% +8.70%

Embedded C
Job Vacancy Trend in England

Job postings citing Embedded C as a proportion of all IT jobs advertised in England.

Job vacancy trend for Embedded C in England

Embedded C
Salary Trend in England

3-month moving average salary quoted in jobs citing Embedded C in England.

Salary trend for Embedded C in England

Embedded C
Salary Histogram in England

Salary distribution for jobs citing Embedded C in England over the 6 months to 26 July 2024.

Salary histogram for Embedded C in England

Embedded C
Job Locations in England

The table below looks at the demand and provides a guide to the median salaries quoted in IT jobs citing Embedded C within the England region over the 6 months to 26 July 2024. The 'Rank Change' column provides an indication of the change in demand within each location based on the same 6 month period last year.

Location Rank Change
on Same Period
Last Year
Matching
Permanent
IT Job Ads
Median Salary
Past 6 Months
Median Salary
% Change
on Same Period
Last Year
Live
Jobs
South West +49 62 £52,500 +5.00% 8
Midlands +11 56 £50,000 +14.94% 10
South East +20 35 £58,750 +6.82% 8
East Midlands -1 31 £40,000 - 4
East of England +11 28 £60,000 -7.69% 9
West Midlands +2 25 £60,000 +25.00% 6
North of England +19 22 £55,000 -2.22% 14
North West -1 14 £55,000 -4.35% 6
Yorkshire +61 8 £55,000 +29.41% 5
Embedded C
UK

Embedded C
Co-occurring Skills and Capabilities in England by Category

The follow tables expand on the table above by listing co-occurrences grouped by category. The same employment type, locality and period is covered with up to 20 co-occurrences shown in each of the following categories:

Applications
1 15 (7.32%) Simulink
2 8 (3.90%) Stateflow
3 1 (0.49%) Microsoft Excel
3 1 (0.49%) Microsoft Office
3 1 (0.49%) SOLIDWORKS
Business Applications
1 1 (0.49%) SAP Business One
Cloud Services
1 6 (2.93%) AWS
2 5 (2.44%) AWS IoT
3 4 (1.95%) Azure
4 1 (0.49%) GCP
4 1 (0.49%) GitHub
Communications & Networking
1 12 (5.85%) DVB
1 12 (5.85%) Ethernet
2 11 (5.37%) Internet
3 7 (3.41%) Bluetooth
3 7 (3.41%) Wi-Fi
3 7 (3.41%) Wireless
4 6 (2.93%) RS-232
4 6 (2.93%) TCP/IP
5 3 (1.46%) HTTP
5 3 (1.46%) J1939
5 3 (1.46%) LTE
5 3 (1.46%) MQTT
5 3 (1.46%) RS-485
5 3 (1.46%) ZigBee
6 2 (0.98%) LoRaWAN
7 1 (0.49%) FlexRay
7 1 (0.49%) HTTPS
7 1 (0.49%) Network Security
7 1 (0.49%) SNMP
Database & Business Intelligence
1 3 (1.46%) SQLite
2 2 (0.98%) Big Data
2 2 (0.98%) PostgreSQL
3 1 (0.49%) MySQL
Development Applications
1 9 (4.39%) Git
1 9 (4.39%) Subversion
2 8 (3.90%) ClearCase
2 8 (3.90%) Plastic SCM
3 6 (2.93%) Eclipse
3 6 (2.93%) JIRA
4 5 (2.44%) ClearQuest
5 3 (1.46%) Visual Studio
6 2 (0.98%) LabVIEW
7 1 (0.49%) GitLab
7 1 (0.49%) Jenkins
7 1 (0.49%) Team Foundation Server
General
1 65 (31.71%) Electronics
2 40 (19.51%) Social Skills
3 37 (18.05%) Manufacturing
4 27 (13.17%) Automotive
5 16 (7.80%) Telecoms
6 13 (6.34%) Finance
6 13 (6.34%) Marketing
7 12 (5.85%) Aerospace
7 12 (5.85%) Public Sector
8 8 (3.90%) Analytical Skills
9 7 (3.41%) Inclusion and Diversity
10 4 (1.95%) Advertising
10 4 (1.95%) Retail
11 2 (0.98%) Presentation Skills
12 1 (0.49%) Legal
12 1 (0.49%) Pharmaceutical
12 1 (0.49%) Tech for Good
12 1 (0.49%) Wearables
Job Titles
1 168 (81.95%) Embedded Engineer
2 146 (71.22%) Software Engineer
3 135 (65.85%) Embedded Software Engineer
4 57 (27.80%) Senior
5 45 (21.95%) Senior Embedded Engineer
6 44 (21.46%) Senior Software Engineer
7 39 (19.02%) Senior Embedded Software Engineer
8 17 (8.29%) Firmware Engineer
9 16 (7.80%) C Software Engineer
9 16 (7.80%) Embedded C Engineer
9 16 (7.80%) Embedded C Software Engineer
10 15 (7.32%) Design Engineer
11 12 (5.85%) C/C++ Embedded Software Engineer
11 12 (5.85%) C/C++ Software Engineer
11 12 (5.85%) C++ Software Engineer
11 12 (5.85%) Embedded C/C++ Engineer
11 12 (5.85%) Embedded C/C++ Software Engineer
11 12 (5.85%) Embedded C++ Engineer
11 12 (5.85%) Embedded C++ Software Engineer
12 10 (4.88%) Electronics Engineer
Libraries, Frameworks & Software Standards
1 7 (3.41%) Yocto
2 6 (2.93%) HTML
3 5 (2.44%) FFmpeg
3 5 (2.44%) GStreamer
3 5 (2.44%) OpenEmbedded
4 2 (0.98%) Flask
5 1 (0.49%) .NET
5 1 (0.49%) WebSockets
5 1 (0.49%) WinForms
5 1 (0.49%) WPF
Miscellaneous
1 33 (16.10%) Embedded Systems
2 20 (9.76%) Algorithms
3 16 (7.80%) IoT
4 14 (6.83%) FPGA
5 13 (6.34%) Self-Motivation
6 12 (5.85%) VHDL
7 11 (5.37%) ARM Cortex
8 8 (3.90%) Analogue Electronics
9 7 (3.41%) CAN bus
10 5 (2.44%) Device Driver
10 5 (2.44%) Robotics
11 3 (1.46%) Greenfield Project
11 3 (1.46%) Raspberry Pi
12 2 (0.98%) GNSS
12 2 (0.98%) Smart Energy
13 1 (0.49%) Data Structures
13 1 (0.49%) Distributed Systems
13 1 (0.49%) NB-IoT
13 1 (0.49%) Renewable Energy
13 1 (0.49%) RISC-V
Operating Systems
1 107 (52.20%) Linux
2 73 (35.61%) Embedded Linux
3 14 (6.83%) FreeRTOS
4 8 (3.90%) Windows
5 3 (1.46%) Debian
6 2 (0.98%) Unix
7 1 (0.49%) ThreadX
Processes & Methodologies
1 157 (76.59%) Software Engineering
2 48 (23.41%) Cybersecurity
3 33 (16.10%) Software Testing
4 24 (11.71%) Computer Science
5 16 (7.80%) Agile
5 16 (7.80%) Problem-Solving
6 12 (5.85%) Business Intelligence
6 12 (5.85%) Digital Marketing
6 12 (5.85%) Programme Management
7 11 (5.37%) Embedded Software Development
8 9 (4.39%) Configuration Management
8 9 (4.39%) Mentoring
9 8 (3.90%) Continuous Integration
9 8 (3.90%) Schematic Capture
9 8 (3.90%) TDD
10 6 (2.93%) Open Source
10 6 (2.93%) Test Automation
11 5 (2.44%) Device Driver Development
11 5 (2.44%) Integration Testing
11 5 (2.44%) Multithreading
Programming Languages
1 204 (99.51%) C
2 99 (48.29%) C++
3 81 (39.51%) Python
4 54 (26.34%) Embedded C++
5 48 (23.41%) Bash
6 46 (22.44%) Rust
7 16 (7.80%) MATLAB
8 14 (6.83%) C#
9 8 (3.90%) R
10 5 (2.44%) Java
10 5 (2.44%) JavaScript
11 4 (1.95%) Perl
12 3 (1.46%) SQL
13 2 (0.98%) PHP
14 1 (0.49%) PowerShell
14 1 (0.49%) XAML
Qualifications
1 59 (28.78%) Degree
2 53 (25.85%) Security Cleared
3 8 (3.90%) HND
4 6 (2.93%) Computer Science Degree
5 1 (0.49%) DV Cleared
Quality Assurance & Compliance
1 12 (5.85%) MISRA
2 11 (5.37%) AUTOSAR
3 5 (2.44%) QA
4 4 (1.95%) ISO 26262
5 3 (1.46%) Automotive SPICE
6 1 (0.49%) IEC 62304
6 1 (0.49%) SLA
System Software
1 46 (22.44%) Firmware
2 20 (9.76%) Embedded Firmware
3 1 (0.49%) Docker
Systems Management
1 1 (0.49%) Kubernetes
Vendors
1 13 (6.34%) SAP
2 8 (3.90%) IBM
2 8 (3.90%) Lauterbach
3 4 (1.95%) EMC
3 4 (1.95%) Renesas
4 3 (1.46%) Facebook
4 3 (1.46%) Instagram
5 1 (0.49%) Google
5 1 (0.49%) Microsoft
5 1 (0.49%) NVIDIA
5 1 (0.49%) Parasoft