Automotive Jobs in England

Automotive
UK > England

The table below looks at the prevalence of the term Automotive in permanent job vacancies in England. Included is a benchmarking guide to the salaries offered in vacancies that cited Automotive over the 6 months leading up to 31 May 2025, comparing them to the same period in the previous two years.

6 months to
31 May 2025
Same period 2024 Same period 2023
Rank 155 210 182
Rank change year-on-year +55 -28 +52
Permanent jobs citing Automotive 1,035 1,219 1,729
As % of all permanent jobs advertised in England 2.10% 1.36% 2.03%
As % of the General category 3.00% 2.34% 2.99%
Number of salaries quoted 401 702 338
10th Percentile £32,500 £31,250 £35,750
25th Percentile £47,500 £37,938 £45,000
Median annual salary (50th Percentile) £50,055 £50,000 £57,500
Median % change year-on-year +0.11% -13.04% +25.00%
75th Percentile £58,943 £62,250 £77,500
90th Percentile £72,500 £75,000 £85,000
UK median annual salary £50,055 £52,250 £58,750
% change year-on-year -4.20% -11.06% +27.72%

All General Skills
England

Automotive falls under the General Skills category. For comparison with the information above, the following table provides summary statistics for all permanent job vacancies requiring common skills in England.

Permanent vacancies with a requirement for common skills 34,488 52,134 57,770
As % of all permanent jobs advertised in England 69.93% 58.04% 67.83%
Number of salaries quoted 16,095 36,062 32,007
10th Percentile £27,500 £27,500 £32,500
25th Percentile £40,000 £36,250 £43,750
Median annual salary (50th Percentile) £55,565 £52,500 £60,000
Median % change year-on-year +5.84% -12.50% -
75th Percentile £76,250 £72,500 £82,500
90th Percentile £100,000 £95,000 £105,000
UK median annual salary £55,000 £52,500 £60,000
% change year-on-year +4.76% -12.50% -

Automotive
Job Vacancy Trend in England

Job postings citing Automotive as a proportion of all IT jobs advertised in England.
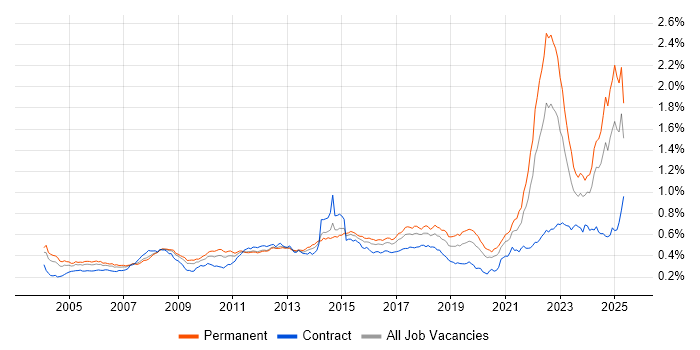
Job vacancy trend for Automotive in England

Automotive
Salary Trend in England

3-month moving average salary quoted in jobs citing Automotive in England.

Salary trend for Automotive in England

Automotive
Salary Histogram in England

Salary distribution for jobs citing Automotive in England over the 6 months to 31 May 2025.

Salary histogram for Automotive in England

Automotive
Job Locations in England

The table below looks at the demand and provides a guide to the median salaries quoted in IT jobs citing Automotive within the England region over the 6 months to 31 May 2025. The 'Rank Change' column provides an indication of the change in demand within each location based on the same 6 month period last year.

Location Rank Change
on Same Period
Last Year
Matching
Permanent
IT Job Ads
Median Salary
Past 6 Months
Median Salary
% Change
on Same Period
Last Year
Live
Jobs
Midlands +41 434 £40,000 -23.81% 196
North of England +111 421 £50,055 +11.23% 84
North West +143 411 £50,055 +11.23% 46
West Midlands +20 297 £43,750 -20.45% 148
East Midlands +66 137 £36,500 -14.12% 48
South East -13 80 £46,374 -15.68% 179
East of England -60 42 £50,000 - 67
South West +41 32 £57,500 +21.05% 84
London +8 26 £73,750 +18.00% 179
Yorkshire -16 8 £57,560 +27.91% 25
North East +18 2 £90,000 +127.85% 14
Automotive
UK

Automotive
Co-occurring Skills and Capabilities in England by Category

The follow tables expand on the table above by listing co-occurrences grouped by category. The same employment type, locality and period is covered with up to 20 co-occurrences shown in each of the following categories:

Application Platforms
1 27 (2.61%) SharePoint
2 9 (0.87%) Microsoft Exchange
3 6 (0.58%) Confluence
4 3 (0.29%) Apache
4 3 (0.29%) CMS
4 3 (0.29%) WordPress
5 2 (0.19%) Apache Spark
5 2 (0.19%) nginx
Applications
1 209 (20.19%) Simulink
2 196 (18.94%) Microsoft Excel
3 193 (18.65%) Microsoft Office
4 176 (17.00%) Microsoft PowerPoint
5 7 (0.68%) Maya
6 4 (0.39%) AutoCAD
6 4 (0.39%) Photoshop
7 3 (0.29%) Adobe XD
7 3 (0.29%) Sketch
8 1 (0.097%) 3ds Max
8 1 (0.097%) Adobe After Effects
8 1 (0.097%) Adobe Creative Suite
8 1 (0.097%) Adobe Illustrator
8 1 (0.097%) Adobe Premiere
8 1 (0.097%) CANalyzer
8 1 (0.097%) CATIA
8 1 (0.097%) Chatbot
8 1 (0.097%) InDesign
8 1 (0.097%) Microsoft Project
8 1 (0.097%) SOLIDWORKS
Business Applications
1 207 (20.00%) Teamcenter
2 7 (0.68%) SAP IBP
2 7 (0.68%) SAP S/4HANA
3 4 (0.39%) Dynamics CRM
4 3 (0.29%) Sage 50
5 1 (0.097%) Dynamics NAV
5 1 (0.097%) Payment Gateway
5 1 (0.097%) Shopify
Cloud Services
1 52 (5.02%) Azure
2 33 (3.19%) AWS
2 33 (3.19%) Power Platform
3 29 (2.80%) Microsoft 365
4 20 (1.93%) SaaS
5 16 (1.55%) PowerApps
6 12 (1.16%) GCP
7 11 (1.06%) Entra ID
7 11 (1.06%) Google Workspace
8 9 (0.87%) Azure DevOps
9 8 (0.77%) Azure Synapse Analytics
10 7 (0.68%) GitHub
10 7 (0.68%) GitHub Actions
11 6 (0.58%) Figma
12 5 (0.48%) Google Analytics
12 5 (0.48%) MailChimp
13 4 (0.39%) Power Automate
13 4 (0.39%) Serverless
13 4 (0.39%) Snowflake
14 3 (0.29%) Amazon EKS
Communications & Networking
1 19 (1.84%) Firewall
2 15 (1.45%) DHCP
2 15 (1.45%) DNS
3 12 (1.16%) TCP/IP
4 11 (1.06%) BGP
4 11 (1.06%) OSPF
4 11 (1.06%) VLAN
4 11 (1.06%) WLAN
5 10 (0.97%) WAN
6 8 (0.77%) Internet
6 8 (0.77%) Remote Desktop
7 7 (0.68%) LAN
7 7 (0.68%) Wi-Fi
8 6 (0.58%) VoIP
9 5 (0.48%) Wireless
10 4 (0.39%) Bluetooth
10 4 (0.39%) SD-WAN
11 3 (0.29%) Ethernet
11 3 (0.29%) FlexRay
12 2 (0.19%) Intranet
Database & Business Intelligence
1 24 (2.32%) Power BI
2 14 (1.35%) Data Warehouse
3 10 (0.97%) Tableau
4 9 (0.87%) Azure SQL Database
5 7 (0.68%) Microsoft Analysis Services
5 7 (0.68%) SAP BW
6 5 (0.48%) MySQL
6 5 (0.48%) NoSQL
7 4 (0.39%) Big Data
7 4 (0.39%) Elasticsearch
7 4 (0.39%) SQL Server
8 3 (0.29%) Redis
9 2 (0.19%) Hadoop
9 2 (0.19%) MongoDB
9 2 (0.19%) SQLite
10 1 (0.097%) Amazon QuickSight
10 1 (0.097%) PostgreSQL
10 1 (0.097%) Snowflake Schema
10 1 (0.097%) SQL Server Analysis Services
10 1 (0.097%) SQL Server Reporting Services
Development Applications
1 13 (1.26%) JIRA
2 10 (0.97%) Git
3 8 (0.77%) GitLab
4 2 (0.19%) Rational DOORS
5 1 (0.097%) Bitbucket
5 1 (0.097%) Burp Suite
5 1 (0.097%) IDA Disassembler
5 1 (0.097%) Jenkins
5 1 (0.097%) JUnit
5 1 (0.097%) LabVIEW
5 1 (0.097%) Metasploit
5 1 (0.097%) NUnit
General
1 523 (50.53%) Aerospace
2 281 (27.15%) Telecoms
3 276 (26.67%) Social Skills
4 72 (6.96%) Aeronautics
5 54 (5.22%) Manufacturing
6 49 (4.73%) Retail
7 41 (3.96%) Finance
8 38 (3.67%) Analytical Skills
9 35 (3.38%) Electronics
10 25 (2.42%) Marketing
11 17 (1.64%) Banking
12 16 (1.55%) Law
13 13 (1.26%) Pharmaceutical
14 12 (1.16%) Publishing
15 11 (1.06%) Legal
16 7 (0.68%) Games
16 7 (0.68%) Influencing Skills
16 7 (0.68%) Presentation Skills
17 6 (0.58%) Advertising
18 5 (0.48%) Dutch Language
Job Titles
1 532 (51.40%) Systems Engineer
2 285 (27.54%) Principal Engineer
3 283 (27.34%) Principal Systems Engineer
4 271 (26.18%) Senior
5 225 (21.74%) Senior Systems Engineer
6 119 (11.50%) Software Engineer
7 100 (9.66%) Development Engineer
8 99 (9.57%) Software Development Engineer
9 64 (6.18%) Principal Software Engineer
10 57 (5.51%) Integration Engineer
10 57 (5.51%) Systems Integration Engineer
11 48 (4.64%) Senior Software Engineer
12 36 (3.48%) Senior Development Engineer
12 36 (3.48%) Senior Integration Engineer
12 36 (3.48%) Senior Software Development Engineer
13 28 (2.71%) Developer
14 21 (2.03%) Technical Support
15 20 (1.93%) IT Support
15 20 (1.93%) Lead
16 19 (1.84%) Analyst
Libraries, Frameworks & Software Standards
1 28 (2.71%) .NET
2 11 (1.06%) .NET Core
2 11 (1.06%) HTML
3 10 (0.97%) CSS
4 7 (0.68%) Entity Framework
4 7 (0.68%) Middleware
4 7 (0.68%) React
5 6 (0.58%) RESTful
6 5 (0.48%) AngularJS
6 5 (0.48%) REST
6 5 (0.48%) Vue
7 4 (0.39%) .NET Framework
7 4 (0.39%) ASP.NET
7 4 (0.39%) Laravel
8 3 (0.29%) CSS3
8 3 (0.29%) Elastic Stack
8 3 (0.29%) HTML5
8 3 (0.29%) LINQ
8 3 (0.29%) RabbitMQ
8 3 (0.29%) Web Services
Miscellaneous
1 18 (1.74%) Renewable Energy
2 17 (1.64%) Product Ownership
3 15 (1.45%) FMCG
3 15 (1.45%) Mobile App
4 14 (1.35%) Social Media
5 12 (1.16%) IoT
6 11 (1.06%) Algorithms
6 11 (1.06%) Management Information System
6 11 (1.06%) Smartphone
7 7 (0.68%) Enterprise Software
7 7 (0.68%) PMI
7 7 (0.68%) Reinsurance
8 6 (0.58%) Digital Signage
8 6 (0.58%) Embedded Systems
8 6 (0.58%) Life Science
9 4 (0.39%) Animation
9 4 (0.39%) Driving Licence
9 4 (0.39%) Infotainment
9 4 (0.39%) Motion Graphics
9 4 (0.39%) Public Cloud
Operating Systems
1 45 (4.35%) Windows
2 26 (2.51%) Linux
3 24 (2.32%) Windows Server
4 14 (1.35%) Windows 10
4 14 (1.35%) Windows Server 2019
5 11 (1.06%) Mac OS X
5 11 (1.06%) Ubuntu
5 11 (1.06%) Windows Server 2016
6 6 (0.58%) Android
7 5 (0.48%) Apple iOS
8 3 (0.29%) Unix
9 2 (0.19%) Embedded Linux
10 1 (0.097%) Kali Linux
10 1 (0.097%) Mac OS
10 1 (0.097%) Windows Server 2012
Processes & Methodologies
1 775 (74.88%) Systems Engineering
2 258 (24.93%) Agile
3 213 (20.58%) Validation
4 207 (20.00%) PLM
4 207 (20.00%) Software Testing
5 185 (17.87%) Model-Based Systems Engineering
6 132 (12.75%) Software Engineering
7 124 (11.98%) Architectural Design
8 99 (9.57%) Project Planning
9 83 (8.02%) Requirements Management
10 74 (7.15%) Coaching
11 72 (6.96%) Physics
12 68 (6.57%) Mathematics
13 60 (5.80%) Problem-Solving
14 40 (3.86%) Analytics
15 29 (2.80%) Continuous Improvement
15 29 (2.80%) Cybersecurity
15 29 (2.80%) Decision-Making
16 27 (2.61%) Mentoring
17 26 (2.51%) Computer Science
Programming Languages
1 415 (40.10%) MATLAB
2 48 (4.64%) SQL
3 30 (2.90%) C#
4 26 (2.51%) PowerShell
5 19 (1.84%) C
5 19 (1.84%) Python
6 12 (1.16%) Embedded C
7 8 (0.77%) C++
7 8 (0.77%) JavaScript
8 7 (0.68%) Data Analysis Expressions
8 7 (0.68%) TypeScript
9 5 (0.48%) PHP
9 5 (0.48%) T-SQL
9 5 (0.48%) VB
10 4 (0.39%) Java
10 4 (0.39%) VBA
11 3 (0.29%) VB.NET
12 1 (0.097%) Ada
12 1 (0.097%) Embedded C++
12 1 (0.097%) PL/SQL
Qualifications
1 612 (59.13%) Degree
2 567 (54.78%) BPSS Clearance
3 282 (27.25%) HND
4 217 (20.97%) HNC
5 19 (1.84%) Microsoft Certification
6 17 (1.64%) Computer Science Degree
7 15 (1.45%) MCSE
8 13 (1.26%) Master's Degree
9 10 (0.97%) PhD
10 9 (0.87%) PMI Certification
11 8 (0.77%) Azure Certification
12 5 (0.48%) DBS Check
13 4 (0.39%) CCNA
13 4 (0.39%) Cisco Certification
13 4 (0.39%) Security Cleared
13 4 (0.39%) Six Sigma Master Black Belt
14 3 (0.29%) AWS Certification
14 3 (0.29%) Network+ Certification
14 3 (0.29%) SC Cleared
15 2 (0.19%) AWS Certified Solutions Architect
Quality Assurance & Compliance
1 8 (0.77%) QA
2 7 (0.68%) Data Quality
2 7 (0.68%) ISO 26262
3 6 (0.58%) Automotive SPICE
4 3 (0.29%) Accessibility
4 3 (0.29%) AUTOSAR
5 2 (0.19%) ISO/IEC 27001
5 2 (0.19%) JTAG
5 2 (0.19%) NIST
5 2 (0.19%) PMO
5 2 (0.19%) SLA
6 1 (0.097%) Cyber Essentials
6 1 (0.097%) Cyber Essentials PLUS
6 1 (0.097%) GDPR
6 1 (0.097%) ISO 14001
6 1 (0.097%) ISO 9000
6 1 (0.097%) ISO 9001
6 1 (0.097%) MISRA
6 1 (0.097%) MISRA C
6 1 (0.097%) PCI DSS
System Software
1 29 (2.80%) Active Directory
2 13 (1.26%) Docker
3 5 (0.48%) Firmware
3 5 (0.48%) Terminal Services
4 3 (0.29%) Hyper-V
4 3 (0.29%) LXC
5 1 (0.097%) Embedded Firmware
Systems Management
1 13 (1.26%) Terraform
2 12 (1.16%) Kubernetes
3 8 (0.77%) Microsoft Intune
4 5 (0.48%) Functional Safety
5 3 (0.29%) SCCM
6 1 (0.097%) Ansible
6 1 (0.097%) Kibana
6 1 (0.097%) Nessus
6 1 (0.097%) OpenVAS
6 1 (0.097%) QRadar
Vendors
1 249 (24.06%) Microsoft
2 207 (20.00%) ANSYS
3 23 (2.22%) Cisco
4 19 (1.84%) Google
5 18 (1.74%) Fortinet
6 11 (1.06%) Apple
6 11 (1.06%) Dell
6 11 (1.06%) Ubiquiti
7 8 (0.77%) Databricks
7 8 (0.77%) SAP
8 7 (0.68%) Ariba
9 6 (0.58%) VMware
10 5 (0.48%) Oracle
11 4 (0.39%) Adobe
11 4 (0.39%) Hitachi
11 4 (0.39%) Logitech
12 3 (0.29%) Freshdesk
12 3 (0.29%) Meraki
12 3 (0.29%) Okta
12 3 (0.29%) YouTube