Software Testing Job Trends in England

Software Testing
UK > England

The table below provides summary statistics and salary benchmarking for jobs advertised in England requiring Software Testing skills. It covers permanent job vacancies from the 6 months leading up to 18 November 2025, with comparisons to the same periods in the previous two years.

6 months to
18 Nov 2025
Same period 2024 Same period 2023
Rank 270 160 174
Rank change year-on-year -110 +14 -82
Permanent jobs citing Software Testing 422 1,029 905
As % of all permanent jobs in England 0.92% 1.71% 1.92%
As % of the Processes & Methodologies category 1.07% 2.05% 2.05%
Number of salaries quoted 317 513 700
10th Percentile £28,750 £35,000 £35,000
25th Percentile £41,250 £42,500 £44,744
Median annual salary (50th Percentile) £56,430 £57,500 £55,000
Median % change year-on-year -1.86% +4.55% +4.76%
75th Percentile £72,000 £72,500 £72,500
90th Percentile £90,000 £81,250 £88,750
UK median annual salary £56,500 £57,500 £55,000
% change year-on-year -1.74% +4.55% +4.76%

All Process and Methodology Skills
England

Software Testing falls under the Processes and Methodologies category. For comparison with the information above, the following table provides summary statistics for all permanent job vacancies requiring process or methodology skills in England.

Permanent vacancies with a requirement for process or methodology skills 39,312 50,298 44,083
As % of all permanent jobs advertised in England 85.94% 83.82% 93.70%
Number of salaries quoted 24,307 25,999 33,770
10th Percentile £28,250 £35,000 £32,500
25th Percentile £36,250 £45,000 £45,000
Median annual salary (50th Percentile) £55,000 £60,000 £60,000
Median % change year-on-year -8.33% - -1.64%
75th Percentile £75,000 £80,000 £81,250
90th Percentile £95,000 £100,000 £100,000
UK median annual salary £55,000 £60,000 £60,000
% change year-on-year -8.33% - -

Software Testing
Job Vacancy Trend in England

Historical trend showing the proportion of permanent IT job postings citing Software Testing relative to all permanent IT jobs advertised in England.
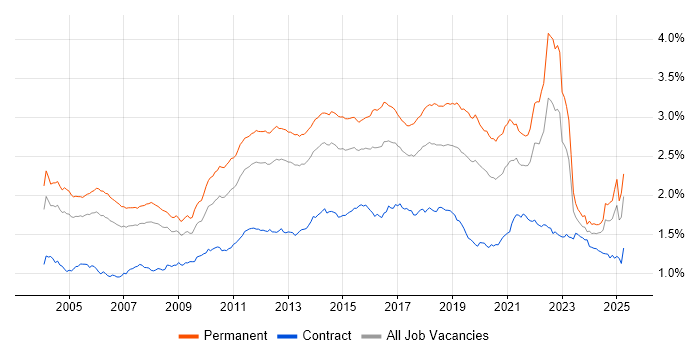
Software Testing job vacancy trend in England

Software Testing
Salary Trend in England

Salary distribution trend for jobs in England citing Software Testing.

Salary distribution trend for jobs in England citing Software Testing

Software Testing
Salary Histogram in England

Salary distribution for jobs citing Software Testing in England over the 6 months to 18 November 2025.

Salary histogram for Software Testing in England

Software Testing
Job Locations in England

The table below looks at the demand and provides a guide to the median salaries quoted in IT jobs citing Software Testing within the England region over the 6 months to 18 November 2025. The 'Rank Change' column provides an indication of the change in demand within each location based on the same 6 month period last year.

Location Rank Change
on Same Period
Last Year
Matching
Permanent
IT Job Ads
Median Salary
Past 6 Months
Median Salary
% Change
on Same Period
Last Year
Live
Jobs
London -25 140 £67,500 +8.87% 185
South East -32 107 £47,500 -26.92% 143
North of England -44 64 £50,000 -0.05% 63
Midlands -52 51 £42,500 -10.53% 29
South West -51 41 £56,000 -13.85% 49
West Midlands +12 29 £42,500 -10.53% 16
North West -46 28 £66,250 +29.20% 43
Yorkshire +1 25 £32,750 -40.45% 19
East Midlands -49 22 £56,000 +1.82% 13
East of England -49 17 £60,000 +3.45% 48
North East +2 11 £56,500 +41.25% 1
Software Testing
UK

Software Testing
Co-Occurring Skills & Capabilities in England by Category

The following tables expand on the one above by listing co-occurrences grouped by category. They cover the same employment type, locality and period, with up to 20 co-occurrences shown in each category:

Application Platforms
1 14 (3.32%) Appian
2 4 (0.95%) nginx
2 4 (0.95%) SharePoint
2 4 (0.95%) Traefik
2 4 (0.95%) WinCC
3 3 (0.71%) Confluence
4 2 (0.47%) CMS
4 2 (0.47%) IIS
4 2 (0.47%) Umbraco
5 1 (0.24%) Office Communications Server
5 1 (0.24%) WordPress
Applications
1 20 (4.74%) Microsoft Office
2 5 (1.18%) Microsoft Excel
3 4 (0.95%) Simulink
4 3 (0.71%) Microsoft Project
5 2 (0.47%) MS Visio
6 1 (0.24%) AutoCAD
6 1 (0.24%) CANalyzer
6 1 (0.24%) CATIA
6 1 (0.24%) Doxygen
6 1 (0.24%) EPLAN
Business Applications
1 3 (0.71%) Dynamics CRM
1 3 (0.71%) Sage X3
1 3 (0.71%) Unit4 Business World
2 2 (0.47%) Payment Gateway
2 2 (0.47%) SAP Business One
3 1 (0.24%) Cognos Business Intelligence
3 1 (0.24%) Elite 3E
3 1 (0.24%) NEC Housing
3 1 (0.24%) NetSuite
3 1 (0.24%) Shopify
3 1 (0.24%) Siebel CRM
3 1 (0.24%) Sparx Enterprise Architect
3 1 (0.24%) Teamcenter
Cloud Services
1 87 (20.62%) Azure
2 69 (16.35%) AWS
3 41 (9.72%) Azure DevOps
4 37 (8.77%) SaaS
5 20 (4.74%) AWS Lambda
5 20 (4.74%) Serverless
6 15 (3.55%) Power Platform
7 10 (2.37%) GitHub
8 9 (2.13%) Azure Data Factory
9 8 (1.90%) Entra ID
10 7 (1.66%) Amazon EKS
11 6 (1.42%) GCP
12 5 (1.18%) Azure Synapse Analytics
13 4 (0.95%) Akamai
13 4 (0.95%) BrowserStack
13 4 (0.95%) Cloud Computing
13 4 (0.95%) Cloudflare
13 4 (0.95%) IaaS
13 4 (0.95%) Microsoft Purview
13 4 (0.95%) PaaS
Communications & Networking
1 5 (1.18%) Ethernet
2 4 (0.95%) DHCP
2 4 (0.95%) DNS
2 4 (0.95%) ICMP
2 4 (0.95%) LAN
2 4 (0.95%) Profibus
2 4 (0.95%) Reverse Proxy
2 4 (0.95%) TCP/IP
2 4 (0.95%) VPN
2 4 (0.95%) WAN
3 2 (0.47%) HTTP
3 2 (0.47%) Modbus
4 1 (0.24%) Cisco ISE
4 1 (0.24%) Firewall
4 1 (0.24%) Internet
4 1 (0.24%) Kerberos
4 1 (0.24%) Network Security
4 1 (0.24%) SAN
4 1 (0.24%) Wireless
Database & Business Intelligence
1 33 (7.82%) SQL Server
2 16 (3.79%) DynamoDB
2 16 (3.79%) Elasticsearch
2 16 (3.79%) PostgreSQL
3 13 (3.08%) Relational Database
4 9 (2.13%) Power BI
5 7 (1.66%) MongoDB
5 7 (1.66%) SQL Server Integration Services
6 6 (1.42%) Azure SQL Database
7 5 (1.18%) Data Lake
7 5 (1.18%) Data Warehouse
7 5 (1.18%) Metadata
7 5 (1.18%) MySQL
7 5 (1.18%) OLTP
7 5 (1.18%) Redis
8 4 (0.95%) Big Data
8 4 (0.95%) SQL Server Analysis Services
9 3 (0.71%) Mixpanel
9 3 (0.71%) NoSQL
9 3 (0.71%) SQL Server Reporting Services
Development Applications
1 70 (16.59%) JIRA
2 65 (15.40%) Selenium
3 46 (10.90%) Postman
4 32 (7.58%) Git
5 31 (7.35%) Jenkins
5 31 (7.35%) WebDriver
6 27 (6.40%) SoapUI
7 20 (4.74%) Cypress.io
8 17 (4.03%) Team Foundation Server
9 12 (2.84%) TestRail
10 9 (2.13%) REST Assured
11 8 (1.90%) JMeter
12 7 (1.66%) SpecFlow
13 6 (1.42%) GitLab
13 6 (1.42%) Maven
13 6 (1.42%) Visual Studio
14 5 (1.18%) Rational DOORS
14 5 (1.18%) Zephyr
15 4 (0.95%) JUnit
15 4 (0.95%) Subversion
General
1 148 (35.07%) Social Skills
2 103 (24.41%) Finance
3 72 (17.06%) Analytical Skills
4 48 (11.37%) Law
5 38 (9.00%) Inclusion and Diversity
6 33 (7.82%) Banking
7 22 (5.21%) Legal
8 19 (4.50%) Electronics
9 17 (4.03%) Publishing
10 16 (3.79%) Health Technology
11 15 (3.55%) Tech for Good
12 13 (3.08%) Organisational Skills
13 12 (2.84%) Marketing
14 11 (2.61%) Public Sector
15 10 (2.37%) Advertising
15 10 (2.37%) Manufacturing
16 8 (1.90%) Front Office
16 8 (1.90%) Games
16 8 (1.90%) Investment Banking
17 6 (1.42%) Military
Job Titles
1 100 (23.70%) Senior
2 89 (21.09%) Developer
3 65 (15.40%) Lead
4 55 (13.03%) Analyst
5 54 (12.80%) Software Engineer
6 38 (9.00%) Software Developer
7 37 (8.77%) Test Analyst
8 35 (8.29%) Senior Developer
9 31 (7.35%) Test Engineer
10 28 (6.64%) Tester
11 22 (5.21%) Python Engineer
11 22 (5.21%) Python Software Engineer
12 19 (4.50%) Lead Software Engineer
13 18 (4.27%) Senior Analyst
14 17 (4.03%) Consultant
15 16 (3.79%) Senior Software Engineer
16 15 (3.55%) IT Support
17 14 (3.32%) Python Developer
17 14 (3.32%) Test Automation Engineer
17 14 (3.32%) Test Leader
Libraries, Frameworks & Software Standards
1 76 (18.01%) .NET
2 57 (13.51%) React
3 46 (10.90%) HTML
4 29 (6.87%) Playwright
4 29 (6.87%) RESTful
5 26 (6.16%) SOAP
6 22 (5.21%) Node.js
7 21 (4.98%) CSS
7 21 (4.98%) REST
8 17 (4.03%) Swagger
9 16 (3.79%) .NET Framework
10 15 (3.55%) XML
11 14 (3.32%) ASP.NET
12 12 (2.84%) .NET Core
12 12 (2.84%) Kafka
13 11 (2.61%) Entity Framework
14 9 (2.13%) AngularJS
14 9 (2.13%) Spring
15 8 (1.90%) CSS3
15 8 (1.90%) HTML5
Miscellaneous
1 35 (8.29%) Product Ownership
2 29 (6.87%) Cloud Native
3 27 (6.40%) Self-Motivation
4 15 (3.55%) Distributed Systems
5 14 (3.32%) Embedded Systems
5 14 (3.32%) Team-Oriented Environment
6 13 (3.08%) Enterprise Software
7 12 (2.84%) Onboarding
8 11 (2.61%) SCADA
9 10 (2.37%) Mobile App
10 8 (1.90%) Algorithms
10 8 (1.90%) Derivative
10 8 (1.90%) Mobile Banking
10 8 (1.90%) Public Cloud
11 7 (1.66%) Management Information System
12 5 (1.18%) Driving Licence
13 4 (0.95%) CCTV
13 4 (0.95%) EPoS
13 4 (0.95%) Fibre Optics
13 4 (0.95%) Reference Data
Operating Systems
1 26 (6.16%) Windows
2 21 (4.98%) Linux
3 7 (1.66%) Unix
4 6 (1.42%) Android
5 3 (0.71%) Windows Server
6 2 (0.47%) Apple iOS
6 2 (0.47%) CentOS
6 2 (0.47%) FreeRTOS
6 2 (0.47%) Windows Server 2019
7 1 (0.24%) Embedded Linux
7 1 (0.24%) Mac OS
7 1 (0.24%) Ubuntu
7 1 (0.24%) Windows 10
Processes & Methodologies
1 243 (57.58%) Agile
2 151 (35.78%) Problem-Solving
3 124 (29.38%) Test Automation
4 112 (26.54%) CI/CD
5 102 (24.17%) Continuous Improvement
6 93 (22.04%) Software Engineering
7 81 (19.19%) DevOps
7 81 (19.19%) Scrum
8 80 (18.96%) SDLC
9 71 (16.82%) Computer Science
9 71 (16.82%) Mentoring
10 62 (14.69%) Test Scripting
11 53 (12.56%) Manual Testing
12 45 (10.66%) API Testing
13 44 (10.43%) Test Management
14 42 (9.95%) Test Strategy
15 41 (9.72%) Full-Stack Development
16 39 (9.24%) Regression Testing
16 39 (9.24%) Waterfall
17 38 (9.00%) Code Quality
Programming Languages
1 119 (28.20%) SQL
2 85 (20.14%) Java
3 81 (19.19%) Python
4 80 (18.96%) C#
5 55 (13.03%) JavaScript
6 54 (12.80%) TypeScript
7 25 (5.92%) C
8 19 (4.50%) Bash
8 19 (4.50%) C++
9 10 (2.37%) Go
9 10 (2.37%) PowerShell
10 7 (1.66%) T-SQL
11 5 (1.18%) Groovy
11 5 (1.18%) Kotlin
11 5 (1.18%) PL/SQL
12 4 (0.95%) Fortran
12 4 (0.95%) PHP
13 3 (0.71%) SystemVerilog
13 3 (0.71%) VBScript
14 2 (0.47%) Data Analysis Expressions
Qualifications
1 128 (30.33%) Degree
2 74 (17.54%) ISTQB
3 50 (11.85%) Security Cleared
4 41 (9.72%) SC Cleared
5 33 (7.82%) Computer Science Degree
6 23 (5.45%) ISEB
7 21 (4.98%) ISTQB Advanced Certification
8 17 (4.03%) ISTQB Foundation Certification
9 13 (3.08%) BPSS Clearance
9 13 (3.08%) Master's Degree
10 8 (1.90%) DV Cleared
10 8 (1.90%) PhD
11 5 (1.18%) Microsoft Certification
11 5 (1.18%) Numerate Degree
12 3 (0.71%) CITP
12 3 (0.71%) CREST Certified
12 3 (0.71%) HNC
13 2 (0.47%) Azure Certification
13 2 (0.47%) DBS Check
13 2 (0.47%) OSCP
Quality Assurance & Compliance
1 109 (25.83%) QA
2 16 (3.79%) Accessibility
3 11 (2.61%) Software Quality Assurance
4 8 (1.90%) Data Quality
5 7 (1.66%) SLA
6 6 (1.42%) GDPR
7 4 (0.95%) WCAG
8 3 (0.71%) ISO 9001
8 3 (0.71%) SEPA
9 2 (0.47%) ISO 9000
9 2 (0.47%) ISO/IEC 27001
9 2 (0.47%) JTAG
10 1 (0.24%) AUTOSAR
10 1 (0.24%) IEC 61131
10 1 (0.24%) IEC 61508
10 1 (0.24%) IEC 62304
10 1 (0.24%) ISO/IEC 12207
10 1 (0.24%) ISO/IEC 15288
10 1 (0.24%) NIST
System Software
1 18 (4.27%) Docker
2 11 (2.61%) Active Directory
3 8 (1.90%) Firmware
4 6 (1.42%) Embedded Firmware
5 2 (0.47%) VMware Infrastructure
6 1 (0.24%) Hyper-V
6 1 (0.24%) Terminal Server
6 1 (0.24%) Virtual Desktop
6 1 (0.24%) VMware Workstation
Systems Management
1 27 (6.40%) Kubernetes
2 16 (3.79%) Terraform
3 4 (0.95%) Grafana
3 4 (0.95%) HAProxy
4 3 (0.71%) HP ALM
4 3 (0.71%) SCCM
5 2 (0.47%) Functional Safety
5 2 (0.47%) Nessus
5 2 (0.47%) Prometheus
5 2 (0.47%) SCOM
6 1 (0.24%) Ansible
6 1 (0.24%) Microsoft Intune
Vendors
1 52 (12.32%) Microsoft
2 15 (3.55%) Oracle
3 13 (3.08%) Siemens
4 6 (1.42%) Databricks
5 5 (1.18%) Rockwell
5 5 (1.18%) SAP
5 5 (1.18%) ServiceNow
5 5 (1.18%) Workday
5 5 (1.18%) Zoho
6 4 (0.95%) AVEVA
6 4 (0.95%) Google
6 4 (0.95%) Siebel
6 4 (0.95%) VMware
7 3 (0.71%) Adobe
7 3 (0.71%) HP
7 3 (0.71%) Microsemi
7 3 (0.71%) Red Hat
7 3 (0.71%) Sage
7 3 (0.71%) Salesforce
7 3 (0.71%) Tealium