C++ Jobs in England

C++
UK > England

The table below provides summary statistics for permanent job vacancies advertised in England requiring C++ skills. It includes a benchmarking guide to the annual salaries offered in vacancies that cited C++ over the 6 months leading up to 27 April 2025, comparing them to the same period in the previous two years.

6 months to
27 Apr 2025
Same period 2024 Same period 2023
Rank 96 144 157
Rank change year-on-year +48 +13 -70
Permanent jobs citing C++ 1,354 1,724 2,212
As % of all permanent jobs advertised in England 2.95% 2.03% 2.37%
As % of the Programming Languages category 9.59% 6.25% 5.44%
Number of salaries quoted 638 1,371 1,541
10th Percentile £37,500 £39,500 £36,250
25th Percentile £50,000 £47,500 £46,250
Median annual salary (50th Percentile) £66,219 £60,000 £70,000
Median % change year-on-year +10.37% -14.29% -
75th Percentile £95,000 £75,000 £90,000
90th Percentile £122,500 £100,000 £122,500
UK median annual salary £66,200 £60,000 £65,000
% change year-on-year +10.33% -7.69% -3.70%

All Programming Languages
England

C++ falls under the Programming Languages category. For comparison with the information above, the following table provides summary statistics for all permanent job vacancies requiring coding skills in England.

Permanent vacancies with a requirement for coding skills 14,115 27,567 40,688
As % of all permanent jobs advertised in England 30.73% 32.45% 43.59%
Number of salaries quoted 10,351 22,492 26,016
10th Percentile £37,500 £35,013 £39,750
25th Percentile £47,683 £45,000 £50,000
Median annual salary (50th Percentile) £62,000 £60,000 £65,000
Median % change year-on-year +3.33% -7.69% +4.00%
75th Percentile £83,750 £80,000 £87,500
90th Percentile £110,000 £100,000 £108,750
UK median annual salary £60,000 £60,000 £65,000
% change year-on-year - -7.69% +4.00%

C++
Job Vacancy Trend in England

Job postings citing C++ as a proportion of all IT jobs advertised in England.
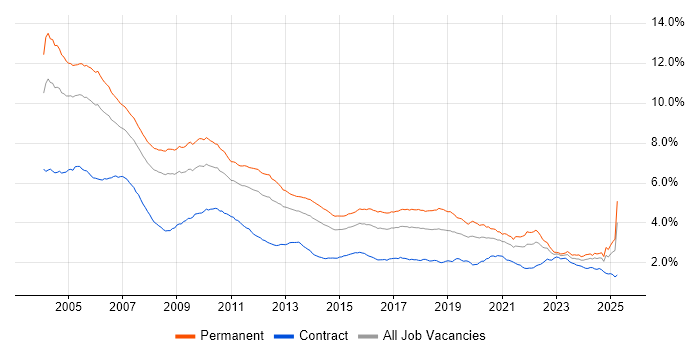
Job vacancy trend for C++ in England

C++
Salary Trend in England

3-month moving average salary quoted in jobs citing C++ in England.

Salary trend for C++ in England

C++
Salary Histogram in England

Salary distribution for jobs citing C++ in England over the 6 months to 27 April 2025.

Salary histogram for C++ in England

C++
Job Locations in England

The table below looks at the demand and provides a guide to the median salaries quoted in IT jobs citing C++ within the England region over the 6 months to 27 April 2025. The 'Rank Change' column provides an indication of the change in demand within each location based on the same 6 month period last year.

Location Rank Change
on Same Period
Last Year
Matching
Permanent
IT Job Ads
Median Salary
Past 6 Months
Median Salary
% Change
on Same Period
Last Year
Live
Jobs
North of England +122 450 £55,000 -4.35% 194
North West +129 415 £56,250 -7.79% 88
London +88 361 £110,000 +11.39% 1,348
South East -28 213 £62,500 +7.76% 413
East of England +66 209 £66,206 +10.34% 345
South West -30 63 £55,000 - 184
Midlands -44 49 £40,000 -20.00% 119
West Midlands -19 34 £40,000 -30.43% 68
Yorkshire +23 28 £46,000 -3.16% 65
East Midlands -13 14 £56,250 +12.52% 48
North East +32 7 £25,000 -54.55% 42
C++
UK

C++
Co-occurring Skills and Capabilities in England by Category

The follow tables expand on the table above by listing co-occurrences grouped by category. The same employment type, locality and period is covered with up to 20 co-occurrences shown in each of the following categories:

Application Platforms
1 11 (0.81%) Kinematics
2 7 (0.52%) Apache
3 5 (0.37%) Apache Spark
4 3 (0.22%) OpenStack
4 3 (0.22%) WinCC
5 2 (0.15%) Apache Airflow
5 2 (0.15%) CMS
5 2 (0.15%) Microsoft Exchange
5 2 (0.15%) WordPress
6 1 (0.074%) Ethereum
6 1 (0.074%) MTS
6 1 (0.074%) OpenEdge
6 1 (0.074%) Oracle Workflow
6 1 (0.074%) SharePoint
Applications
1 108 (7.98%) Chatbot
2 16 (1.18%) Microsoft Excel
3 11 (0.81%) Microsoft Office
4 9 (0.66%) Simulink
5 2 (0.15%) 3ds Max
5 2 (0.15%) GNU Octave
5 2 (0.15%) Microsoft Project
5 2 (0.15%) OrCAD
5 2 (0.15%) Zemax
6 1 (0.074%) Adobe Creative Suite
6 1 (0.074%) Blender
6 1 (0.074%) CANalyzer
6 1 (0.074%) Houdini
6 1 (0.074%) Maya
6 1 (0.074%) Microsoft PowerPoint
6 1 (0.074%) TargetLink
Business Applications
1 24 (1.77%) Ripple
1 24 (1.77%) Ripple XRP
2 4 (0.30%) Dynamics NAV
2 4 (0.30%) Remedy ITSM
3 3 (0.22%) Orchestrade
4 2 (0.15%) SAP Oil and Gas
5 1 (0.074%) Refinitiv Enterprise Platform
Cloud Services
1 143 (10.56%) Azure
2 107 (7.90%) AWS
3 63 (4.65%) Amazon EKS
4 49 (3.62%) AWS CloudFormation
5 21 (1.55%) GitHub
6 20 (1.48%) Amazon S3
6 20 (1.48%) AWS Lambda
6 20 (1.48%) Serverless
7 15 (1.11%) Power Platform
8 14 (1.03%) Amazon EC2
8 14 (1.03%) Datadog
9 12 (0.89%) Azure Synapse Analytics
10 11 (0.81%) GCP
11 7 (0.52%) Azure DevOps
11 7 (0.52%) Microsoft 365
12 5 (0.37%) Cloud Computing
12 5 (0.37%) SaaS
13 4 (0.30%) Amazon Bedrock
14 2 (0.15%) Google Analytics
14 2 (0.15%) PaaS
Communications & Networking
1 407 (30.06%) VPN
2 401 (29.62%) DNS
3 38 (2.81%) TCP/IP
4 20 (1.48%) Wireless
5 15 (1.11%) HTTP
6 14 (1.03%) Bluetooth
6 14 (1.03%) RS-485
7 12 (0.89%) Multicast
7 12 (0.89%) Network Security
8 10 (0.74%) WAN
9 9 (0.66%) Modbus
9 9 (0.66%) RS-232
10 8 (0.59%) FTP
10 8 (0.59%) Profibus
10 8 (0.59%) ZigBee
11 7 (0.52%) Firewall
11 7 (0.52%) Internet
12 6 (0.44%) Ethernet
12 6 (0.44%) HTTPS
12 6 (0.44%) SMTP
Database & Business Intelligence
1 51 (3.77%) Elasticsearch
2 50 (3.69%) SQL Server
3 34 (2.51%) MySQL
3 34 (2.51%) PostgreSQL
4 28 (2.07%) Relational Database
5 15 (1.11%) Power BI
6 10 (0.74%) NoSQL
7 9 (0.66%) RDBMS
8 6 (0.44%) Hadoop
8 6 (0.44%) KDB
8 6 (0.44%) MongoDB
9 5 (0.37%) Azure SQL Database
9 5 (0.37%) Big Data
9 5 (0.37%) Tick Data
10 4 (0.30%) Metabase
10 4 (0.30%) Metadata
11 3 (0.22%) Kdb+
11 3 (0.22%) Pinecone
11 3 (0.22%) Weaviate
12 2 (0.15%) Scylla
Development Applications
1 81 (5.98%) Git
2 49 (3.62%) Jenkins
3 32 (2.36%) GitLab
4 29 (2.14%) JIRA
5 16 (1.18%) Maven
5 16 (1.18%) Visual Studio
6 15 (1.11%) Cucumber
7 14 (1.03%) IntelliJ
7 14 (1.03%) JUnit
7 14 (1.03%) Mockito
7 14 (1.03%) Subversion
8 11 (0.81%) Robot Framework
9 7 (0.52%) MagicDraw
9 7 (0.52%) Rational DOORS
10 6 (0.44%) CMake
10 6 (0.44%) Eclipse
11 5 (0.37%) Bitbucket
12 4 (0.30%) GDB
13 3 (0.22%) IDA Disassembler
13 3 (0.22%) Rational Rhapsody
General
1 619 (45.72%) Finance
2 522 (38.55%) Analytical Skills
3 476 (35.16%) Inclusion and Diversity
4 180 (13.29%) Social Skills
5 99 (7.31%) Electronics
6 57 (4.21%) Manufacturing
7 50 (3.69%) Aerospace
7 50 (3.69%) Banking
8 44 (3.25%) Front Office
9 36 (2.66%) Investment Banking
10 35 (2.58%) Law
11 31 (2.29%) Marketing
12 26 (1.92%) Financial Institution
13 24 (1.77%) Digital Economy
14 18 (1.33%) Telecoms
15 15 (1.11%) Games
16 14 (1.03%) Automotive
16 14 (1.03%) Presentation Skills
17 13 (0.96%) Legal
18 12 (0.89%) Publishing
Job Titles
1 736 (54.36%) Developer
2 492 (36.34%) Software Developer
3 290 (21.42%) Software Engineer
4 266 (19.65%) Senior
5 124 (9.16%) C++ Developer
6 115 (8.49%) Senior Software Engineer
7 101 (7.46%) Trainer
8 94 (6.94%) Lead
9 89 (6.57%) Senior Developer
10 59 (4.36%) Embedded Engineer
10 59 (4.36%) Low Latency C++ Developer
11 58 (4.28%) Cloud Engineer
12 54 (3.99%) Quantitative Developer
13 48 (3.55%) C++ Quantitative Developer
14 47 (3.47%) Graduate
15 46 (3.40%) C++ Software Engineer
15 46 (3.40%) Cloud Software Engineer
16 45 (3.32%) Senior C++ Developer
17 44 (3.25%) Embedded Software Engineer
18 40 (2.95%) Principal Engineer
Libraries, Frameworks & Software Standards
1 134 (9.90%) HTML
2 125 (9.23%) .NET
3 62 (4.58%) Node.js
4 53 (3.91%) Pandas
5 49 (3.62%) ASP.NET
5 49 (3.62%) CSS
6 33 (2.44%) jQuery
7 28 (2.07%) Boost C++ Libraries
8 23 (1.70%) React
9 21 (1.55%) Qt
10 20 (1.48%) Django
11 19 (1.40%) FIX Protocol
11 19 (1.40%) Middleware
12 15 (1.11%) .NET Framework
13 14 (1.03%) ActiveMQ
13 14 (1.03%) JMS
13 14 (1.03%) Spring
13 14 (1.03%) Spring Boot
13 14 (1.03%) XML
14 12 (0.89%) HTML5
Miscellaneous
1 447 (33.01%) Cyberattack
2 163 (12.04%) Algorithms
3 77 (5.69%) Distributed Systems
4 71 (5.24%) Embedded Systems
5 64 (4.73%) FPGA
6 56 (4.14%) Hedge funds
7 48 (3.55%) Cloud Native
7 48 (3.55%) Equities
8 42 (3.10%) Data Structures
9 41 (3.03%) Legacy Code
10 40 (2.95%) Management Information System
11 35 (2.58%) Robotics
12 30 (2.22%) Derivative
13 28 (2.07%) Foreign Exchange (FX)
14 26 (1.92%) Blockchain
14 26 (1.92%) VHDL
15 24 (1.77%) Self-Motivation
16 23 (1.70%) Enterprise Software
17 15 (1.11%) IoT
17 15 (1.11%) Verilog
Operating Systems
1 729 (53.84%) Linux
2 470 (34.71%) Android
3 46 (3.40%) Windows
4 24 (1.77%) Unix
5 17 (1.26%) Apple iOS
6 14 (1.03%) Embedded Linux
7 11 (0.81%) Rocky
8 10 (0.74%) FreeRTOS
9 6 (0.44%) Robot Operating System
9 6 (0.44%) Ubuntu
10 5 (0.37%) Red Hat Enterprise Linux
11 2 (0.15%) AIX
11 2 (0.15%) CentOS
11 2 (0.15%) Mac OS
11 2 (0.15%) Oracle Linux
11 2 (0.15%) VMS
12 1 (0.074%) Windows 10
12 1 (0.074%) Windows Server
12 1 (0.074%) Windows Server 2016
12 1 (0.074%) Windows Server 2019
Processes & Methodologies
1 597 (44.09%) Agile
2 589 (43.50%) Mathematics
3 530 (39.14%) OO
4 497 (36.71%) OOP
5 456 (33.68%) Line Management
6 455 (33.60%) Design Patterns
7 454 (33.53%) Android Development
8 411 (30.35%) Software Engineering
9 209 (15.44%) Computer Science
10 178 (13.15%) Artificial Intelligence
11 128 (9.45%) Problem-Solving
12 123 (9.08%) Low Latency
13 108 (7.98%) CI/CD
13 108 (7.98%) Conversational UI
14 105 (7.75%) Code Quality
15 100 (7.39%) Test Automation
16 96 (7.09%) Physics
17 85 (6.28%) Statistics
18 80 (5.91%) Mentoring
19 74 (5.47%) Software Testing
Programming Languages
1 927 (68.46%) Python
2 665 (49.11%) Java
3 512 (37.81%) Go
4 352 (26.00%) C
5 286 (21.12%) C#
6 212 (15.66%) SQL
7 204 (15.07%) JavaScript
8 141 (10.41%) Rust
9 47 (3.47%) MATLAB
9 47 (3.47%) PHP
10 30 (2.22%) Perl
11 27 (1.99%) Bash
12 23 (1.70%) R
13 20 (1.48%) Embedded C++
14 17 (1.26%) Fortran
14 17 (1.26%) Kotlin
14 17 (1.26%) TypeScript
15 16 (1.18%) Embedded C
16 15 (1.11%) Objective-C
17 14 (1.03%) VB
Qualifications
1 515 (38.04%) Security Cleared
2 484 (35.75%) DV Cleared
3 381 (28.14%) Degree
4 84 (6.20%) Computer Science Degree
5 66 (4.87%) PhD
6 64 (4.73%) Master's Degree
7 34 (2.51%) SC Cleared
8 12 (0.89%) Numerate Degree
9 9 (0.66%) Microsoft Certification
10 8 (0.59%) BPSS Clearance
11 5 (0.37%) CISSP
11 5 (0.37%) Postgraduate
12 4 (0.30%) A+ Certification
12 4 (0.30%) Dell Certification
12 4 (0.30%) MCP
13 3 (0.22%) HND
14 2 (0.15%) CompTIA Security+
14 2 (0.15%) CSSLP
14 2 (0.15%) PMI Certification
14 2 (0.15%) PMP
Quality Assurance & Compliance
1 24 (1.77%) QA
2 6 (0.44%) Accessibility
3 5 (0.37%) ISO/IEC 27001
3 5 (0.37%) MISRA
3 5 (0.37%) NIST
4 4 (0.30%) GDPR
4 4 (0.30%) PMO
5 3 (0.22%) ECSS
5 3 (0.22%) HAZOP
6 2 (0.15%) Data Quality
6 2 (0.15%) Def Stans
6 2 (0.15%) HIPAA
6 2 (0.15%) ISO 26262
6 2 (0.15%) ISO 9001
6 2 (0.15%) MISRA C
7 1 (0.074%) COBIT
7 1 (0.074%) HL7
7 1 (0.074%) IEC 61508
7 1 (0.074%) ISO 13485
7 1 (0.074%) JTAG
System Software
1 476 (35.16%) Docker
2 52 (3.84%) Firmware
3 29 (2.14%) Embedded Firmware
4 3 (0.22%) HDFS
5 2 (0.15%) KVM
5 2 (0.15%) Postfix
5 2 (0.15%) Sendmail
5 2 (0.15%) Virtual Machines
6 1 (0.074%) Active Directory
6 1 (0.074%) Hyper-V
6 1 (0.074%) Xen
Systems Management
1 466 (34.42%) Ansible
2 124 (9.16%) Kubernetes
3 75 (5.54%) Terraform
4 8 (0.59%) Prometheus
5 7 (0.52%) Grafana
6 6 (0.44%) QRadar
7 4 (0.30%) Functional Safety
8 3 (0.22%) Kubeflow
9 2 (0.15%) Nagios
9 2 (0.15%) Nessus
Vendors
1 104 (7.68%) PayPal
2 47 (3.47%) Microsoft
3 19 (1.40%) IBM
3 19 (1.40%) Red Hat
4 15 (1.11%) EMC
5 13 (0.96%) Siemens
6 10 (0.74%) Xilinx
7 9 (0.66%) SAP
8 8 (0.59%) Altera
8 8 (0.59%) Green Hills
9 7 (0.52%) Splunk
10 6 (0.44%) Google
10 6 (0.44%) Oracle
11 5 (0.37%) Intel
11 5 (0.37%) Xamarin
12 4 (0.30%) Databricks
12 4 (0.30%) Dell
12 4 (0.30%) OpenAI
12 4 (0.30%) Remedy
12 4 (0.30%) ServiceNow