MATLAB Jobs in England

MathWorks MATLAB
UK > England

The table below provides summary statistics for permanent job vacancies advertised in England requiring MATLAB skills. It includes a benchmarking guide to the annual salaries offered in vacancies that cited MATLAB over the 6 months leading up to 16 May 2025, comparing them to the same period in the previous two years.

6 months to
16 May 2025
Same period 2024 Same period 2023
Rank 99 471 553
Rank change year-on-year +372 +82 -40
Permanent jobs citing MATLAB 1,496 408 403
As % of all permanent jobs advertised in England 3.04% 0.48% 0.45%
As % of the Programming Languages category 9.93% 1.48% 1.05%
Number of salaries quoted 954 233 127
10th Percentile £37,627 £39,000 £32,500
25th Percentile - £45,000 £42,500
Median annual salary (50th Percentile) £47,683 £55,000 £65,000
Median % change year-on-year -13.30% -15.38% -7.14%
75th Percentile £52,600 £67,500 £83,750
90th Percentile £61,250 £80,000 £107,000
UK median annual salary £47,683 £55,000 £62,500
% change year-on-year -13.30% -12.00% -10.71%

All Programming Languages
England

MATLAB falls under the Programming Languages category. For comparison with the information above, the following table provides summary statistics for all permanent job vacancies requiring coding skills in England.

Permanent vacancies with a requirement for coding skills 15,062 27,612 38,401
As % of all permanent jobs advertised in England 30.61% 32.16% 43.28%
Number of salaries quoted 10,067 22,391 24,696
10th Percentile £37,500 £35,250 £40,000
25th Percentile £47,683 £45,000 £50,000
Median annual salary (50th Percentile) £61,500 £60,000 £65,000
Median % change year-on-year +2.50% -7.69% +4.00%
75th Percentile £82,500 £80,000 £87,500
90th Percentile £110,000 £100,000 £110,000
UK median annual salary £60,000 £60,000 £65,000
% change year-on-year - -7.69% +4.00%

MATLAB
Job Vacancy Trend in England

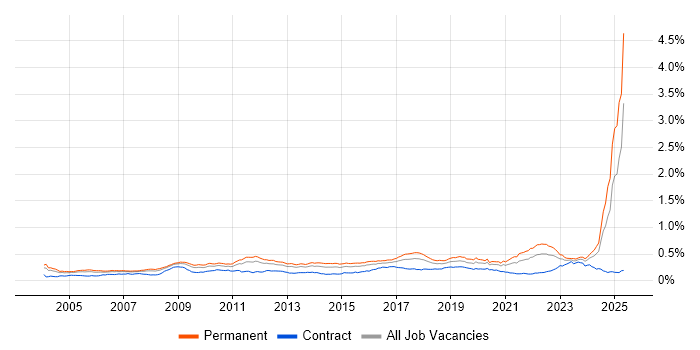
Job postings citing MATLAB as a proportion of all IT jobs advertised in England.

Job vacancy trend for MATLAB in England

MATLAB
Salary Trend in England

3-month moving average salary quoted in jobs citing MATLAB in England.

Salary trend for MATLAB in England

MATLAB
Salary Histogram in England

Salary distribution for jobs citing MATLAB in England over the 6 months to 16 May 2025.

Salary histogram for MATLAB in England

MATLAB
Job Locations in England

The table below looks at the demand and provides a guide to the median salaries quoted in IT jobs citing MATLAB within the England region over the 6 months to 16 May 2025. The 'Rank Change' column provides an indication of the change in demand within each location based on the same 6 month period last year.

Location Rank Change
on Same Period
Last Year
Matching
Permanent
IT Job Ads
Median Salary
Past 6 Months
Median Salary
% Change
on Same Period
Last Year
Live
Jobs
North of England +313 522 £47,683 -6.04% 28
North West +237 438 £48,842 -2.32% 18
South East +228 361 £47,683 -13.30% 93
Midlands +205 297 £47,683 -13.30% 42
South West +143 214 £52,600 -3.49% 47
West Midlands +140 149 £50,000 -16.67% 35
East Midlands +118 148 £47,683 +12.20% 6
Yorkshire +133 82 £47,683 -29.36% 8
East of England +41 66 £47,683 -13.30% 63
London +89 36 £150,000 +100.00% 94
North East - 2 £115,000 - 3
MATLAB
UK

MATLAB
Co-occurring Skills and Capabilities in England by Category

The follow tables expand on the table above by listing co-occurrences grouped by category. The same employment type, locality and period is covered with up to 20 co-occurrences shown in each of the following categories:

Application Platforms
1 12 (0.80%) SAS
2 1 (0.067%) Apache
2 1 (0.067%) Apache Spark
Applications
1 667 (44.59%) Simulink
2 178 (11.90%) Microsoft Office
3 173 (11.56%) Microsoft Excel
4 172 (11.50%) Microsoft PowerPoint
5 113 (7.55%) Mathcad
6 40 (2.67%) SOLIDWORKS
7 5 (0.33%) SPSS
8 2 (0.13%) GNU Octave
8 2 (0.13%) Zemax
9 1 (0.067%) CANalyzer
9 1 (0.067%) Stata
Business Applications
1 310 (20.72%) Teamcenter
Cloud Services
1 5 (0.33%) Amazon EC2
1 5 (0.33%) Amazon S3
1 5 (0.33%) AWS
2 4 (0.27%) Azure
2 4 (0.27%) GitHub
3 1 (0.067%) Power Platform
Communications & Networking
1 14 (0.94%) Software-Defined Radio
2 8 (0.53%) WAN
3 6 (0.40%) 5G
3 6 (0.40%) SD-WAN
4 5 (0.33%) Internet
5 2 (0.13%) Ethernet
5 2 (0.13%) Modbus
5 2 (0.13%) MQTT
5 2 (0.13%) Profibus
6 1 (0.067%) J1939
6 1 (0.067%) Wireless
Database & Business Intelligence
1 10 (0.67%) NoSQL
2 7 (0.47%) Tableau
3 6 (0.40%) MySQL
4 5 (0.33%) Amazon QuickSight
4 5 (0.33%) Amazon Redshift
4 5 (0.33%) Apache Hive
4 5 (0.33%) Data Mining
4 5 (0.33%) Data Warehouse
4 5 (0.33%) DynamoDB
4 5 (0.33%) Hadoop
5 4 (0.27%) SQL Server
6 2 (0.13%) Big Data
6 2 (0.13%) Elasticsearch
6 2 (0.13%) MongoDB
6 2 (0.13%) Relational Database
7 1 (0.067%) Geospatial Data
7 1 (0.067%) GIS
7 1 (0.067%) Power BI
Development Applications
1 124 (8.29%) Rational DOORS
2 11 (0.74%) Git
3 6 (0.40%) LabVIEW
4 4 (0.27%) Subversion
5 2 (0.13%) Visual Studio
6 1 (0.067%) Visual Studio Code
General
1 530 (35.43%) Aerospace
2 420 (28.07%) Automotive
3 385 (25.74%) Presentation Skills
4 296 (19.79%) Social Skills
5 186 (12.43%) Electronics
6 47 (3.14%) Manufacturing
7 28 (1.87%) Analytical Skills
7 28 (1.87%) Military
8 13 (0.87%) Publishing
9 9 (0.60%) Advertising
9 9 (0.60%) Telecoms
10 8 (0.53%) Finance
11 7 (0.47%) Law
12 4 (0.27%) Retail
13 3 (0.20%) Marketing
14 2 (0.13%) Agriculture
14 2 (0.13%) Avionics
14 2 (0.13%) Banking
14 2 (0.13%) Organisational Skills
15 1 (0.067%) Inclusion and Diversity
Job Titles
1 1,084 (72.46%) Systems Engineer
2 253 (16.91%) Senior
3 128 (8.56%) Senior Systems Engineer
4 120 (8.02%) Software Engineer
5 103 (6.89%) Junior
5 103 (6.89%) Junior Systems Engineer
6 99 (6.62%) Development Engineer
6 99 (6.62%) Software Development Engineer
7 71 (4.75%) Principal Engineer
8 67 (4.48%) Lead
8 67 (4.48%) Mathematical Modeller
9 66 (4.41%) Principal Software Engineer
10 64 (4.28%) Principal Systems Engineer
11 60 (4.01%) Integration Engineer
12 58 (3.88%) Systems Integration Engineer
13 43 (2.87%) Senior Software Engineer
14 36 (2.41%) Senior Development Engineer
14 36 (2.41%) Senior Integration Engineer
14 36 (2.41%) Senior Software Development Engineer
15 11 (0.74%) Radio Engineer
Libraries, Frameworks & Software Standards
1 51 (3.41%) HTML
2 4 (0.27%) pytest
2 4 (0.27%) React
3 3 (0.20%) .NET
3 3 (0.20%) Pandas
4 2 (0.13%) AngularJS
4 2 (0.13%) gRPC
4 2 (0.13%) Kafka
5 1 (0.067%) .NET Core
5 1 (0.067%) NumPy
5 1 (0.067%) PyTorch
5 1 (0.067%) SciPy
5 1 (0.067%) Shiny
5 1 (0.067%) TensorFlow
Miscellaneous
1 23 (1.54%) Algorithms
2 20 (1.34%) FPGA
3 16 (1.07%) Management Information System
4 15 (1.00%) Self-Motivation
5 13 (0.87%) Robotics
6 7 (0.47%) Analogue Electronics
7 6 (0.40%) Embedded Systems
7 6 (0.40%) Self-Driving Car
7 6 (0.40%) VHDL
8 5 (0.33%) GNSS
8 5 (0.33%) MicroBlaze
8 5 (0.33%) Satnav
9 3 (0.20%) e-Learning
10 2 (0.13%) Acoustics
10 2 (0.13%) Credit Risk
10 2 (0.13%) IoT
10 2 (0.13%) Onboarding
11 1 (0.067%) Analytical Mindset
11 1 (0.067%) Distributed Computing
11 1 (0.067%) Renewable Energy
Operating Systems
1 20 (1.34%) Linux
2 13 (0.87%) Windows
3 7 (0.47%) Unix
Processes & Methodologies
1 1,251 (83.62%) Systems Engineering
2 755 (50.47%) SysML
3 622 (41.58%) Agile
4 538 (35.96%) Validation
5 492 (32.89%) UML
6 447 (29.88%) Mathematics
7 395 (26.40%) Cybersecurity
8 385 (25.74%) MODAF
9 365 (24.40%) Software Engineering
10 351 (23.46%) Model-Based Systems Engineering
11 318 (21.26%) Verification and Validation
12 310 (20.72%) PLM
13 230 (15.37%) Digital Twin
14 211 (14.10%) Software Testing
15 199 (13.30%) Physics
16 197 (13.17%) Problem-Solving
17 170 (11.36%) Computer Science
18 108 (7.22%) Project Management
19 105 (7.02%) Creative Problem-Solving
20 104 (6.95%) Continuous Improvement
Programming Languages
1 201 (13.44%) Python
2 95 (6.35%) C++
3 80 (5.35%) C
4 75 (5.01%) R
5 66 (4.41%) SQL
6 60 (4.01%) C#
7 56 (3.74%) Java
8 53 (3.54%) JavaScript
9 51 (3.41%) TypeScript
10 50 (3.34%) PHP
11 49 (3.28%) Dart
11 49 (3.28%) Ruby
11 49 (3.28%) Rust
12 10 (0.67%) Perl
13 6 (0.40%) VB
14 5 (0.33%) Embedded C
14 5 (0.33%) Tcl
15 2 (0.13%) Fortran
16 1 (0.067%) Scala
16 1 (0.067%) VBA
Qualifications
1 1,152 (77.01%) Degree
2 1,091 (72.93%) BPSS Clearance
3 447 (29.88%) HND
4 436 (29.14%) HNC
5 50 (3.34%) Computer Science Degree
6 26 (1.74%) Security Cleared
7 22 (1.47%) SC Cleared
8 20 (1.34%) PhD
9 17 (1.14%) Master's Degree
10 6 (0.40%) Numerate Degree
11 2 (0.13%) DV Cleared
12 1 (0.067%) CFA
12 1 (0.067%) Postgraduate
Quality Assurance & Compliance
1 73 (4.88%) ISO/IEC 15288
2 3 (0.20%) AUTOSAR
2 3 (0.20%) ECSS
2 3 (0.20%) HAZOP
2 3 (0.20%) ISO 26262
3 2 (0.13%) IEC 61131
4 1 (0.067%) Accessibility
4 1 (0.067%) Data Quality
4 1 (0.067%) Def Stans
4 1 (0.067%) DO-254
4 1 (0.067%) IFRS
4 1 (0.067%) IFRS 9
4 1 (0.067%) ISO 9001
4 1 (0.067%) MISRA
4 1 (0.067%) MISRA C
4 1 (0.067%) QA
System Software
1 22 (1.47%) Firmware
2 16 (1.07%) Embedded Firmware
3 4 (0.27%) Docker
Systems Management
1 4 (0.27%) Kubernetes
2 2 (0.13%) Kibana
2 2 (0.13%) Terraform
3 1 (0.067%) Functional Safety
Vendors
1 207 (13.84%) ANSYS
2 172 (11.50%) Microsoft
3 103 (6.89%) IBM
4 74 (4.95%) MathWorks
5 20 (1.34%) Siemens
6 10 (0.67%) Oracle
7 9 (0.60%) Xilinx
8 7 (0.47%) Mentor Graphics
9 5 (0.33%) Altera
9 5 (0.33%) Green Hills
9 5 (0.33%) Intel
9 5 (0.33%) Vertica
10 1 (0.067%) Atlassian
10 1 (0.067%) Databricks
10 1 (0.067%) EMC
10 1 (0.067%) Palantir