Validation Job Trends in England

Validation
UK > England

The table below provides summary statistics and salary benchmarking for jobs advertised in England requiring Validation skills. It covers vacancies from the 6 months leading up to 18 September 2025, with comparisons to the same periods in the previous two years.

6 months to
18 Sep 2025
Same period 2024 Same period 2023
Rank 83 170 200
Rank change year-on-year +87 +30 -24
Permanent jobs citing Validation 1,541 1,074 925
As % of all permanent jobs advertised in England 3.57% 1.56% 1.72%
As % of the Processes & Methodologies category 4.02% 1.91% 1.82%
Number of salaries quoted 429 412 560
10th Percentile £38,750 £39,000 £37,388
25th Percentile £41,250 £46,250 £47,500
Median annual salary (50th Percentile) £55,000 £57,500 £65,000
Median % change year-on-year -4.35% -11.54% +13.04%
75th Percentile £75,900 £74,063 £78,750
90th Percentile £90,000 £94,875 £92,500
UK median annual salary £55,000 £58,033 £64,000
% change year-on-year -5.23% -9.32% +11.30%

All Process and Methodology Skills
England

Validation falls under the Processes and Methodologies category. For comparison with the information above, the following table provides summary statistics for all permanent job vacancies requiring process or methodology skills in England.

Permanent vacancies with a requirement for process or methodology skills 38,364 56,336 50,848
As % of all permanent jobs advertised in England 88.77% 81.63% 94.28%
Number of salaries quoted 22,058 32,210 38,175
10th Percentile £28,500 £32,000 £33,500
25th Percentile £37,500 £42,500 £45,000
Median annual salary (50th Percentile) £55,000 £57,500 £62,400
Median % change year-on-year -4.35% -7.85% +4.00%
75th Percentile £76,250 £77,500 £81,250
90th Percentile £97,500 £96,250 £100,000
UK median annual salary £55,000 £57,500 £60,000
% change year-on-year -4.35% -4.17% -

Validation
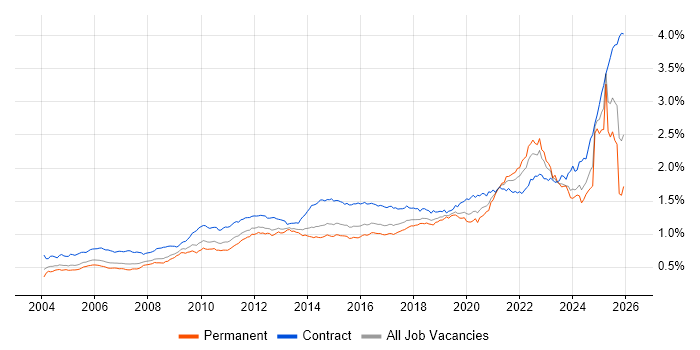
Job Vacancy Trend in England

Job postings citing Validation as a proportion of all IT jobs advertised in England.

Job vacancy trend for Validation in England

Validation
Salary Trend in England

Salary distribution trend for jobs in England citing Validation.

Salary distribution trend for jobs in England citing Validation

Validation
Salary Histogram in England

Salary distribution for jobs citing Validation in England over the 6 months to 18 September 2025.

Salary histogram for Validation in England

Validation
Job Locations in England

The table below looks at the demand and provides a guide to the median salaries quoted in IT jobs citing Validation within the England region over the 6 months to 18 September 2025. The 'Rank Change' column provides an indication of the change in demand within each location based on the same 6 month period last year.

Location Rank Change
on Same Period
Last Year
Matching
Permanent
IT Job Ads
Median Salary
Past 6 Months
Median Salary
% Change
on Same Period
Last Year
Live
Jobs
South East +70 446 £53,750 -2.27% 258
East of England +74 363 £60,000 +9.09% 117
Midlands +113 261 £55,000 +10.00% 150
London +67 256 £80,000 +14.29% 311
East Midlands +112 208 £42,500 -5.56% 47
North of England -33 115 £47,500 -0.38% 153
South West +21 84 £51,250 -14.58% 160
North West -37 71 £50,000 +4.86% 102
West Midlands +19 53 £55,000 +10.00% 98
Yorkshire +9 31 £42,500 -5.56% 38
North East +15 13 £35,000 -30.00% 13
Validation
UK

Validation
Co-occurring Skills and Capabilities in England by Category

The follow tables expand on the table above by listing co-occurrences grouped by category. The same employment type, locality and period is covered with up to 20 co-occurrences shown in each of the following categories:

Application Platforms
1 19 (1.23%) Apache Spark
2 17 (1.10%) Confluence
3 14 (0.91%) Apache Airflow
4 10 (0.65%) SugarCRM
5 7 (0.45%) Apache
6 5 (0.32%) CMS
6 5 (0.32%) SAS
7 3 (0.19%) Jupyter
8 2 (0.13%) TPMS
9 1 (0.065%) Adobe Experience Manager
9 1 (0.065%) Apache Superset
9 1 (0.065%) FileNet
9 1 (0.065%) Luigi
9 1 (0.065%) Microsoft Exchange
9 1 (0.065%) MTS
9 1 (0.065%) SharePoint
Applications
1 50 (3.24%) Simulink
2 37 (2.40%) Microsoft Excel
2 37 (2.40%) Microsoft Office
3 20 (1.30%) MS Visio
4 16 (1.04%) Mathcad
5 8 (0.52%) Microsoft PowerPoint
6 2 (0.13%) AutoCAD
6 2 (0.13%) Revit
6 2 (0.13%) Spreadsheet
7 1 (0.065%) Adobe Illustrator
7 1 (0.065%) CANalyzer
7 1 (0.065%) Civil 3D
7 1 (0.065%) Doxygen
7 1 (0.065%) GNU Octave
7 1 (0.065%) Navisworks
7 1 (0.065%) Oracle Smart View
7 1 (0.065%) Photoshop
Business Applications
1 22 (1.43%) Oracle EBS
1 22 (1.43%) SAP S/4HANA
2 6 (0.39%) Oracle Procure-to-Pay
3 5 (0.32%) Oracle Assets
3 5 (0.32%) Oracle Cash Management
3 5 (0.32%) Oracle General Ledger
3 5 (0.32%) Oracle Payables
3 5 (0.32%) Oracle Receivables
4 4 (0.26%) Oracle ERP
4 4 (0.26%) Sparx Enterprise Architect
5 3 (0.19%) Oracle Financials
6 2 (0.13%) NetSuite
7 1 (0.065%) Aladdin
7 1 (0.065%) Dynamics CRM
7 1 (0.065%) Endur
7 1 (0.065%) Primavera
7 1 (0.065%) Remedy ITSM
7 1 (0.065%) SAP Business One
7 1 (0.065%) SAP CX
7 1 (0.065%) SAP WM
Cloud Services
1 106 (6.88%) Azure
2 99 (6.42%) AWS
3 69 (4.48%) Power Platform
4 50 (3.24%) GCP
5 39 (2.53%) Snowflake
6 21 (1.36%) Amazon S3
7 18 (1.17%) Serverless
8 16 (1.04%) Azure DevOps
8 16 (1.04%) SaaS
9 15 (0.97%) AWS Lambda
10 14 (0.91%) AWS CloudFormation
11 13 (0.84%) GitHub
12 12 (0.78%) Amazon SageMaker
13 11 (0.71%) Microsoft 365
13 11 (0.71%) Microsoft Purview
14 10 (0.65%) Azure Data Factory
15 9 (0.58%) dbt
16 8 (0.52%) Amazon EKS
16 8 (0.52%) Azure Synapse Analytics
16 8 (0.52%) Pulumi
Communications & Networking
1 739 (47.96%) 5G
2 732 (47.50%) Wi-Fi
2 732 (47.50%) Wireless
3 730 (47.37%) Bluetooth
3 730 (47.37%) GSM
3 730 (47.37%) LTE
3 730 (47.37%) UMTS
4 17 (1.10%) Ethernet
4 17 (1.10%) LAN
5 13 (0.84%) Firewall
5 13 (0.84%) Modbus
5 13 (0.84%) WAN
6 12 (0.78%) Profibus
7 8 (0.52%) Ethernet VPN
7 8 (0.52%) Network Security
8 7 (0.45%) DNS
8 7 (0.45%) Internet
9 6 (0.39%) DHCP
9 6 (0.39%) SD-WAN
10 5 (0.32%) Unified Communications
Database & Business Intelligence
1 65 (4.22%) Power BI
2 53 (3.44%) Data Warehouse
3 43 (2.79%) Tableau
4 33 (2.14%) Metadata
5 32 (2.08%) Data Lake
6 25 (1.62%) SQL Server
7 24 (1.56%) Oracle ODI
8 22 (1.43%) Big Data
9 19 (1.23%) BigQuery
10 14 (0.91%) NoSQL
11 11 (0.71%) PostgreSQL
11 11 (0.71%) Relational Database
12 10 (0.65%) MySQL
13 9 (0.58%) Amazon Athena
14 8 (0.52%) Amazon Aurora
15 7 (0.45%) MongoDB
16 6 (0.39%) Amazon Redshift
16 6 (0.39%) Delta Lake
16 6 (0.39%) Looker
16 6 (0.39%) Spark SQL
Development Applications
1 49 (3.18%) Git
2 47 (3.05%) JIRA
3 24 (1.56%) Jenkins
4 22 (1.43%) Rational DOORS
5 13 (0.84%) Postman
5 13 (0.84%) Selenium
6 9 (0.58%) GitLab
7 6 (0.39%) JMeter
7 6 (0.39%) MLflow
7 6 (0.39%) Rational Rhapsody
7 6 (0.39%) SoapUI
8 5 (0.32%) Cypress.io
8 5 (0.32%) SonarQube
9 4 (0.26%) Locust
9 4 (0.26%) Robot Framework
9 4 (0.26%) Spinnaker
9 4 (0.26%) TestNG
9 4 (0.26%) webpack
10 3 (0.19%) Charles Proxy
10 3 (0.19%) Sonatype Nexus
General
1 786 (51.01%) Electronics
2 262 (17.00%) Social Skills
3 200 (12.98%) Finance
4 136 (8.83%) Analytical Skills
5 83 (5.39%) Law
6 56 (3.63%) Manufacturing
7 44 (2.86%) Marketing
8 40 (2.60%) Documentation Skills
9 38 (2.47%) Organisational Skills
10 33 (2.14%) Pharmaceutical
11 32 (2.08%) Presentation Skills
12 31 (2.01%) Banking
12 31 (2.01%) Inclusion and Diversity
12 31 (2.01%) Retail
13 29 (1.88%) Aerospace
14 28 (1.82%) Public Sector
15 27 (1.75%) Influencing Skills
16 24 (1.56%) Telecoms
17 19 (1.23%) Billing
17 19 (1.23%) Financial Institution
Job Titles
1 755 (48.99%) Test Engineer
2 738 (47.89%) Electronics Engineer
3 731 (47.44%) Electronics Test Engineer
4 126 (8.18%) Senior
5 107 (6.94%) Analyst
6 104 (6.75%) Lead
7 73 (4.74%) Systems Engineer
8 42 (2.73%) Data Engineer
9 41 (2.66%) Data Analyst
10 32 (2.08%) Business Analyst
11 29 (1.88%) Administrator
11 29 (1.88%) Support Engineer
12 27 (1.75%) Consultant
12 27 (1.75%) Software Engineer
13 25 (1.62%) Developer
14 24 (1.56%) Applications Support
14 24 (1.56%) Data Quality Analyst
14 24 (1.56%) Quality Analyst
15 23 (1.49%) Applications Engineer
15 23 (1.49%) Team Leader
Libraries, Frameworks & Software Standards
1 25 (1.62%) Oracle Fusion
2 17 (1.10%) Kafka
3 14 (0.91%) JSON
3 14 (0.91%) XML
4 13 (0.84%) scikit-learn
5 11 (0.71%) Pandas
5 11 (0.71%) PySpark
5 11 (0.71%) TensorFlow
6 10 (0.65%) HTML
6 10 (0.65%) PyTorch
6 10 (0.65%) REST
7 9 (0.58%) CSS
7 9 (0.58%) Middleware
8 8 (0.52%) Loki
9 7 (0.45%) pytest
9 7 (0.45%) Qt
9 7 (0.45%) React
9 7 (0.45%) YAML
10 6 (0.39%) Apache NiFi
10 6 (0.39%) NumPy
Miscellaneous
1 737 (47.83%) Driving Licence
2 58 (3.76%) Management Information System
3 36 (2.34%) Self-Motivation
4 34 (2.21%) Data Structures
5 32 (2.08%) Life Science
5 32 (2.08%) Operational Technology
6 28 (1.82%) Algorithms
6 28 (1.82%) Legacy Systems
7 23 (1.49%) Product Ownership
8 22 (1.43%) Onboarding
8 22 (1.43%) SCADA
9 14 (0.91%) Embedded Systems
10 12 (0.78%) Credit Risk
11 10 (0.65%) e-Learning
12 9 (0.58%) Biopharmaceutical
13 8 (0.52%) Cloud Native
13 8 (0.52%) FPGA
13 8 (0.52%) IoT
14 7 (0.45%) Foreign Exchange (FX)
14 7 (0.45%) Hybrid Cloud
Operating Systems
1 32 (2.08%) Windows
2 27 (1.75%) Linux
3 15 (0.97%) Windows Server
4 7 (0.45%) Windows Server 2016
5 5 (0.32%) Unix
5 5 (0.32%) Windows 10
5 5 (0.32%) Windows Server 2019
6 3 (0.19%) Red Hat Enterprise Linux
6 3 (0.19%) VMS
7 2 (0.13%) FreeRTOS
8 1 (0.065%) AIX
8 1 (0.065%) Android
8 1 (0.065%) Apple iOS
8 1 (0.065%) Embedded Linux
8 1 (0.065%) Ubuntu
Processes & Methodologies
1 848 (55.03%) Verification and Validation
2 812 (52.69%) Mentoring
3 749 (48.60%) Customer Requirements
3 749 (48.60%) Test Strategy
4 741 (48.09%) Coaching
5 199 (12.91%) Problem-Solving
6 178 (11.55%) Agile
7 134 (8.70%) Analytics
8 127 (8.24%) Data Validation
9 118 (7.66%) ETL
10 114 (7.40%) Migration
11 104 (6.75%) Stakeholder Management
12 89 (5.78%) Continuous Improvement
12 89 (5.78%) Software Engineering
13 88 (5.71%) Data Management
14 87 (5.65%) Systems Engineering
15 80 (5.19%) Data Pipeline
16 79 (5.13%) Decision-Making
17 78 (5.06%) Test Automation
18 77 (5.00%) Business Intelligence
Programming Languages
1 201 (13.04%) Python
2 173 (11.23%) SQL
3 56 (3.63%) MATLAB
4 36 (2.34%) C
5 28 (1.82%) PL/SQL
6 27 (1.75%) C++
7 24 (1.56%) Java
8 18 (1.17%) R
9 14 (0.91%) Bash
9 14 (0.91%) JavaScript
10 12 (0.78%) Ladder Logic
10 12 (0.78%) PowerShell
11 10 (0.65%) TypeScript
12 9 (0.58%) C#
13 8 (0.52%) Go
13 8 (0.52%) Shell Script
13 8 (0.52%) T-SQL
14 6 (0.39%) Scala
14 6 (0.39%) SPARQL
15 4 (0.26%) Perl
Qualifications
1 1,011 (65.61%) Degree
2 751 (48.73%) HND
3 67 (4.35%) Security Cleared
4 58 (3.76%) BPSS Clearance
5 51 (3.31%) Master's Degree
6 46 (2.99%) SC Cleared
7 32 (2.08%) HNC
8 31 (2.01%) Computer Science Degree
9 26 (1.69%) Cisco Certification
10 21 (1.36%) PhD
11 14 (0.91%) CCNA
11 14 (0.91%) CCNP
11 14 (0.91%) Microsoft Certification
12 10 (0.65%) Network+ Certification
13 9 (0.58%) ACCA
13 9 (0.58%) CCIE
13 9 (0.58%) DV Cleared
14 7 (0.45%) AWS Certification
14 7 (0.45%) ISTQB
14 7 (0.45%) Numerate Degree
Quality Assurance & Compliance
1 134 (8.70%) Data Quality
2 102 (6.62%) QA
3 53 (3.44%) GxP
4 46 (2.99%) Accessibility
5 27 (1.75%) SLA
6 24 (1.56%) ISO/IEC 15288
7 21 (1.36%) GDPR
8 14 (0.91%) 21 CFR Part 11
9 9 (0.58%) NIST
10 8 (0.52%) ISO/IEC 27001
11 7 (0.45%) Good Clinical Practice
12 6 (0.39%) GMP
12 6 (0.39%) HIPAA
12 6 (0.39%) IFRS
12 6 (0.39%) IFRS 9
12 6 (0.39%) ISO 20022
12 6 (0.39%) ISO/IEC 12207
12 6 (0.39%) PMO
12 6 (0.39%) SEPA
13 5 (0.32%) ISO 26262
System Software
1 30 (1.95%) VMware Infrastructure
2 27 (1.75%) Docker
3 20 (1.30%) Firmware
4 16 (1.04%) Active Directory
5 5 (0.32%) Virtual Machines
5 5 (0.32%) VMware ESXi
5 5 (0.32%) vSphere
6 4 (0.26%) Embedded Firmware
6 4 (0.26%) vCloud
7 3 (0.19%) Apache Flume
7 3 (0.19%) HDFS
8 2 (0.13%) DFS Replication
8 2 (0.13%) Microsoft Virtual Server
8 2 (0.13%) Virtual Servers
9 1 (0.065%) Dovecot
9 1 (0.065%) Postfix
9 1 (0.065%) Virtual Desktop
Systems Management
1 30 (1.95%) Kubernetes
2 21 (1.36%) Terraform
3 18 (1.17%) Grafana
4 15 (0.97%) Ansible
5 10 (0.65%) Prometheus
6 5 (0.32%) Functional Safety
6 5 (0.32%) Kubeflow
6 5 (0.32%) vCenter Server
7 4 (0.26%) Docker Swarm
7 4 (0.26%) Progress Chef
7 4 (0.26%) Rundeck
8 3 (0.19%) Kibana
8 3 (0.19%) logstash
8 3 (0.19%) Oozie
9 2 (0.13%) Argo
9 2 (0.13%) Microsoft Intune
9 2 (0.13%) Puppet
9 2 (0.13%) SCOM
10 1 (0.065%) Nessus
Vendors
1 69 (4.48%) Microsoft
2 46 (2.99%) Oracle
3 38 (2.47%) SAP
4 34 (2.21%) VMware
5 28 (1.82%) Salesforce
6 26 (1.69%) Cisco
7 16 (1.04%) Databricks
7 16 (1.04%) MathWorks
8 15 (0.97%) IBM
8 15 (0.97%) ServiceNow
9 13 (0.84%) Allen-Bradley
9 13 (0.84%) CheckPoint
9 13 (0.84%) F5
9 13 (0.84%) Siemens
10 12 (0.78%) Rockwell
11 10 (0.65%) Informatica
11 10 (0.65%) Red Hat
12 9 (0.58%) Splunk
12 9 (0.58%) Talend
13 8 (0.52%) Hitachi