Embedded C
UK
The table below provides summary statistics and salary benchmarking for jobs requiring Embedded C skills. It covers permanent job vacancies from the 6 months leading up to 17 February 2026, with comparisons to the same periods in the previous two years.
| 6 months to 17 Feb 2026 |
Same period 2025 | Same period 2024 | |
|---|---|---|---|
| Rank | 612 | 589 | 553 |
| Rank change year-on-year | -23 | -36 | +294 |
| Permanent jobs citing Embedded C | 60 | 105 | 250 |
| As % of all permanent jobs in the UK | 0.089% | 0.21% | 0.33% |
| As % of the Programming Languages category | 0.48% | 0.62% | 0.90% |
| Number of salaries quoted | 60 | 43 | 219 |
| 10th Percentile | £45,000 | £42,750 | £29,700 |
| 25th Percentile | £45,750 | £47,500 | £42,500 |
| Median annual salary (50th Percentile) | £55,000 | £55,000 | £52,500 |
| Median % change year-on-year | - | +4.76% | -4.55% |
| 75th Percentile | £65,000 | £65,000 | £62,500 |
| 90th Percentile | £67,500 | £67,500 | £80,000 |
| UK excluding London median annual salary | £55,000 | £55,000 | £52,500 |
| % change year-on-year | - | +4.76% | -4.55% |
All Programming Languages
UK
Embedded C falls under the Programming Languages category. For comparison with the information above, the following table provides summary statistics for all permanent job vacancies requiring coding skills.
| Permanent vacancies with a requirement for coding skills | 12,606 | 16,872 | 27,761 |
| As % of all permanent jobs advertised in the UK | 18.69% | 34.43% | 37.04% |
| Number of salaries quoted | 9,023 | 9,993 | 22,876 |
| 10th Percentile | £33,750 | £38,300 | £36,250 |
| 25th Percentile | £46,250 | £48,869 | £45,000 |
| Median annual salary (50th Percentile) | £62,500 | £65,000 | £60,000 |
| Median % change year-on-year | -3.85% | +8.33% | -7.69% |
| 75th Percentile | £83,250 | £85,000 | £80,000 |
| 90th Percentile | £100,000 | £110,000 | £100,000 |
| UK excluding London median annual salary | £55,000 | £57,500 | £55,000 |
| % change year-on-year | -4.35% | +4.55% | - |
Embedded C
Job Vacancy Trend
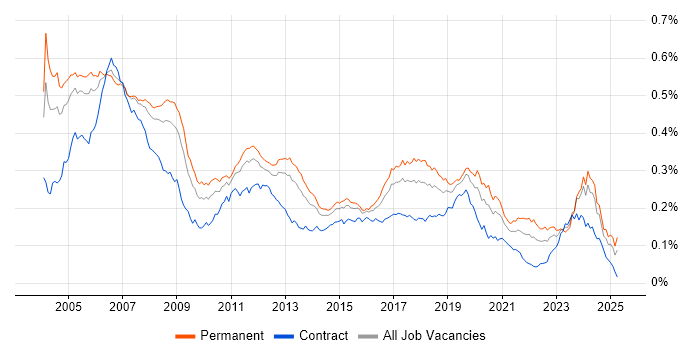
Historical trend showing the proportion of permanent IT job postings citing Embedded C relative to all permanent IT jobs advertised.

Embedded C
Salary Trend
Salary distribution trend for jobs in the UK citing Embedded C.

Embedded C
Salary Histogram
Salary distribution for jobs citing Embedded C over the 6 months to 17 February 2026.
Embedded C
Top 16 Job Locations
The table below looks at the demand and provides a guide to the median salaries quoted in IT jobs citing Embedded C within the UK over the 6 months to 17 February 2026. The 'Rank Change' column provides an indication of the change in demand within each location based on the same 6 month period last year.
| Location | Rank Change on Same Period Last Year |
Matching Permanent IT Job Ads |
Median Salary Past 6 Months |
Median Salary % Change on Same Period Last Year |
Live Jobs |
|---|---|---|---|---|---|
| UK excluding London | -34 | 53 | £55,000 | - | 77 |
| England | -8 | 44 | £55,000 | +1.85% | 71 |
| Work from Home | +63 | 33 | £55,000 | -8.33% | 25 |
| North of England | -10 | 16 | £50,750 | +1.50% | 11 |
| Scotland | -7 | 11 | £65,000 | +1.96% | 7 |
| North West | +16 | 9 | £46,500 | +16.25% | 2 |
| South East | -2 | 9 | £55,000 | - | 18 |
| East of England | +11 | 7 | £45,000 | -16.67% | 10 |
| Midlands | +5 | 6 | £54,000 | +0.47% | 17 |
| Yorkshire | -39 | 6 | £55,000 | -2.22% | 8 |
| East Midlands | -9 | 4 | £54,000 | -6.09% | 11 |
| London | +28 | 3 | £65,000 | - | 4 |
| South West | -31 | 3 | £50,000 | -4.76% | 14 |
| West Midlands | +14 | 2 | £62,500 | +25.00% | 6 |
| Wales | -5 | 1 | £45,000 | +27.66% | 4 |
| North East | -10 | 1 | £40,000 | - | 1 |
Embedded C
Co-Occurring Skills & Capabilities by Category
The following tables expand on the one above by listing co-occurrences grouped by category. They cover the same employment type, locality and period, with up to 20 co-occurrences shown in each category:
