Master's Degree Jobs in England

Master's Degree
UK > England

The table below provides summary statistics for permanent job vacancies advertised in England with a requirement for Master's Degree qualifications. It includes a benchmarking guide to the salaries offered over the 6 months leading up to 1 May 2025, comparing them to the same period in the previous two years.

6 months to
1 May 2025
Same period 2024 Same period 2023
Rank 58 174 59
Rank change year-on-year +116 -115 +150
Permanent jobs citing Master's Degree 1,947 1,404 4,607
As % of all permanent jobs advertised in England 4.23% 1.65% 4.98%
As % of the Qualifications category 8.47% 5.77% 15.25%
Number of salaries quoted 532 764 747
10th Percentile £45,000 £33,750 £34,373
25th Percentile £56,813 £47,500 £45,000
Median annual salary (50th Percentile) £69,315 £65,000 £62,500
Median % change year-on-year +6.64% +4.00% -10.71%
75th Percentile £83,750 £85,000 £87,500
90th Percentile £120,000 £110,875 £122,750
UK median annual salary £69,315 £65,000 £62,500
% change year-on-year +6.64% +4.00% -10.71%

All Academic and Professional Certifications
England

Master's Degree falls under the Academic Qualifications and Professional Certifications category. For comparison with the information above, the following table provides summary statistics for all permanent job vacancies requiring academic qualifications or professional certifications in England.

Permanent vacancies requiring academic qualifications or professional certifications 22,991 24,349 30,200
As % of all permanent jobs advertised in England 49.92% 28.58% 32.64%
Number of salaries quoted 10,025 15,815 13,648
10th Percentile £32,500 £28,250 £31,250
25th Percentile £43,500 £38,500 £42,000
Median annual salary (50th Percentile) £55,000 £55,000 £58,193
Median % change year-on-year - -5.49% +5.81%
75th Percentile £68,750 £71,250 £77,500
90th Percentile £85,700 £87,500 £95,000
UK median annual salary £55,000 £54,000 £58,000
% change year-on-year +1.85% -6.90% +5.45%

Master's Degree
Job Vacancy Trend in England

Job postings citing Master's Degree as a proportion of all IT jobs advertised in England.
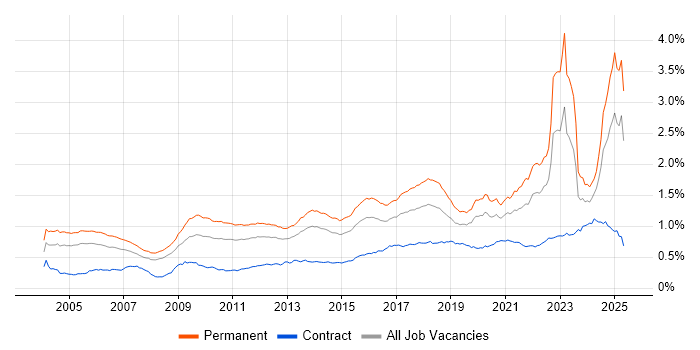
Job vacancy trend for Master's Degree in England

Master's Degree
Salary Trend in England

3-month moving average salary quoted in jobs citing Master's Degree in England.

Salary trend for Master's Degree in England

Master's Degree
Salary Histogram in England

Salary distribution for jobs citing Master's Degree in England over the 6 months to 1 May 2025.

Salary histogram for Master's Degree in England

Master's Degree
Job Locations in England

The table below looks at the demand and provides a guide to the median salaries quoted in IT jobs citing Master's Degree within the England region over the 6 months to 1 May 2025. The 'Rank Change' column provides an indication of the change in demand within each location based on the same 6 month period last year.

Location Rank Change
on Same Period
Last Year
Matching
Permanent
IT Job Ads
Median Salary
Past 6 Months
Median Salary
% Change
on Same Period
Last Year
Live
Jobs
London +53 748 £90,000 +12.50% 1,289
North of England +229 593 £69,315 +38.63% 198
North West +169 457 £69,315 +6.64% 105
South East +62 249 £55,565 -7.39% 418
East of England +60 123 £64,743 +17.71% 194
Midlands +89 116 £31,000 -43.64% 149
Yorkshire +149 113 £45,000 -10.00% 66
South West +106 109 £50,000 - 130
East Midlands +78 69 £67,500 +9.87% 64
West Midlands +39 47 £23,000 -52.82% 80
North East +46 23 £45,750 -8.50% 27
Master's Degree
UK

Master's Degree
Co-occurring Skills and Capabilities in England by Category

The follow tables expand on the table above by listing co-occurrences grouped by category. The same employment type, locality and period is covered with up to 20 co-occurrences shown in each of the following categories:

Application Platforms
1 15 (0.77%) Apache Spark
2 7 (0.36%) SAS
2 7 (0.36%) SharePoint
3 6 (0.31%) Microsoft Exchange
4 5 (0.26%) WordPress
5 4 (0.21%) Apache
5 4 (0.21%) Cloud Foundry
6 3 (0.15%) Jupyter
7 2 (0.10%) Apache Airflow
7 2 (0.10%) ArcGIS
7 2 (0.10%) CMS
7 2 (0.10%) Confluence
Applications
1 448 (23.01%) Microsoft PowerPoint
2 251 (12.89%) Chatbot
3 150 (7.70%) Abaqus
4 118 (6.06%) Mathcad
5 43 (2.21%) Microsoft Excel
6 14 (0.72%) Microsoft Office
7 13 (0.67%) AutoCAD
8 10 (0.51%) Microsoft Project
9 6 (0.31%) MS Visio
10 4 (0.21%) Simulink
11 3 (0.15%) SOLIDWORKS
12 2 (0.10%) Blender
12 2 (0.10%) Maya
13 1 (0.051%) Stata
13 1 (0.051%) TargetLink
13 1 (0.051%) Trello
Business Applications
1 5 (0.26%) SAP S/4HANA
2 2 (0.10%) Dynamics CRM
3 1 (0.051%) SAP CO
3 1 (0.051%) SAP ERP
3 1 (0.051%) SAP FI
3 1 (0.051%) SAP FI/CO
Cloud Services
1 126 (6.47%) Azure
2 102 (5.24%) AWS
3 51 (2.62%) GCP
4 38 (1.95%) SaaS
5 27 (1.39%) Power Platform
6 21 (1.08%) Salesforce Sales Cloud
7 20 (1.03%) Azure DevOps
7 20 (1.03%) Cloud Computing
7 20 (1.03%) PaaS
8 19 (0.98%) Amazon EC2
9 13 (0.67%) Adobe Analytics
10 11 (0.56%) Serverless
11 8 (0.41%) Amazon S3
11 8 (0.41%) Azure Synapse Analytics
11 8 (0.41%) Dynamics 365
12 7 (0.36%) Azure Data Factory
12 7 (0.36%) Microsoft 365
13 6 (0.31%) AWS Lambda
13 6 (0.31%) Dialogflow
13 6 (0.31%) PowerApps
Communications & Networking
1 26 (1.34%) Firewall
2 25 (1.28%) Wireless
3 23 (1.18%) Internet
4 20 (1.03%) WAN
5 19 (0.98%) LAN
6 15 (0.77%) Intrusion Detection
7 8 (0.41%) TCP/IP
8 6 (0.31%) DNS
8 6 (0.31%) HTTP
9 5 (0.26%) 5G
9 5 (0.26%) Network Security
10 4 (0.21%) 2G
10 4 (0.21%) 3G
10 4 (0.21%) 4G
10 4 (0.21%) Ethernet
10 4 (0.21%) HTTPS
11 3 (0.15%) Broadband
11 3 (0.15%) DHCP
11 3 (0.15%) DKIM
11 3 (0.15%) VLAN
Database & Business Intelligence
1 46 (2.36%) Tableau
2 29 (1.49%) PostgreSQL
3 23 (1.18%) Relational Database
4 21 (1.08%) NoSQL
5 18 (0.92%) Power BI
6 17 (0.87%) Big Data
7 15 (0.77%) Hadoop
8 14 (0.72%) SQL Server
9 11 (0.56%) Data Warehouse
10 10 (0.51%) Data Lake
11 9 (0.46%) Amazon Redshift
12 8 (0.41%) MySQL
13 7 (0.36%) Apache Hive
13 7 (0.36%) MongoDB
14 5 (0.26%) GIS
14 5 (0.26%) Neo4j
15 4 (0.21%) Metadata
15 4 (0.21%) RDBMS
16 3 (0.15%) Data Mining
16 3 (0.15%) SQL Server Integration Services
Development Applications
1 51 (2.62%) Git
2 18 (0.92%) JIRA
3 14 (0.72%) IntelliJ
4 9 (0.46%) Jenkins
5 8 (0.41%) Moq
5 8 (0.41%) Selenium
5 8 (0.41%) SpecFlow
6 7 (0.36%) Burp Suite
7 6 (0.31%) Cypress.io
7 6 (0.31%) GitLab
8 5 (0.26%) Gatling
8 5 (0.26%) JMeter
9 4 (0.21%) JUnit
9 4 (0.21%) Postman
9 4 (0.21%) REST Assured
9 4 (0.21%) TestCafe
9 4 (0.21%) TestNG
10 3 (0.15%) MLflow
11 2 (0.10%) Babel
11 2 (0.10%) webpack
General
1 975 (50.08%) Analytical Skills
2 832 (42.73%) Social Skills
3 637 (32.72%) Finance
4 492 (25.27%) Inclusion and Diversity
5 479 (24.60%) Banking
6 427 (21.93%) Financial Institution
7 423 (21.73%) French Language
8 421 (21.62%) German Language
9 169 (8.68%) Manufacturing
10 124 (6.37%) Law
11 85 (4.37%) Electronics
12 65 (3.34%) Marketing
13 60 (3.08%) Legal
14 50 (2.57%) Presentation Skills
15 46 (2.36%) Agriculture
16 30 (1.54%) Pharmaceutical
17 27 (1.39%) Aerospace
17 27 (1.39%) Telecoms
18 23 (1.18%) Organisational Skills
18 23 (1.18%) Public Sector
Job Titles
1 543 (27.89%) Analyst
2 421 (21.62%) Credit Analyst
2 421 (21.62%) Research Analyst
3 380 (19.52%) Senior
4 253 (12.99%) Trainer
5 142 (7.29%) Engineering Manager
6 121 (6.21%) Commissioning Manager
7 118 (6.06%) Engineering Specialist
7 118 (6.06%) Senior Data Warehouse Specialist
8 68 (3.49%) Lead
9 62 (3.18%) Principal Engineer
10 60 (3.08%) Senior Electrical Engineer
11 56 (2.88%) Architect
12 52 (2.67%) Developer
13 46 (2.36%) Data Scientist
14 39 (2.00%) Senior Manager
15 38 (1.95%) Software Engineer
16 36 (1.85%) Graduate
17 33 (1.69%) Data Analyst
18 30 (1.54%) Data Engineer
Libraries, Frameworks & Software Standards
1 57 (2.93%) REST
2 43 (2.21%) Pandas
3 42 (2.16%) PyTorch
4 40 (2.05%) NumPy
5 38 (1.95%) TensorFlow
6 37 (1.90%) .NET
7 36 (1.85%) React
8 24 (1.23%) SOAP
9 23 (1.18%) scikit-learn
9 23 (1.18%) SciPy
10 21 (1.08%) Lightning Web Components
10 21 (1.08%) Middleware
11 19 (0.98%) OpenCV
12 18 (0.92%) AngularJS
13 17 (0.87%) HTML
14 16 (0.82%) CSS
15 14 (0.72%) .NET Framework
15 14 (0.72%) ARM Templates
15 14 (0.72%) YAML
16 12 (0.62%) .NET Core
Miscellaneous
1 441 (22.65%) Credit Risk
2 421 (21.62%) Fixed Income
3 122 (6.27%) Algorithms
4 63 (3.24%) Self-Motivation
5 50 (2.57%) Management Information System
6 44 (2.26%) Virtual Team
7 31 (1.59%) Social Media
8 30 (1.54%) Robotics
9 29 (1.49%) Security Posture
10 28 (1.44%) Enterprise Software
10 28 (1.44%) Team-Oriented Environment
11 24 (1.23%) Analytical Mindset
12 23 (1.18%) Learning Management System
13 21 (1.08%) Life Science
14 17 (0.87%) Mobile App
15 14 (0.72%) Molecular Biology
16 12 (0.62%) FMCG
16 12 (0.62%) Hackathon
16 12 (0.62%) Reinsurance
17 10 (0.51%) Data Structures
Operating Systems
1 58 (2.98%) Windows
2 34 (1.75%) Linux
3 28 (1.44%) Windows Vista
4 11 (0.56%) Unix
5 5 (0.26%) Android
5 5 (0.26%) Debian
5 5 (0.26%) Robot Operating System
6 4 (0.21%) Apple iOS
6 4 (0.21%) Windows Server
7 3 (0.15%) Mac OS X
8 2 (0.10%) Mac OS
8 2 (0.10%) Red Hat Enterprise Linux
8 2 (0.10%) VMS
9 1 (0.051%) Android TV
9 1 (0.051%) Ubuntu
Processes & Methodologies
1 579 (29.74%) Decision-Making
2 482 (24.76%) Business Strategy
3 478 (24.55%) Risk Management
4 438 (22.50%) Asset Management
5 431 (22.14%) Risk Assessment
6 429 (22.03%) Financial Modelling
7 424 (21.78%) Portfolio Management
8 422 (21.67%) Credit Risk Analysis
9 412 (21.16%) Artificial Intelligence
10 370 (19.00%) Computer Science
11 282 (14.48%) Problem-Solving
12 252 (12.94%) Conversational UI
13 232 (11.92%) Mathematics
14 203 (10.43%) Analytics
15 179 (9.19%) Data Science
15 179 (9.19%) Statistics
16 177 (9.09%) Agile
17 169 (8.68%) CAD
18 160 (8.22%) Finite Element Analysis
19 149 (7.65%) Physics
Programming Languages
1 293 (15.05%) Python
2 103 (5.29%) SQL
3 96 (4.93%) Java
4 76 (3.90%) C#
5 65 (3.34%) C++
6 39 (2.00%) JavaScript
7 26 (1.34%) Scala
8 25 (1.28%) C
9 22 (1.13%) PowerShell
10 21 (1.08%) Apex Code
11 17 (0.87%) MATLAB
11 17 (0.87%) R
12 16 (0.82%) Kotlin
13 15 (0.77%) Fortran
14 13 (0.67%) Bash
15 11 (0.56%) TypeScript
16 8 (0.41%) VBA
17 7 (0.36%) Perl
18 4 (0.21%) Objective-C
19 3 (0.15%) F#
Qualifications
1 1,947 (100.00%) Degree
2 499 (25.63%) BPSS Clearance
3 465 (23.88%) PhD
4 423 (21.73%) CFA
5 342 (17.57%) Chartered Engineer
6 211 (10.84%) MBA
7 153 (7.86%) HND
8 149 (7.65%) Computer Science Degree
9 46 (2.36%) DBS Check
10 45 (2.31%) Security Cleared
11 36 (1.85%) PMI Certification
12 34 (1.75%) PMP
13 33 (1.69%) SC Cleared
14 24 (1.23%) CISSP
15 20 (1.03%) CISM
16 19 (0.98%) CEH
16 19 (0.98%) Cisco Certification
17 17 (0.87%) CBAP
17 17 (0.87%) CISA
18 14 (0.72%) AWS Certification
Quality Assurance & Compliance
1 56 (2.88%) Data Quality
2 45 (2.31%) Def Stans
2 45 (2.31%) IEC 61508
3 39 (2.00%) NIST
4 37 (1.90%) ISO/IEC 27001
5 27 (1.39%) Accessibility
5 27 (1.39%) GDPR
6 18 (0.92%) QA
7 15 (0.77%) NCSC
8 6 (0.31%) CDISC
9 4 (0.21%) HIPAA
9 4 (0.21%) PCI DSS
10 3 (0.15%) Actionable Recommendations
10 3 (0.15%) California Consumer Privacy Act
10 3 (0.15%) NIST 800
11 2 (0.10%) 21 CFR Part 11
11 2 (0.10%) GMP
11 2 (0.10%) GRC
11 2 (0.10%) ISO 9001
11 2 (0.10%) PMO
System Software
1 59 (3.03%) Docker
2 5 (0.26%) Active Directory
2 5 (0.26%) Virtual Machines
3 4 (0.21%) Hyper-V
4 3 (0.15%) HDFS
5 1 (0.051%) Firmware
5 1 (0.051%) KVM
5 1 (0.051%) VMware Infrastructure
Systems Management
1 58 (2.98%) Kubernetes
2 24 (1.23%) Terraform
3 5 (0.26%) Single Sign-On
4 4 (0.21%) Ansible
4 4 (0.21%) Grafana
4 4 (0.21%) Prometheus
5 2 (0.10%) Hadoop YARN
5 2 (0.10%) Nmap
6 1 (0.051%) Bugsnag
6 1 (0.051%) Functional Safety
6 1 (0.051%) Istio
6 1 (0.051%) Kubeflow
6 1 (0.051%) RSA Archer
Vendors
1 424 (21.78%) Bloomberg
2 244 (12.53%) PayPal
3 95 (4.88%) Microsoft
4 45 (2.31%) Google
5 29 (1.49%) Databricks
6 27 (1.39%) Salesforce
7 21 (1.08%) Salesforce Marketing Cloud
8 20 (1.03%) YouTube
9 19 (0.98%) Unisys
10 17 (0.87%) SAP
11 14 (0.72%) IBM
12 13 (0.67%) Adobe
13 12 (0.62%) Capita
14 7 (0.36%) EMC
14 7 (0.36%) Informatica
14 7 (0.36%) Omniture
15 4 (0.21%) Atlassian
15 4 (0.21%) Saba
15 4 (0.21%) ServiceNow
15 4 (0.21%) Workday