Logistics Jobs in England

Logistics
UK > England

The table below provides summary statistics for permanent job vacancies advertised in England requiring Logistics skills. It includes a benchmarking guide to the annual salaries offered in vacancies that cited Logistics over the 6 months leading up to 2 July 2025, comparing them to the same period in the previous two years.

6 months to
2 Jul 2025
Same period 2024 Same period 2023
Rank 235 119 262
Rank change year-on-year -116 +143 +13
Permanent jobs citing Logistics 742 2,068 1,062
As % of all permanent jobs advertised in England 1.45% 2.20% 1.34%
As % of the Processes & Methodologies category 1.58% 2.66% 1.41%
Number of salaries quoted 372 876 404
10th Percentile £28,550 £24,500 £31,250
25th Percentile £32,375 £30,438 £37,500
Median annual salary (50th Percentile) £50,000 £45,000 £53,000
Median % change year-on-year +11.11% -15.09% +6.00%
75th Percentile £72,750 £60,063 £75,000
90th Percentile £89,750 £72,500 £95,000
UK median annual salary £50,000 £45,000 £53,500
% change year-on-year +11.11% -15.89% +1.90%

All Process and Methodology Skills
England

Logistics falls under the Processes and Methodologies category. For comparison with the information above, the following table provides summary statistics for all permanent job vacancies requiring process or methodology skills in England.

Permanent vacancies with a requirement for process or methodology skills 46,845 77,718 75,371
As % of all permanent jobs advertised in England 91.63% 82.55% 95.31%
Number of salaries quoted 24,324 55,094 47,411
10th Percentile £28,000 £29,500 £33,750
25th Percentile £40,000 £40,000 £45,228
Median annual salary (50th Percentile) £56,000 £55,000 £62,500
Median % change year-on-year +1.82% -12.00% +4.17%
75th Percentile £75,000 £72,500 £82,500
90th Percentile £97,500 £93,750 £102,500
UK median annual salary £55,000 £55,000 £60,331
% change year-on-year - -8.84% +0.55%

Logistics
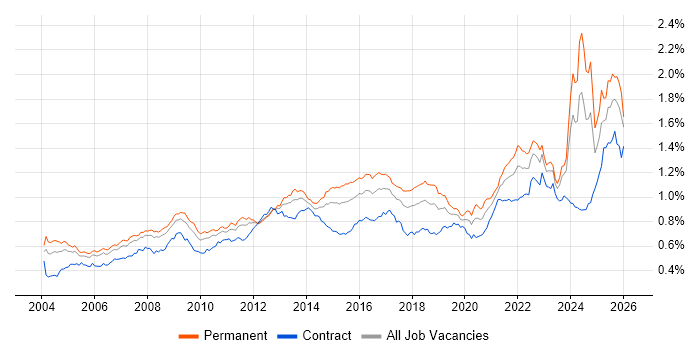
Job Vacancy Trend in England

Job postings citing Logistics as a proportion of all IT jobs advertised in England.

Job vacancy trend for Logistics in England

Logistics
Salary Trend in England

3-month moving average salary quoted in jobs citing Logistics in England.

Salary trend for Logistics in England

Logistics
Salary Histogram in England

Salary distribution for jobs citing Logistics in England over the 6 months to 2 July 2025.

Salary histogram for Logistics in England

Logistics
Job Locations in England

The table below looks at the demand and provides a guide to the median salaries quoted in IT jobs citing Logistics within the England region over the 6 months to 2 July 2025. The 'Rank Change' column provides an indication of the change in demand within each location based on the same 6 month period last year.

Location Rank Change
on Same Period
Last Year
Matching
Permanent
IT Job Ads
Median Salary
Past 6 Months
Median Salary
% Change
on Same Period
Last Year
Live
Jobs
Midlands -62 212 £38,500 -11.49% 379
North of England -25 201 £47,500 -11.21% 402
London +6 127 £67,500 +22.73% 1,623
West Midlands -55 125 £45,000 -10.00% 203
Yorkshire +66 118 £52,500 +7.69% 146
South East -97 97 £46,250 +68.18% 475
East Midlands -56 87 £38,500 +2.67% 176
North West -90 79 £39,000 -25.71% 235
East of England +9 55 £50,000 +11.11% 230
South West +60 48 £53,000 +6.00% 202
North East +39 4 £45,000 -16.67% 21
Logistics
UK

Logistics
Co-occurring Skills and Capabilities in England by Category

The follow tables expand on the table above by listing co-occurrences grouped by category. The same employment type, locality and period is covered with up to 20 co-occurrences shown in each of the following categories:

Application Platforms
1 21 (2.83%) IBM Domino
1 21 (2.83%) Microsoft Exchange
2 14 (1.89%) SharePoint
3 11 (1.48%) CMS
4 10 (1.35%) WordPress
5 3 (0.40%) Confluence
6 2 (0.27%) Apache Spark
6 2 (0.27%) IIS
7 1 (0.13%) Apache Airflow
7 1 (0.13%) Kinematics
7 1 (0.13%) OpenEdge
Applications
1 113 (15.23%) Microsoft Excel
2 35 (4.72%) Microsoft Office
3 11 (1.48%) Microsoft PowerPoint
4 6 (0.81%) AutoCAD
5 5 (0.67%) Autodesk Inventor
6 4 (0.54%) Maya
6 4 (0.54%) Photoshop
7 3 (0.40%) Microsoft Project
8 2 (0.27%) MS Visio
9 1 (0.13%) Adobe XD
Business Applications
1 45 (6.06%) SAP S/4HANA
2 18 (2.43%) Magento
2 18 (2.43%) Shopify
3 17 (2.29%) SAP ERP
4 13 (1.75%) SAP WM
5 9 (1.21%) SAP Business One
6 8 (1.08%) Payment Gateway
6 8 (1.08%) SAP EWM
7 7 (0.94%) SAP IBP
7 7 (0.94%) SAP MM
8 6 (0.81%) Dynamics GP
8 6 (0.81%) SAP CO
8 6 (0.81%) SAP FI
8 6 (0.81%) SAP FI/CO
8 6 (0.81%) SAP FSCM
8 6 (0.81%) Sprinklr
9 5 (0.67%) Dynamics AX
9 5 (0.67%) Infor M3
9 5 (0.67%) SAP SCM
10 4 (0.54%) SAP IS-U
Cloud Services
1 56 (7.55%) Azure
2 47 (6.33%) Microsoft 365
3 34 (4.58%) AWS
3 34 (4.58%) SaaS
4 33 (4.45%) Power Platform
5 18 (2.43%) Azure DevOps
6 17 (2.29%) Dynamics 365
7 15 (2.02%) BigCommerce
7 15 (2.02%) GCP
8 12 (1.62%) Entra ID
8 12 (1.62%) OneDrive
8 12 (1.62%) Serverless
9 10 (1.35%) Amazon EC2
10 9 (1.21%) Google Analytics
11 8 (1.08%) AWS Lambda
12 7 (0.94%) GitHub
12 7 (0.94%) Power Automate
13 6 (0.81%) Boomi
13 6 (0.81%) Cloud Computing
13 6 (0.81%) MailChimp
Communications & Networking
1 23 (3.10%) Firewall
2 13 (1.75%) DHCP
2 13 (1.75%) DNS
3 12 (1.62%) Network Security
3 12 (1.62%) VoIP
4 9 (1.21%) VPN
4 9 (1.21%) WAN
5 8 (1.08%) LAN
6 5 (0.67%) VLAN
7 3 (0.40%) Wi-Fi
8 2 (0.27%) Wireless
9 1 (0.13%) 2G
9 1 (0.13%) Ethernet
9 1 (0.13%) IGMP
9 1 (0.13%) Intrusion Detection
9 1 (0.13%) RS-232
9 1 (0.13%) RS-485
9 1 (0.13%) TCP/IP
9 1 (0.13%) Unified Communications
9 1 (0.13%) WebEx
Database & Business Intelligence
1 31 (4.18%) Power BI
2 21 (2.83%) SQL Server
3 14 (1.89%) Data Warehouse
4 11 (1.48%) Data Lake
5 10 (1.35%) Oracle Reports
5 10 (1.35%) Tableau
6 8 (1.08%) Relational Database
7 7 (0.94%) RDBMS
8 6 (0.81%) Oracle Database
8 6 (0.81%) SAP Data Services
8 6 (0.81%) SQL Server Integration Services
9 4 (0.54%) Amazon RDS
9 4 (0.54%) MongoDB
9 4 (0.54%) MySQL
9 4 (0.54%) SAP BW
10 2 (0.27%) GIS
10 2 (0.27%) Hadoop
10 2 (0.27%) HBase
10 2 (0.27%) NoSQL
10 2 (0.27%) SQL Server Reporting Services
Development Applications
1 17 (2.29%) JIRA
2 14 (1.89%) Visual Studio
3 13 (1.75%) Git
4 6 (0.81%) ER Studio
5 5 (0.67%) Postman
6 4 (0.54%) Selenium
6 4 (0.54%) Visual Studio Code
7 1 (0.13%) WebSpeed
General
1 296 (39.89%) Social Skills
2 189 (25.47%) Manufacturing
3 143 (19.27%) Marketing
4 142 (19.14%) Finance
5 119 (16.04%) Law
6 114 (15.36%) Analytical Skills
7 101 (13.61%) Retail
8 75 (10.11%) Electronics
9 43 (5.80%) Organisational Skills
10 28 (3.77%) Pharmaceutical
11 24 (3.23%) Automotive
11 24 (3.23%) Inclusion and Diversity
12 17 (2.29%) Banking
12 17 (2.29%) Presentation Skills
13 14 (1.89%) Publishing
14 12 (1.62%) Public Sector
15 10 (1.35%) Advertising
15 10 (1.35%) French Language
16 9 (1.21%) Influencing Skills
17 8 (1.08%) Legal
Job Titles
1 104 (14.02%) Principal Engineer
1 104 (14.02%) Principal Systems Engineer
2 86 (11.59%) Analyst
3 55 (7.41%) Lead
4 42 (5.66%) Coordinator
5 41 (5.53%) Developer
6 40 (5.39%) Senior
7 37 (4.99%) Systems Engineer
8 36 (4.85%) Consultant
9 34 (4.58%) Support Analyst
10 29 (3.91%) Logistics Coordinator
11 27 (3.64%) Support Engineer
12 24 (3.23%) Business Manager
12 24 (3.23%) Development Manager
12 24 (3.23%) Project Manager
13 23 (3.10%) Architect
13 23 (3.10%) IT Support
14 21 (2.83%) Business Development Manager
14 21 (2.83%) QA Manager
14 21 (2.83%) Quality Manager
Libraries, Frameworks & Software Standards
1 36 (4.85%) .NET
2 22 (2.96%) HTML
2 22 (2.96%) SAP Fiori
3 14 (1.89%) EDI
4 13 (1.75%) CSS
5 12 (1.62%) ASP.NET Web API
6 11 (1.48%) React
7 10 (1.35%) Middleware
8 9 (1.21%) .NET Framework
9 8 (1.08%) RESTful
10 7 (0.94%) AngularJS
10 7 (0.94%) XML
11 6 (0.81%) .NET Core
11 6 (0.81%) Node.js
12 5 (0.67%) Next.js
12 5 (0.67%) REST
12 5 (0.67%) Vue
12 5 (0.67%) Web Services
13 4 (0.54%) Bootstrap
13 4 (0.54%) RabbitMQ
Miscellaneous
1 31 (4.18%) FMCG
2 25 (3.37%) Onboarding
3 20 (2.70%) Management Information System
4 18 (2.43%) Greenfield Project
5 17 (2.29%) Enterprise Software
6 16 (2.16%) Driving Licence
7 15 (2.02%) EPoS
8 13 (1.75%) Product Ownership
8 13 (1.75%) Self-Motivation
8 13 (1.75%) Social Media
9 11 (1.48%) Robotics
10 8 (1.08%) Tandem
11 7 (0.94%) IoT
12 6 (0.81%) Blog
12 6 (0.81%) Operational Technology
12 6 (0.81%) Video Editing
13 5 (0.67%) Cyber Defence
13 5 (0.67%) Data Centre
13 5 (0.67%) Marketing Technology
13 5 (0.67%) Virtual Team
Operating Systems
1 36 (4.85%) Windows
2 22 (2.96%) Linux
3 16 (2.16%) Windows Server
4 8 (1.08%) Windows 10
5 6 (0.81%) Windows Server 2016
6 3 (0.40%) Android
6 3 (0.40%) Apple iOS
7 2 (0.27%) Embedded Linux
7 2 (0.27%) Unix
8 1 (0.13%) Robot Operating System
Processes & Methodologies
1 187 (25.20%) Problem-Solving
2 136 (18.33%) Collaborative Working
3 121 (16.31%) ERP
4 120 (16.17%) CRM
5 116 (15.63%) Mathematics
6 110 (14.82%) Physics
6 110 (14.82%) Systems Engineering
7 104 (14.02%) Chemistry
7 104 (14.02%) Model-Based Systems Engineering
8 94 (12.67%) Supply Chain Management
9 90 (12.13%) Line Management
10 83 (11.19%) Data Entry
11 67 (9.03%) E-Commerce
12 63 (8.49%) Customer Service
13 62 (8.36%) Project Management
14 61 (8.22%) Continuous Improvement
15 55 (7.41%) Agile
16 49 (6.60%) Decision-Making
17 47 (6.33%) Business Intelligence
18 44 (5.93%) Analytics
Programming Languages
1 72 (9.70%) SQL
2 46 (6.20%) Python
3 41 (5.53%) C#
4 27 (3.64%) JavaScript
5 23 (3.10%) PowerShell
6 17 (2.29%) ABAP
7 15 (2.02%) Java
7 15 (2.02%) TypeScript
8 11 (1.48%) C++
9 8 (1.08%) Delphi
10 7 (0.94%) PHP
11 6 (0.81%) Bash
11 6 (0.81%) PL/SQL
12 5 (0.67%) C
13 4 (0.54%) Embedded C
13 4 (0.54%) Rust
14 3 (0.40%) Embedded C++
14 3 (0.40%) Shell Script
14 3 (0.40%) VB.NET
15 2 (0.27%) COBOL
Qualifications
1 306 (41.24%) Degree
2 135 (18.19%) BPSS Clearance
3 16 (2.16%) MCP
3 16 (2.16%) Security Cleared
4 15 (2.02%) Microsoft Certification
5 14 (1.89%) Computer Science Degree
6 12 (1.62%) Master's Degree
6 12 (1.62%) SC Cleared
7 10 (1.35%) MCSA
8 7 (0.94%) ACCA
8 7 (0.94%) CIMA
8 7 (0.94%) PMI Certification
9 6 (0.81%) A+ Certification
9 6 (0.81%) NVQ Level 3
10 5 (0.67%) CISMP
10 5 (0.67%) DBS Check
10 5 (0.67%) GSEC
10 5 (0.67%) HND
10 5 (0.67%) PMP
11 4 (0.54%) MCSE
Quality Assurance & Compliance
1 30 (4.04%) QA
2 12 (1.62%) Cyber Essentials
3 10 (1.35%) GDPR
4 6 (0.81%) Actionable Recommendations
4 6 (0.81%) NIST
5 5 (0.67%) Accessibility
5 5 (0.67%) Data Quality
6 4 (0.54%) GxP
6 4 (0.54%) Sarbanes-Oxley
7 3 (0.40%) ISO/IEC 27001
7 3 (0.40%) SLA
7 3 (0.40%) Software Quality Assurance
8 2 (0.27%) COBIT
8 2 (0.27%) Cyber Essentials PLUS
8 2 (0.27%) GRC
8 2 (0.27%) PCI DSS
8 2 (0.27%) PMO
8 2 (0.27%) SOC 2
9 1 (0.13%) ISO 9001
System Software
1 32 (4.31%) Active Directory
2 16 (2.16%) Docker
3 2 (0.27%) Firmware
4 1 (0.13%) Hyper-V
Systems Management
1 17 (2.29%) Microsoft Intune
2 15 (2.02%) Kubernetes
3 7 (0.94%) Terraform
Vendors
1 177 (23.85%) SAP
2 113 (15.23%) Microsoft
3 25 (3.37%) Google
4 22 (2.96%) Salesforce
5 15 (2.02%) Oracle
6 11 (1.48%) Sage
7 10 (1.35%) Databricks
8 7 (0.94%) Facebook
8 7 (0.94%) Meraki
8 7 (0.94%) ServiceNow
9 6 (0.81%) Dell
9 6 (0.81%) IFS
9 6 (0.81%) JDA
9 6 (0.81%) NEC
9 6 (0.81%) YouTube
10 5 (0.67%) Infor
10 5 (0.67%) Veeam
11 4 (0.54%) HubSpot
11 4 (0.54%) Salesforce Marketing Cloud
11 4 (0.54%) Twitter