JIRA Jobs in England

Atlassian JIRA
UK > England

The table below provides summary statistics for permanent job vacancies advertised in England requiring JIRA skills. It includes a benchmarking guide to the annual salaries offered in vacancies that cited JIRA over the 6 months leading up to 17 July 2025, comparing them to the same period in the previous two years.

6 months to
17 Jul 2025
Same period 2024 Same period 2023
Rank 74 120 98
Rank change year-on-year +46 -22 -33
Permanent jobs citing JIRA 1,811 1,949 2,470
As % of all permanent jobs advertised in England 3.45% 2.23% 3.30%
As % of the Development Applications category 36.13% 26.16% 24.24%
Number of salaries quoted 902 1,325 1,711
10th Percentile £32,500 £33,250 £36,250
25th Percentile £45,313 £42,500 £46,350
Median annual salary (50th Percentile) £60,000 £55,000 £60,000
Median % change year-on-year +9.09% -8.33% -
75th Percentile £76,692 £70,000 £75,000
90th Percentile £95,000 £87,500 £91,250
UK median annual salary £60,000 £55,000 £60,000
% change year-on-year +9.09% -8.33% +1.69%

All Development Application Skills
England

JIRA falls under the Development Applications category. For comparison with the information above, the following table provides summary statistics for all permanent job vacancies requiring development application skills in England.

Permanent vacancies with a requirement for development application skills 5,013 7,450 10,190
As % of all permanent jobs advertised in England 9.54% 8.54% 13.63%
Number of salaries quoted 2,935 5,295 6,970
10th Percentile £37,574 £36,250 £41,250
25th Percentile £48,375 £45,000 £50,000
Median annual salary (50th Percentile) £62,500 £58,700 £65,000
Median % change year-on-year +6.47% -9.69% +4.00%
75th Percentile £77,500 £75,772 £82,500
90th Percentile £97,500 £93,750 £97,500
UK median annual salary £62,000 £57,500 £65,000
% change year-on-year +7.83% -11.54% +4.00%

JIRA
Job Vacancy Trend in England

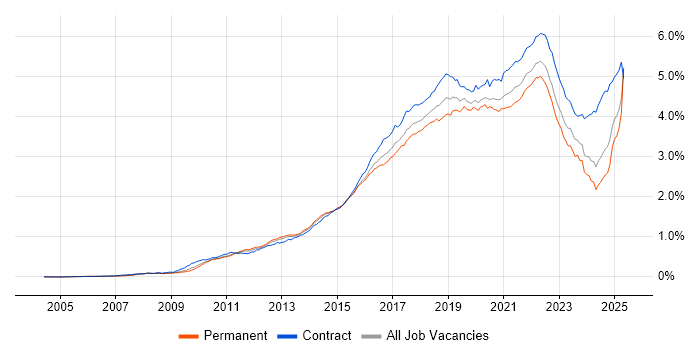
Job postings citing JIRA as a proportion of all IT jobs advertised in England.

Job vacancy trend for JIRA in England

JIRA
Salary Trend in England

3-month moving average salary quoted in jobs citing JIRA in England.

Salary trend for JIRA in England

JIRA
Salary Histogram in England

Salary distribution for jobs citing JIRA in England over the 6 months to 17 July 2025.

Salary histogram for JIRA in England

JIRA
Job Locations in England

The table below looks at the demand and provides a guide to the median salaries quoted in IT jobs citing JIRA within the England region over the 6 months to 17 July 2025. The 'Rank Change' column provides an indication of the change in demand within each location based on the same 6 month period last year.

Location Rank Change
on Same Period
Last Year
Matching
Permanent
IT Job Ads
Median Salary
Past 6 Months
Median Salary
% Change
on Same Period
Last Year
Live
Jobs
London +53 523 £72,500 +11.54% 660
North of England +28 442 £48,507 -13.38% 195
North West +25 336 £45,628 -23.95% 92
Midlands +68 273 £55,000 +15.79% 149
South East +4 240 £57,500 +9.52% 251
West Midlands +65 175 £66,250 +33.84% 100
East of England +22 116 £57,500 +27.78% 92
East Midlands +43 98 £36,000 -24.21% 48
South West -20 96 £46,500 -7.00% 112
Yorkshire +19 90 £62,500 +19.05% 83
North East +7 16 £32,312 -39.75% 21
JIRA
UK

JIRA
Co-occurring Skills and Capabilities in England by Category

The follow tables expand on the table above by listing co-occurrences grouped by category. The same employment type, locality and period is covered with up to 20 co-occurrences shown in each of the following categories:

Application Platforms
1 666 (36.78%) Confluence
2 91 (5.02%) SharePoint
3 16 (0.88%) CMS
4 13 (0.72%) Microsoft Exchange
5 7 (0.39%) Apache
5 7 (0.39%) Umbraco
6 6 (0.33%) nginx
6 6 (0.33%) WordPress
7 5 (0.28%) IIS
8 4 (0.22%) Apache Airflow
8 4 (0.22%) WebSphere
9 3 (0.17%) Adobe Experience Manager
9 3 (0.17%) Headless CMS
9 3 (0.17%) JBoss
9 3 (0.17%) Tomcat
10 2 (0.11%) CICS
11 1 (0.055%) Moodle
11 1 (0.055%) Oracle Workflow
11 1 (0.055%) SharePoint Server
11 1 (0.055%) Totara
Applications
1 142 (7.84%) Microsoft Office
2 75 (4.14%) Microsoft Project
3 66 (3.64%) Microsoft Excel
4 46 (2.54%) Trello
5 37 (2.04%) Microsoft PowerPoint
5 37 (2.04%) MS Visio
6 7 (0.39%) Chatbot
6 7 (0.39%) MadCap Flare
7 5 (0.28%) Simulink
8 4 (0.22%) Mozilla Thunderbird
9 3 (0.17%) CATIA
10 2 (0.11%) Adobe XD
10 2 (0.11%) Spreadsheet
11 1 (0.055%) Adobe Creative Suite
11 1 (0.055%) Adobe Illustrator
11 1 (0.055%) Adobe Premiere
11 1 (0.055%) InDesign
11 1 (0.055%) Photoshop
11 1 (0.055%) PlantUML
11 1 (0.055%) Weka
Business Applications
1 18 (0.99%) SAP S/4HANA
2 13 (0.72%) Dynamics CRM
3 12 (0.66%) Salesforce CRM
4 10 (0.55%) NetSuite
5 5 (0.28%) CA PPM
6 4 (0.22%) Shopify
7 3 (0.17%) Oracle ERP
7 3 (0.17%) SAP IBP
7 3 (0.17%) SAP SCM
7 3 (0.17%) Sparx Enterprise Architect
8 2 (0.11%) Bloomberg AIM
8 2 (0.11%) Dynamics NAV
8 2 (0.11%) Elite 3E
8 2 (0.11%) Oracle Assets
8 2 (0.11%) Oracle Cash Management
8 2 (0.11%) Oracle General Ledger
8 2 (0.11%) Oracle Payables
8 2 (0.11%) Oracle Procure-to-Pay
8 2 (0.11%) Oracle Receivables
8 2 (0.11%) SimCorp Dimension
Cloud Services
1 446 (24.63%) Azure
2 407 (22.47%) AWS
3 171 (9.44%) GCP
4 96 (5.30%) Miro
5 81 (4.47%) Asana
6 78 (4.31%) Azure DevOps
7 77 (4.25%) GitHub
8 74 (4.09%) Power Platform
9 63 (3.48%) SaaS
10 57 (3.15%) Amazon S3
11 54 (2.98%) Amazon EC2
12 53 (2.93%) Microsoft 365
13 52 (2.87%) Serverless
14 48 (2.65%) Amazon CloudWatch
15 42 (2.32%) AWS KMS
16 38 (2.10%) Virtual Private Cloud
17 35 (1.93%) Amazon ELB
18 33 (1.82%) Dynamics 365
19 31 (1.71%) Amazon Glacier
20 27 (1.49%) Power Automate
Communications & Networking
1 293 (16.18%) Broadband
2 55 (3.04%) Firewall
3 46 (2.54%) DNS
4 39 (2.15%) HTTP
5 26 (1.44%) SSH
6 19 (1.05%) FTP
6 19 (1.05%) SMTP
7 18 (0.99%) VPN
8 15 (0.83%) Internet
8 15 (0.83%) Multicast
9 13 (0.72%) DHCP
10 11 (0.61%) TCP/IP
11 10 (0.55%) Wireless
12 6 (0.33%) SAN
13 5 (0.28%) Cisco IOS
13 5 (0.28%) Kerberos
13 5 (0.28%) OpenLDAP
13 5 (0.28%) VLAN
14 4 (0.22%) IMAP
14 4 (0.22%) Network Security
Database & Business Intelligence
1 286 (15.79%) SQL Server
2 53 (2.93%) MySQL
3 51 (2.82%) Power BI
4 50 (2.76%) Amazon RDS
4 50 (2.76%) PostgreSQL
5 49 (2.71%) Relational Database
6 37 (2.04%) NoSQL
7 35 (1.93%) MongoDB
8 21 (1.16%) Tableau
9 18 (0.99%) Data Warehouse
10 16 (0.88%) Amazon Aurora
11 15 (0.83%) SQL Server Integration Services
12 12 (0.66%) Elasticsearch
12 12 (0.66%) SQL Server Reporting Services
13 11 (0.61%) Amazon Redshift
14 10 (0.55%) DynamoDB
14 10 (0.55%) Redis
15 8 (0.44%) BusinessObjects
15 8 (0.44%) SQL Server Analysis Services
16 7 (0.39%) Data Lake
Development Applications
1 263 (14.52%) Selenium
2 248 (13.69%) Bitbucket
3 235 (12.98%) SonarQube
4 229 (12.64%) Sonatype Nexus
5 228 (12.59%) Maven
6 225 (12.42%) GitLab
7 214 (11.82%) Cucumber
7 214 (11.82%) Git
8 118 (6.52%) Jenkins
9 78 (4.31%) Rational DOORS
10 36 (1.99%) Vagrant
11 28 (1.55%) Postman
12 27 (1.49%) JUnit
13 23 (1.27%) TeamCity
14 19 (1.05%) Visual Studio
15 17 (0.94%) Cypress.io
16 16 (0.88%) Artifactory
17 15 (0.83%) SoapUI
17 15 (0.83%) TestRail
18 14 (0.77%) JMeter
General
1 610 (33.68%) Finance
2 456 (25.18%) Social Skills
3 298 (16.45%) Banking
4 232 (12.81%) Inclusion and Diversity
5 170 (9.39%) Analytical Skills
6 136 (7.51%) Retail
7 103 (5.69%) Law
8 101 (5.58%) Investment Banking
9 96 (5.30%) Influencing Skills
10 90 (4.97%) Corporate Banking
11 84 (4.64%) Manufacturing
12 70 (3.87%) Public Sector
13 57 (3.15%) Marketing
14 53 (2.93%) Legal
15 49 (2.71%) Presentation Skills
16 47 (2.60%) Documentation Skills
17 30 (1.66%) Organisational Skills
18 24 (1.33%) Back Office
18 24 (1.33%) Electronics
19 23 (1.27%) Financial Institution
Job Titles
1 281 (15.52%) Software Engineer
2 279 (15.41%) Analyst
3 272 (15.02%) Senior
4 219 (12.09%) Embedded Engineer
5 215 (11.87%) Release Engineer
6 174 (9.61%) Lead
7 155 (8.56%) Developer
8 89 (4.91%) Architect
9 80 (4.42%) Product Analyst
10 76 (4.20%) Project Manager
11 71 (3.92%) Business Analyst
12 69 (3.81%) Solutions Architect
13 68 (3.75%) Support Analyst
14 56 (3.09%) Lead Architect
14 56 (3.09%) Lead Solutions Architect
15 54 (2.98%) IT Support
16 50 (2.76%) Support Engineer
17 39 (2.15%) IT Analyst
18 38 (2.10%) DevOps Engineer
18 38 (2.10%) Senior Developer
Libraries, Frameworks & Software Standards
1 278 (15.35%) React
2 272 (15.02%) HTML
3 259 (14.30%) CSS
4 242 (13.36%) Middleware
5 241 (13.31%) Spring
6 233 (12.87%) Spring Boot
7 229 (12.64%) Kafka
8 213 (11.76%) Redux
9 209 (11.54%) JPA
10 156 (8.61%) REST
11 138 (7.62%) RESTful
12 126 (6.96%) Hibernate
13 108 (5.96%) HTML5
14 99 (5.47%) CSS3
14 99 (5.47%) Sass
15 98 (5.41%) Jest
16 85 (4.69%) .NET
17 58 (3.20%) SOAP
18 52 (2.87%) AngularJS
19 49 (2.71%) Node.js
Miscellaneous
1 385 (21.26%) Product Ownership
2 218 (12.04%) Embedded Systems
3 205 (11.32%) Enterprise Software
4 88 (4.86%) Self-Motivation
5 72 (3.98%) Over-the-Top Content
5 72 (3.98%) Video\Live Streaming
6 36 (1.99%) Management Information System
7 31 (1.71%) Onboarding
8 26 (1.44%) Public Cloud
8 26 (1.44%) Replication
9 25 (1.38%) Social Media
9 25 (1.38%) Virtual Team
10 23 (1.27%) Cloud Native
11 22 (1.21%) IoT
12 21 (1.16%) Algorithms
12 21 (1.16%) Mobile App
12 21 (1.16%) SCADA
13 18 (0.99%) CMDB
14 17 (0.94%) Derivative
14 17 (0.94%) Greenfield Project
Operating Systems
1 162 (8.95%) Linux
2 140 (7.73%) Windows
3 36 (1.99%) VMS
4 25 (1.38%) Unix
5 20 (1.10%) Amazon Linux
6 17 (0.94%) Android
7 15 (0.83%) Windows Server
8 12 (0.66%) Mac OS
9 10 (0.55%) Windows 10
10 8 (0.44%) Apple iOS
10 8 (0.44%) Windows Vista
11 7 (0.39%) Red Hat Enterprise Linux
11 7 (0.39%) Ubuntu
12 3 (0.17%) Debian
12 3 (0.17%) Windows Server 2012
12 3 (0.17%) Windows Server 2019
13 2 (0.11%) CentOS
13 2 (0.11%) Embedded Linux
13 2 (0.11%) Windows Server 2016
13 2 (0.11%) zOS
Processes & Methodologies
1 1,273 (70.29%) Agile
2 585 (32.30%) CI/CD
3 486 (26.84%) DevOps
4 415 (22.92%) Roadmaps
5 339 (18.72%) Test Automation
6 326 (18.00%) Strategic Thinking
7 317 (17.50%) Problem-Solving
8 315 (17.39%) Software Engineering
9 308 (17.01%) SDLC
10 295 (16.29%) Continuous Improvement
11 278 (15.35%) Microservices
12 271 (14.96%) Artificial Intelligence
13 251 (13.86%) Full-Stack Development
14 250 (13.80%) Mentoring
15 247 (13.64%) Project Management
16 246 (13.58%) Containerisation
17 238 (13.14%) Continuous Deployment
18 235 (12.98%) Software Delivery
19 233 (12.87%) Stakeholder Management
20 230 (12.70%) Front End Development
Programming Languages
1 459 (25.35%) SQL
2 364 (20.10%) JavaScript
3 324 (17.89%) Java
4 170 (9.39%) Python
5 150 (8.28%) TypeScript
6 118 (6.52%) C#
7 84 (4.64%) PowerShell
8 46 (2.54%) Groovy
9 30 (1.66%) Bash
10 23 (1.27%) C++
11 20 (1.10%) Perl
12 16 (0.88%) T-SQL
13 15 (0.83%) PHP
14 13 (0.72%) Apex Code
14 13 (0.72%) Shell Script
15 11 (0.61%) Go
16 10 (0.55%) C
17 8 (0.44%) PL/SQL
18 7 (0.39%) R
19 6 (0.33%) SOQL
Qualifications
1 329 (18.17%) Degree
2 178 (9.83%) BPSS Clearance
3 89 (4.91%) Security Cleared
4 68 (3.75%) SC Cleared
5 62 (3.42%) ISTQB
6 52 (2.87%) PMI Certification
7 49 (2.71%) Chartered Engineer
8 40 (2.21%) PMP
9 35 (1.93%) Computer Science Degree
10 30 (1.66%) Azure Certification
11 24 (1.33%) AWS Certification
11 24 (1.33%) DBS Check
12 19 (1.05%) Microsoft Certification
13 17 (0.94%) ISTQB Foundation Certification
14 11 (0.61%) A+ Certification
14 11 (0.61%) HNC
14 11 (0.61%) HND
15 10 (0.55%) Master's Degree
16 9 (0.50%) CISSP
16 9 (0.50%) Numerate Degree
Quality Assurance & Compliance
1 318 (17.56%) QA
2 112 (6.18%) Accessibility
3 49 (2.71%) SLA
4 38 (2.10%) PMO
5 24 (1.33%) ISO/IEC 27001
6 22 (1.21%) Data Quality
7 18 (0.99%) GDPR
8 15 (0.83%) NIST
9 10 (0.55%) ISO 20022
10 7 (0.39%) MiFID
11 6 (0.33%) P3O
12 5 (0.28%) Software Quality Assurance
13 4 (0.22%) SOC 2
14 3 (0.17%) GRC
14 3 (0.17%) ISO/IEC 12207
14 3 (0.17%) ISO/IEC 15288
15 2 (0.11%) GxP
15 2 (0.11%) ISO 13485
15 2 (0.11%) Solvency II
15 2 (0.11%) UCITS
System Software
1 310 (17.12%) Docker
2 70 (3.87%) Active Directory
3 25 (1.38%) DFS Replication
4 18 (0.99%) Firmware
5 16 (0.88%) VMware Infrastructure
6 11 (0.61%) Virtual Desktop
7 6 (0.33%) Hyper-V
8 5 (0.28%) Virtual Machines
9 4 (0.22%) Dovecot
9 4 (0.22%) Postfix
9 4 (0.22%) Squid
9 4 (0.22%) vSphere
10 3 (0.17%) VMware ESXi
11 2 (0.11%) Embedded Firmware
12 1 (0.055%) BitLocker
12 1 (0.055%) KVM
12 1 (0.055%) pfSense
12 1 (0.055%) Veritas Cluster Server
12 1 (0.055%) VMware NSX
12 1 (0.055%) Xen
Systems Management
1 267 (14.74%) Kubernetes
2 83 (4.58%) Terraform
3 69 (3.81%) Ansible
4 54 (2.98%) Grafana
5 50 (2.76%) Prometheus
6 24 (1.33%) Single Sign-On
7 23 (1.27%) Microsoft Intune
8 16 (0.88%) Puppet
9 11 (0.61%) Progress Chef
10 7 (0.39%) Kibana
11 6 (0.33%) HP ALM
11 6 (0.33%) Nessus
11 6 (0.33%) Salt
12 5 (0.28%) Jamf Pro
12 5 (0.28%) logstash
12 5 (0.28%) SCCM
13 4 (0.22%) Argo
13 4 (0.22%) Control-M
13 4 (0.22%) HP Quality Center
13 4 (0.22%) Proxmox
Vendors
1 315 (17.39%) Microsoft
2 198 (10.93%) Solace
3 139 (7.68%) Salesforce
4 120 (6.63%) ServiceNow
5 88 (4.86%) SAP
6 65 (3.59%) Atlassian
7 63 (3.48%) IBM
8 58 (3.20%) Oracle
9 56 (3.09%) Siemens
10 55 (3.04%) Google
11 21 (1.16%) VMware
12 19 (1.05%) Juniper
13 18 (0.99%) MuleSoft
14 17 (0.94%) Splunk
15 15 (0.83%) Cisco
16 11 (0.61%) Bloomberg
16 11 (0.61%) Okta
17 10 (0.55%) CA Agile Central
17 10 (0.55%) Dynatrace
18 9 (0.50%) Adobe