IoT Jobs in England

IoT (Internet of Things, Internet of Everything)
UK > England

The table below looks at the prevalence of the term IoT in permanent job vacancies in England. Included is a benchmarking guide to the salaries offered in vacancies that cited IoT over the 6 months leading up to 2 July 2025, comparing them to the same period in the previous two years.

6 months to
2 Jul 2025
Same period 2024 Same period 2023
Rank 528 278 372
Rank change year-on-year -250 +94 -27
Permanent jobs citing IoT 174 895 674
As % of all permanent jobs advertised in England 0.34% 0.95% 0.85%
As % of the Miscellaneous category 0.91% 2.87% 1.96%
Number of salaries quoted 118 710 416
10th Percentile £42,050 £33,976 £38,625
25th Percentile £51,250 £47,500 £47,500
Median annual salary (50th Percentile) £60,000 £60,000 £62,500
Median % change year-on-year - -4.00% -10.71%
75th Percentile £75,000 £70,000 £77,500
90th Percentile £90,000 £85,000 £90,000
UK median annual salary £60,000 £60,000 £62,500
% change year-on-year - -4.00% -10.71%

All Generic Skills
England

IoT falls under the General and Transferable Skills category. For comparison with the information above, the following table provides summary statistics for all permanent job vacancies requiring generic IT skills in England.

Permanent vacancies with a requirement for generic IT skills 19,149 31,162 34,388
As % of all permanent jobs advertised in England 37.46% 33.10% 43.48%
Number of salaries quoted 9,104 20,799 19,649
10th Percentile £29,825 £28,250 £35,750
25th Percentile £40,000 £38,750 £46,570
Median annual salary (50th Percentile) £60,000 £55,000 £65,000
Median % change year-on-year +9.09% -15.38% +4.00%
75th Percentile £80,000 £76,375 £86,250
90th Percentile £110,000 £100,000 £110,000
UK median annual salary £59,800 £55,000 £64,029
% change year-on-year +8.73% -14.10% +2.45%

IoT
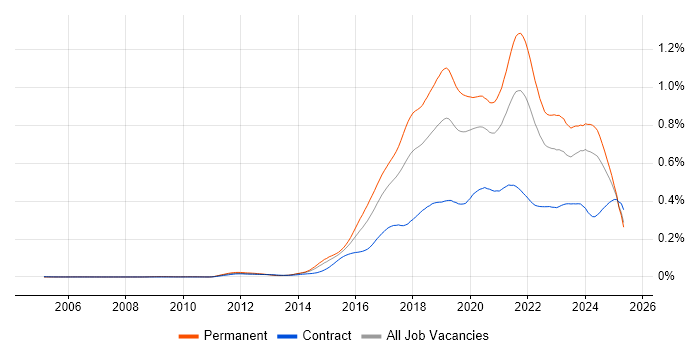
Job Vacancy Trend in England

Job postings citing IoT as a proportion of all IT jobs advertised in England.

Job vacancy trend for IoT in England

IoT
Salary Trend in England

3-month moving average salary quoted in jobs citing IoT in England.

Salary trend for IoT in England

IoT
Salary Histogram in England

Salary distribution for jobs citing IoT in England over the 6 months to 2 July 2025.

Salary histogram for IoT in England

IoT
Job Locations in England

The table below looks at the demand and provides a guide to the median salaries quoted in IT jobs citing IoT within the England region over the 6 months to 2 July 2025. The 'Rank Change' column provides an indication of the change in demand within each location based on the same 6 month period last year.

Location Rank Change
on Same Period
Last Year
Matching
Permanent
IT Job Ads
Median Salary
Past 6 Months
Median Salary
% Change
on Same Period
Last Year
Live
Jobs
South East -49 42 £62,500 +8.70% 177
London -57 36 £82,500 +26.92% 826
Midlands -15 27 £60,000 - 97
South West +98 26 £57,500 - 94
North of England -79 26 £58,000 +5.45% 168
North West -47 21 £58,000 +16.00% 103
East Midlands +11 19 £50,000 -16.67% 46
East of England -91 17 £57,500 - 117
West Midlands +13 7 £70,000 +19.15% 51
Yorkshire +5 4 £60,000 -7.69% 48
IoT
UK

IoT
Co-occurring Skills and Capabilities in England by Category

The follow tables expand on the table above by listing co-occurrences grouped by category. The same employment type, locality and period is covered with up to 20 co-occurrences shown in each of the following categories:

Application Platforms
1 12 (6.90%) Confluence
2 6 (3.45%) SharePoint
3 2 (1.15%) Microsoft Exchange
3 2 (1.15%) Skype for Business
3 2 (1.15%) ThingWorx
4 1 (0.57%) Apache
4 1 (0.57%) Apache Airflow
Applications
1 7 (4.02%) Microsoft Excel
1 7 (4.02%) Microsoft Office
2 4 (2.30%) Chatbot
2 4 (2.30%) Maya
3 3 (1.72%) AutoCAD
3 3 (1.72%) MS Visio
4 2 (1.15%) Microsoft Project
4 2 (1.15%) Revit
4 2 (1.15%) Simulink
5 1 (0.57%) Microsoft PowerPoint
5 1 (0.57%) SOLIDWORKS
Business Applications
1 5 (2.87%) SAP S/4HANA
2 3 (1.72%) SAP SCM
3 2 (1.15%) SAP APO
3 2 (1.15%) SAP EWM
3 2 (1.15%) SAP PP
4 1 (0.57%) NetSuite
4 1 (0.57%) Oracle ERP
4 1 (0.57%) Salesforce CRM
4 1 (0.57%) SAP IBP
4 1 (0.57%) SAP LE
4 1 (0.57%) SAP MM
4 1 (0.57%) SAP QM
4 1 (0.57%) SAP SD
4 1 (0.57%) SAP WM
4 1 (0.57%) Shopify
Cloud Services
1 40 (22.99%) AWS
2 24 (13.79%) Azure
3 12 (6.90%) Microsoft 365
3 12 (6.90%) Serverless
4 10 (5.75%) SaaS
5 8 (4.60%) Power Platform
6 7 (4.02%) Cloud Computing
7 6 (3.45%) AWS IoT
7 6 (3.45%) Power Automate
7 6 (3.45%) PowerApps
8 5 (2.87%) GCP
9 4 (2.30%) Amazon EC2
9 4 (2.30%) GitHub
10 3 (1.72%) Amazon S3
10 3 (1.72%) AWS Lambda
10 3 (1.72%) Entra ID
10 3 (1.72%) Virtual Private Cloud
11 2 (1.15%) AWS CodeCommit
11 2 (1.15%) AWS Fargate
11 2 (1.15%) Firebase
Communications & Networking
1 24 (13.79%) Internet
2 21 (12.07%) MQTT
3 20 (11.49%) Modbus
4 16 (9.20%) WAN
4 16 (9.20%) Wireless
5 13 (7.47%) Ethernet
6 9 (5.17%) 5G
6 9 (5.17%) Firewall
7 8 (4.60%) 4G
7 8 (4.60%) Wi-Fi
8 7 (4.02%) LoRaWAN
8 7 (4.02%) Unified Communications
9 5 (2.87%) SD-WAN
9 5 (2.87%) VoIP
10 4 (2.30%) LAN
10 4 (2.30%) LTE
11 3 (1.72%) Bluetooth
11 3 (1.72%) DNS
11 3 (1.72%) VPN
12 2 (1.15%) PBX
Database & Business Intelligence
1 16 (9.20%) MySQL
2 10 (5.75%) NoSQL
3 6 (3.45%) MongoDB
3 6 (3.45%) SQL Server
4 5 (2.87%) PostgreSQL
4 5 (2.87%) TimescaleDB
5 4 (2.30%) Big Data
5 4 (2.30%) DynamoDB
6 3 (1.72%) Amazon RDS
6 3 (1.72%) Azure SQL Database
6 3 (1.72%) Relational Database
7 2 (1.15%) Data Warehouse
7 2 (1.15%) Hazelcast
7 2 (1.15%) Power BI
8 1 (0.57%) Amazon Aurora
8 1 (0.57%) Azure SQL Data Warehouse
8 1 (0.57%) BigQuery
8 1 (0.57%) ClickHouse
8 1 (0.57%) Data Lake
8 1 (0.57%) Pentaho
Development Applications
1 20 (11.49%) Git
2 19 (10.92%) JIRA
3 4 (2.30%) Jenkins
4 3 (1.72%) Bitbucket
4 3 (1.72%) GitLab
4 3 (1.72%) Subversion
5 2 (1.15%) Eclipse
6 1 (0.57%) Cypress.io
6 1 (0.57%) MSI
6 1 (0.57%) Selenium
6 1 (0.57%) SonarQube
General
1 49 (28.16%) Social Skills
2 47 (27.01%) Manufacturing
3 25 (14.37%) Finance
4 24 (13.79%) Marketing
5 18 (10.34%) Electronics
6 17 (9.77%) Pharmaceutical
6 17 (9.77%) Telecoms
7 15 (8.62%) Automotive
7 15 (8.62%) Public Sector
8 14 (8.05%) Analytical Skills
9 7 (4.02%) Tech for Good
10 6 (3.45%) Games
10 6 (3.45%) Law
10 6 (3.45%) Retail
11 5 (2.87%) Aerospace
11 5 (2.87%) Social Housing
12 4 (2.30%) Back Office
12 4 (2.30%) Banking
12 4 (2.30%) Presentation Skills
13 3 (1.72%) Advertising
Job Titles
1 31 (17.82%) Senior
2 21 (12.07%) Developer
2 21 (12.07%) Software Engineer
3 17 (9.77%) Lead
4 13 (7.47%) Architect
5 11 (6.32%) Automation Engineer
6 8 (4.60%) Embedded Engineer
6 8 (4.60%) Full-Stack Developer
6 8 (4.60%) Systems Engineer
7 7 (4.02%) Consultant
7 7 (4.02%) Electronics Engineer
7 7 (4.02%) Product Manager
7 7 (4.02%) Senior Systems Engineer
7 7 (4.02%) Software Developer
8 6 (3.45%) 1st Line Support
8 6 (3.45%) Senior Software Engineer
8 6 (3.45%) Solutions Architect
8 6 (3.45%) Support Team Leader
8 6 (3.45%) Team Leader
9 5 (2.87%) Project Manager
Libraries, Frameworks & Software Standards
1 21 (12.07%) React
2 13 (7.47%) .NET
2 13 (7.47%) Node.js
3 12 (6.90%) AngularJS
4 10 (5.75%) CSS
5 9 (5.17%) RESTful
6 8 (4.60%) Vue
7 7 (4.02%) NestJS
8 6 (3.45%) .NET Core
9 5 (2.87%) REST
10 4 (2.30%) Kafka
11 3 (1.72%) Django
11 3 (1.72%) Flask
11 3 (1.72%) HTML
11 3 (1.72%) Laravel
11 3 (1.72%) RabbitMQ
11 3 (1.72%) React Native
11 3 (1.72%) SAP Fiori
11 3 (1.72%) SAPUI5
11 3 (1.72%) Yocto
Miscellaneous
1 26 (14.94%) Operational Technology
2 25 (14.37%) Renewable Energy
3 18 (10.34%) SCADA
4 14 (8.05%) Industry 4.0
5 13 (7.47%) Biopharmaceutical
5 13 (7.47%) Data Centre
6 10 (5.75%) Embedded Systems
7 7 (4.02%) Smart Home
8 6 (3.45%) FMCG
8 6 (3.45%) Industrial Internet of Things
8 6 (3.45%) Management Information System
8 6 (3.45%) Self-Motivation
8 6 (3.45%) Social Media
9 5 (2.87%) Blockchain
9 5 (2.87%) Cloud Native
9 5 (2.87%) Greenfield Project
9 5 (2.87%) Legacy Systems
9 5 (2.87%) NHS
9 5 (2.87%) Video Conferencing
10 4 (2.30%) Virtual Team
Operating Systems
1 17 (9.77%) Linux
2 6 (3.45%) Windows
3 3 (1.72%) Embedded Linux
3 3 (1.72%) Windows Server
4 2 (1.15%) Debian
5 1 (0.57%) Android
5 1 (0.57%) Apple iOS
5 1 (0.57%) Ubuntu
5 1 (0.57%) Unix
5 1 (0.57%) VMS
Processes & Methodologies
1 43 (24.71%) Agile
2 41 (23.56%) Mentoring
3 37 (21.26%) Problem-Solving
4 26 (14.94%) Project Delivery
5 25 (14.37%) Cybersecurity
5 25 (14.37%) Software Engineering
6 22 (12.64%) Analytics
7 21 (12.07%) Microservices
7 21 (12.07%) Prototyping
8 20 (11.49%) Machine Learning
9 19 (10.92%) DevOps
9 19 (10.92%) Project Management
10 18 (10.34%) Artificial Intelligence
10 18 (10.34%) Network Design
11 17 (9.77%) Asset Management
11 17 (9.77%) Business Development
11 17 (9.77%) Continuous Improvement
12 16 (9.20%) Customer Service
13 15 (8.62%) Roadmaps
13 15 (8.62%) Strategic Thinking
Programming Languages
1 34 (19.54%) Python
2 20 (11.49%) SQL
3 19 (10.92%) C#
3 19 (10.92%) TypeScript
4 16 (9.20%) JavaScript
5 12 (6.90%) C
5 12 (6.90%) PHP
6 11 (6.32%) PowerShell
7 8 (4.60%) C++
8 7 (4.02%) Java
9 5 (2.87%) Embedded C
10 4 (2.30%) Bash
11 3 (1.72%) Go
12 2 (1.15%) MATLAB
12 2 (1.15%) PL/SQL
13 1 (0.57%) Bicep
13 1 (0.57%) Kotlin
13 1 (0.57%) Rust
13 1 (0.57%) Shell Script
Qualifications
1 51 (29.31%) Degree
2 14 (8.05%) HNC
2 14 (8.05%) HND
3 13 (7.47%) Chartered Engineer
4 8 (4.60%) Security Cleared
5 5 (2.87%) Computer Science Degree
5 5 (2.87%) PMI Certification
6 4 (2.30%) Master's Degree
6 4 (2.30%) PMP
7 3 (1.72%) CCNP
7 3 (1.72%) Cisco Certification
7 3 (1.72%) Microsoft Certification
7 3 (1.72%) SAP Certification
7 3 (1.72%) SC Cleared
8 2 (1.15%) CCIE
8 2 (1.15%) MCP
9 1 (0.57%) CCNA
9 1 (0.57%) CISSP
9 1 (0.57%) PhD
9 1 (0.57%) Postgraduate
Quality Assurance & Compliance
1 7 (4.02%) QA
2 5 (2.87%) Accessibility
3 3 (1.72%) GDPR
4 2 (1.15%) SLA
5 1 (0.57%) Data Quality
5 1 (0.57%) GMP
5 1 (0.57%) ISO 13485
5 1 (0.57%) ISO 9001
5 1 (0.57%) ISO/IEC 27001
5 1 (0.57%) NCSC
5 1 (0.57%) NIST
System Software
1 19 (10.92%) Docker
2 11 (6.32%) VMware ESXi
2 11 (6.32%) VMware Infrastructure
3 10 (5.75%) Firmware
4 5 (2.87%) Active Directory
5 3 (1.72%) Embedded Firmware
Systems Management
1 13 (7.47%) Functional Safety
2 10 (5.75%) Kubernetes
3 6 (3.45%) Terraform
4 3 (1.72%) Microsoft Intune
4 3 (1.72%) SCCM
5 2 (1.15%) FortiGate
6 1 (0.57%) Kibana
Vendors
1 25 (14.37%) Microsoft
2 21 (12.07%) SAP
3 14 (8.05%) Siemens
4 13 (7.47%) AVEVA
4 13 (7.47%) Rockwell
5 11 (6.32%) VMware
6 9 (5.17%) Atlassian
7 7 (4.02%) Oracle
8 5 (2.87%) Atmel
8 5 (2.87%) Cisco
9 4 (2.30%) Workday
10 3 (1.72%) Aruba
10 3 (1.72%) Fortinet
10 3 (1.72%) Okta
11 2 (1.15%) Autodesk
11 2 (1.15%) Google
11 2 (1.15%) Panasonic
11 2 (1.15%) Polycom
11 2 (1.15%) Salesforce
11 2 (1.15%) Sony