Unit Testing Job Trends in England

Unit Testing
UK > England

The table below provides summary statistics and salary benchmarking for jobs advertised in England requiring Unit Testing skills. It covers permanent job vacancies from the 6 months leading up to 17 October 2025, with comparisons to the same periods in the previous two years.

6 months to
17 Oct 2025
Same period 2024 Same period 2023
Rank 414 224 185
Rank change year-on-year -190 -39 -70
Permanent jobs citing Unit Testing 233 744 913
As % of all permanent jobs in England 0.55% 1.19% 1.81%
As % of the Processes & Methodologies category 0.62% 1.44% 1.93%
Number of salaries quoted 131 330 720
10th Percentile £46,250 £42,500 £45,000
25th Percentile £52,875 £52,500 £48,750
Median annual salary (50th Percentile) £62,500 £65,000 £60,000
Median % change year-on-year -3.85% +8.33% -7.69%
75th Percentile £78,750 £80,000 £73,654
90th Percentile £122,500 £97,750 £92,500
UK median annual salary £62,500 £65,000 £60,000
% change year-on-year -3.85% +8.33% -7.69%

All Process and Methodology Skills
England

Unit Testing falls under the Processes and Methodologies category. For comparison with the information above, the following table provides summary statistics for all permanent job vacancies requiring process or methodology skills in England.

Permanent vacancies with a requirement for process or methodology skills 37,775 51,651 47,319
As % of all permanent jobs advertised in England 88.79% 82.60% 93.96%
Number of salaries quoted 21,898 27,674 36,109
10th Percentile £28,500 £33,500 £32,750
25th Percentile £36,250 £45,000 £45,000
Median annual salary (50th Percentile) £55,000 £60,000 £60,800
Median % change year-on-year -8.33% -1.32% +1.33%
75th Percentile £75,000 £80,000 £81,250
90th Percentile £97,500 £98,750 £100,000
UK median annual salary £55,000 £60,000 £60,000
% change year-on-year -8.33% - -

Unit Testing
Job Vacancy Trend in England

Historical trend showing the proportion of permanent IT job postings citing Unit Testing relative to all permanent IT jobs advertised in England.
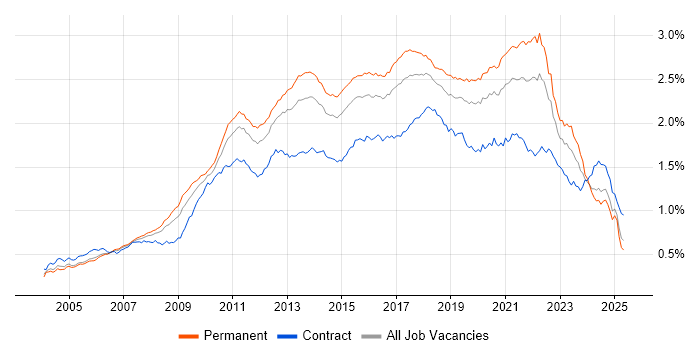
Unit Testing job vacancy trend in England

Unit Testing
Salary Trend in England

Salary distribution trend for jobs in England citing Unit Testing.

Salary distribution trend for jobs in England citing Unit Testing

Unit Testing
Salary Histogram in England

Salary distribution for jobs citing Unit Testing in England over the 6 months to 17 October 2025.

Salary histogram for Unit Testing in England

Unit Testing
Job Locations in England

The table below looks at the demand and provides a guide to the median salaries quoted in IT jobs citing Unit Testing within the England region over the 6 months to 17 October 2025. The 'Rank Change' column provides an indication of the change in demand within each location based on the same 6 month period last year.

Location Rank Change
on Same Period
Last Year
Matching
Permanent
IT Job Ads
Median Salary
Past 6 Months
Median Salary
% Change
on Same Period
Last Year
Live
Jobs
London -110 78 £87,000 +16.00% 64
North of England -89 59 £56,250 -6.25% 43
North West -73 47 £57,500 -8.00% 25
South East -50 35 £60,000 - 60
Midlands +2 27 £57,500 +15.00% 26
South West +28 23 £57,500 -3.29% 10
West Midlands +37 17 £57,500 -11.54% 10
East Midlands -17 10 £56,750 +13.50% 16
Yorkshire -6 8 £75,000 +57.89% 11
East of England -13 6 £55,750 -20.36% 26
North East -3 4 £47,500 +5.56% 7
Unit Testing
UK

Unit Testing
Co-Occurring Skills & Capabilities in England by Category

The following tables expand on the one above by listing co-occurrences grouped by category. They cover the same employment type, locality and period, with up to 20 co-occurrences shown in each category:

Application Platforms
1 22 (9.44%) Apache Spark
2 14 (6.01%) Appian
3 9 (3.86%) Confluence
3 9 (3.86%) Headless CMS
4 6 (2.58%) Apache
5 5 (2.15%) CMS
6 4 (1.72%) Apache Airflow
6 4 (1.72%) Camunda
7 3 (1.29%) BizTalk Server
7 3 (1.29%) SAS
8 2 (0.86%) nginx
8 2 (0.86%) Oracle SOA Suite
8 2 (0.86%) SharePoint
9 1 (0.43%) Apache Superset
9 1 (0.43%) JBoss
9 1 (0.43%) Jupyter
9 1 (0.43%) Tomcat
9 1 (0.43%) WebLogic
Applications
1 2 (0.86%) Chatbot
1 2 (0.86%) Microsoft PowerPoint
1 2 (0.86%) MS Visio
2 1 (0.43%) Microsoft Office
Business Applications
1 10 (4.29%) SAP S/4HANA
2 9 (3.86%) Shopify
3 1 (0.43%) Dynamics CRM
3 1 (0.43%) Magento
3 1 (0.43%) Oracle BPM
3 1 (0.43%) SAP CO
3 1 (0.43%) SAP FI
3 1 (0.43%) SAP FI/CO
Cloud Services
1 64 (27.47%) AWS
2 61 (26.18%) Azure
3 29 (12.45%) Amazon S3
4 24 (10.30%) Power Platform
5 22 (9.44%) Serverless
6 21 (9.01%) Amazon EKS
7 18 (7.73%) Amazon ELB
7 18 (7.73%) Azure DevOps
8 16 (6.87%) GCP
9 13 (5.58%) GitHub
10 11 (4.72%) AWS Lambda
11 10 (4.29%) Azure Logic Apps
11 10 (4.29%) Azure Service Bus
12 9 (3.86%) Amazon ECS
12 9 (3.86%) Amazon SQS
13 8 (3.43%) Azure Functions
13 8 (3.43%) Figma
13 8 (3.43%) Google Analytics
13 8 (3.43%) Vercel
14 7 (3.00%) Dynamics 365
Communications & Networking
1 5 (2.15%) DNS
2 4 (1.72%) Kerberos
3 3 (1.29%) HTTP
3 3 (1.29%) PuTTY
4 2 (0.86%) Multicast
5 1 (0.43%) Bluetooth
5 1 (0.43%) Firewall
5 1 (0.43%) HTTPS
5 1 (0.43%) Internet
5 1 (0.43%) MQTT
5 1 (0.43%) UWB
5 1 (0.43%) Wideband
5 1 (0.43%) Wireless
Database & Business Intelligence
1 40 (17.17%) SQL Server
2 27 (11.59%) NoSQL
3 23 (9.87%) MongoDB
4 22 (9.44%) Metadata
4 22 (9.44%) Spark SQL
5 18 (7.73%) Delta Lake
5 18 (7.73%) DynamoDB
6 13 (5.58%) Relational Database
7 10 (4.29%) PostgreSQL
7 10 (4.29%) Power BI
8 9 (3.86%) Elasticsearch
8 9 (3.86%) MySQL
9 8 (3.43%) Data Warehouse
10 6 (2.58%) Redis
11 5 (2.15%) Big Data
11 5 (2.15%) Hadoop
12 4 (1.72%) Data Lake
12 4 (1.72%) Neo4j
12 4 (1.72%) SQL Server Integration Services
13 3 (1.29%) Amazon Athena
Development Applications
1 49 (21.03%) Git
2 26 (11.16%) JIRA
3 19 (8.15%) Jenkins
4 18 (7.73%) MLflow
5 17 (7.30%) GitLab
6 14 (6.01%) JUnit
7 12 (5.15%) Bitbucket
8 11 (4.72%) Cypress.io
8 11 (4.72%) SonarQube
9 7 (3.00%) NUnit
10 6 (2.58%) MSTest
11 5 (2.15%) Atlassian Bamboo
11 5 (2.15%) Selenium
11 5 (2.15%) Sonatype Nexus
12 4 (1.72%) Cucumber
12 4 (1.72%) Postman
12 4 (1.72%) Spinnaker
12 4 (1.72%) Team Foundation Server
12 4 (1.72%) Visual Studio
12 4 (1.72%) YouTrack
General
1 70 (30.04%) Social Skills
2 65 (27.90%) Finance
3 26 (11.16%) Analytical Skills
4 17 (7.30%) Banking
4 17 (7.30%) Marketing
5 16 (6.87%) Manufacturing
6 13 (5.58%) Law
7 8 (3.43%) Front Office
7 8 (3.43%) Public Sector
7 8 (3.43%) Retail
8 7 (3.00%) Inclusion and Diversity
8 7 (3.00%) Investment Banking
9 4 (1.72%) Electronics
9 4 (1.72%) Games
10 3 (1.29%) Aerospace
10 3 (1.29%) Automotive
10 3 (1.29%) Influencing Skills
10 3 (1.29%) Presentation Skills
11 2 (0.86%) Back Office
11 2 (0.86%) Legal
Job Titles
1 127 (54.51%) Developer
2 67 (28.76%) Senior
3 37 (15.88%) Senior Developer
4 34 (14.59%) Software Engineer
5 23 (9.87%) Lead
6 21 (9.01%) .NET Developer
7 19 (8.15%) Full-Stack Developer
8 18 (7.73%) Machine Learning Engineer
8 18 (7.73%) Operations Engineer
9 14 (6.01%) Appian Developer
9 14 (6.01%) Java Developer
10 13 (5.58%) Software Developer
11 10 (4.29%) Backend Developer
12 9 (3.86%) C# Developer
12 9 (3.86%) Senior Full-Stack Developer
12 9 (3.86%) Senior Software Engineer
13 7 (3.00%) Lead Developer
13 7 (3.00%) Principal Developer
14 6 (2.58%) C++ Developer
14 6 (2.58%) Senior .NET Developer
Libraries, Frameworks & Software Standards
1 69 (29.61%) .NET
2 52 (22.32%) React
3 51 (21.89%) RESTful
4 48 (20.60%) CSS
5 45 (19.31%) HTML
6 28 (12.02%) .NET Core
6 28 (12.02%) REST
7 26 (11.16%) PySpark
8 24 (10.30%) .NET Framework
9 23 (9.87%) NumPy
9 23 (9.87%) Pandas
9 23 (9.87%) PyTorch
9 23 (9.87%) scikit-learn
10 22 (9.44%) YAML
11 21 (9.01%) AngularJS
11 21 (9.01%) Spring
12 20 (8.58%) GraphQL
12 20 (8.58%) Kafka
12 20 (8.58%) Spring Boot
13 19 (8.15%) TensorFlow
Miscellaneous
1 18 (7.73%) Linux Command Line
2 12 (5.15%) Cloud Native
3 10 (4.29%) Foreign Exchange (FX)
3 10 (4.29%) Mobile App
4 6 (2.58%) Greenfield Project
5 5 (2.15%) AI Agents
5 5 (2.15%) Derivative
5 5 (2.15%) Embedded Systems
5 5 (2.15%) Product Ownership
5 5 (2.15%) Public Cloud
6 4 (1.72%) Client/Server
6 4 (1.72%) Data Protection Act
6 4 (1.72%) Data Structures
6 4 (1.72%) Distributed Systems
6 4 (1.72%) Legacy Systems
7 3 (1.29%) Blog
7 3 (1.29%) IoT
8 2 (0.86%) CMDB
8 2 (0.86%) Enterprise Software
8 2 (0.86%) Market Risk
Operating Systems
1 22 (9.44%) Unix
2 12 (5.15%) Linux
3 5 (2.15%) Android
4 3 (1.29%) Windows
5 2 (0.86%) Apple iOS
5 2 (0.86%) Red Hat Enterprise Linux
Processes & Methodologies
1 120 (51.50%) Agile
2 98 (42.06%) CI/CD
3 62 (26.61%) Software Engineering
4 60 (25.75%) DevOps
5 50 (21.46%) Mentoring
5 50 (21.46%) Microservices
6 48 (20.60%) Problem-Solving
7 45 (19.31%) Continuous Improvement
8 44 (18.88%) Containerisation
9 42 (18.03%) Test Automation
10 40 (17.17%) Scrum
11 36 (15.45%) Integration Testing
11 36 (15.45%) SDLC
12 35 (15.02%) AI
12 35 (15.02%) Code Quality
13 33 (14.16%) OO
14 32 (13.73%) User Experience
15 31 (13.30%) Machine Learning
16 30 (12.88%) TDD
16 30 (12.88%) Visualisation
Programming Languages
1 77 (33.05%) SQL
2 62 (26.61%) C#
3 60 (25.75%) JavaScript
4 53 (22.75%) Python
5 51 (21.89%) Java
6 37 (15.88%) TypeScript
7 13 (5.58%) C++
8 7 (3.00%) C
9 5 (2.15%) Bash
9 5 (2.15%) Kotlin
9 5 (2.15%) R
9 5 (2.15%) X++
10 3 (1.29%) Bicep
10 3 (1.29%) Erlang
10 3 (1.29%) PROC SQL
10 3 (1.29%) T-SQL
11 2 (0.86%) Apex Code
11 2 (0.86%) Embedded C
11 2 (0.86%) SOQL
12 1 (0.43%) Scala
Qualifications
1 34 (14.59%) Degree
2 19 (8.15%) Computer Science Degree
2 19 (8.15%) Security Cleared
3 15 (6.44%) SC Cleared
4 10 (4.29%) AWS Certification
4 10 (4.29%) Azure Certification
5 6 (2.58%) Master's Degree
6 5 (2.15%) BPSS Clearance
7 4 (1.72%) DV Cleared
7 4 (1.72%) Numerate Degree
7 4 (1.72%) PhD
8 3 (1.29%) AWS Certified Solutions Architect
8 3 (1.29%) Microsoft Certification
9 1 (0.43%) SAP Certification
Quality Assurance & Compliance
1 33 (14.16%) QA
2 19 (8.15%) Accessibility
3 5 (2.15%) WCAG
4 4 (1.72%) Data Quality
5 2 (0.86%) GDPR
5 2 (0.86%) ISO 9000
5 2 (0.86%) JTAG
5 2 (0.86%) SLA
6 1 (0.43%) PSD2
System Software
1 50 (21.46%) Docker
2 10 (4.29%) Active Directory
3 3 (1.29%) Apache Flume
3 3 (1.29%) Firmware
3 3 (1.29%) HDFS
Systems Management
1 37 (15.88%) Kubernetes
2 34 (14.59%) Terraform
3 18 (7.73%) Kubeflow
4 10 (4.29%) Kibana
5 7 (3.00%) Ansible
6 4 (1.72%) Puppet
6 4 (1.72%) Salt
7 3 (1.29%) logstash
7 3 (1.29%) Oozie
8 1 (0.43%) Grafana
8 1 (0.43%) Kustomize
8 1 (0.43%) Packer
8 1 (0.43%) Single Sign-On
Vendors
1 39 (16.74%) Microsoft
2 25 (10.73%) Databricks
3 13 (5.58%) Oracle
3 13 (5.58%) SAP
4 8 (3.43%) Apple
4 8 (3.43%) Atlassian
5 6 (2.58%) IBM
6 5 (2.15%) Google
6 5 (2.15%) Splunk
7 4 (1.72%) AppDynamics
7 4 (1.72%) Bloomberg
7 4 (1.72%) Informatica
7 4 (1.72%) Moogsoft
8 3 (1.29%) MicroStrategy
8 3 (1.29%) Red Hat
8 3 (1.29%) Salesforce
9 2 (0.86%) ServiceNow
9 2 (0.86%) Sybase
9 2 (0.86%) Xamarin
10 1 (0.43%) ForgeRock