Coaching Jobs in England

Coaching
UK > England

The table below provides summary statistics for permanent job vacancies advertised in England requiring Coaching skills. It includes a benchmarking guide to the annual salaries offered in vacancies that cited Coaching over the 6 months leading up to 17 July 2025, comparing them to the same period in the previous two years.

6 months to
17 Jul 2025
Same period 2024 Same period 2023
Rank 40 42 34
Rank change year-on-year +2 -8 +12
Permanent jobs citing Coaching 3,085 4,002 4,999
As % of all permanent jobs advertised in England 5.87% 4.59% 6.69%
As % of the Processes & Methodologies category 6.52% 5.56% 7.01%
Number of salaries quoted 870 2,204 1,426
10th Percentile £32,851 £37,654 £39,294
25th Percentile £47,683 £42,725 £51,250
Median annual salary (50th Percentile) £54,793 £61,206 £67,500
Median % change year-on-year -10.48% -9.32% -
75th Percentile £75,000 £75,772 £87,419
90th Percentile £95,000 £85,000 £102,000
UK median annual salary £54,793 £60,465 £65,600
% change year-on-year -9.38% -7.83% -2.81%

All Process and Methodology Skills
England

Coaching falls under the Processes and Methodologies category. For comparison with the information above, the following table provides summary statistics for all permanent job vacancies requiring process or methodology skills in England.

Permanent vacancies with a requirement for process or methodology skills 47,346 72,028 71,356
As % of all permanent jobs advertised in England 90.10% 82.57% 95.43%
Number of salaries quoted 25,104 50,116 46,640
10th Percentile £28,500 £30,000 £33,750
25th Percentile £39,500 £40,000 £45,239
Median annual salary (50th Percentile) £55,000 £55,000 £62,500
Median % change year-on-year - -12.00% +4.17%
75th Percentile £75,000 £73,750 £81,946
90th Percentile £97,500 £93,750 £102,500
UK median annual salary £55,000 £55,000 £60,249
% change year-on-year - -8.71% +0.42%

Coaching
Job Vacancy Trend in England

Job postings citing Coaching as a proportion of all IT jobs advertised in England.
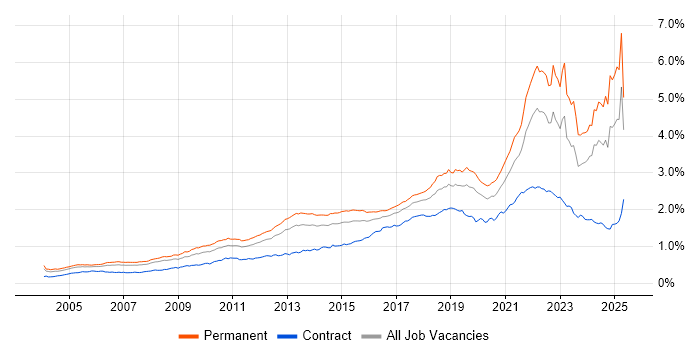
Job vacancy trend for Coaching in England

Coaching
Salary Trend in England

3-month moving average salary quoted in jobs citing Coaching in England.

Salary trend for Coaching in England

Coaching
Salary Histogram in England

Salary distribution for jobs citing Coaching in England over the 6 months to 17 July 2025.

Salary histogram for Coaching in England

Coaching
Job Locations in England

The table below looks at the demand and provides a guide to the median salaries quoted in IT jobs citing Coaching within the England region over the 6 months to 17 July 2025. The 'Rank Change' column provides an indication of the change in demand within each location based on the same 6 month period last year.

Location Rank Change
on Same Period
Last Year
Matching
Permanent
IT Job Ads
Median Salary
Past 6 Months
Median Salary
% Change
on Same Period
Last Year
Live
Jobs
South East +54 707 £55,000 -6.98% 261
North of England -33 665 £54,793 -7.91% 406
London +26 662 £70,000 - 1,139
North West -20 515 £54,793 -5.47% 236
East of England +27 443 £61,954 +30.43% 62
Midlands +14 400 £48,000 -17.92% 214
East Midlands +19 267 £42,500 -26.09% 77
West Midlands -25 133 £48,000 -21.31% 137
South West -13 128 £52,600 -18.31% 122
Yorkshire -69 99 £70,000 +14.37% 118
North East -21 51 £32,951 -46.16% 53
Coaching
UK

Coaching
Co-occurring Skills and Capabilities in England by Category

The follow tables expand on the table above by listing co-occurrences grouped by category. The same employment type, locality and period is covered with up to 20 co-occurrences shown in each of the following categories:

Application Platforms
1 40 (1.30%) SharePoint
2 39 (1.26%) CMS
3 26 (0.84%) Confluence
4 18 (0.58%) Microsoft Exchange
5 10 (0.32%) Moodle
6 6 (0.19%) Apache Airflow
7 4 (0.13%) Apache Spark
7 4 (0.13%) IBM Domino
7 4 (0.13%) SAS
8 3 (0.097%) IIS
8 3 (0.097%) Kentico
8 3 (0.097%) nginx
8 3 (0.097%) Umbraco
9 2 (0.065%) Adobe Experience Manager
9 2 (0.065%) NServiceBus
9 2 (0.065%) ThingWorx
10 1 (0.032%) Appian
10 1 (0.032%) Luigi
10 1 (0.032%) Mendix
10 1 (0.032%) WordPress
Applications
1 114 (3.70%) Microsoft Office
2 83 (2.69%) Microsoft Excel
3 67 (2.17%) Simulink
4 63 (2.04%) Microsoft PowerPoint
5 9 (0.29%) Microsoft Project
6 8 (0.26%) Trello
7 3 (0.097%) Adobe Creative Suite
8 1 (0.032%) Chatbot
8 1 (0.032%) Revit
8 1 (0.032%) Stata
Business Applications
1 17 (0.55%) Dynamics AX
2 12 (0.39%) PeopleSoft Financials
3 10 (0.32%) Dynamics CRM
4 8 (0.26%) Salesforce CRM
5 5 (0.16%) CA PPM
6 4 (0.13%) Adobe Campaign
6 4 (0.13%) Relativity
6 4 (0.13%) Ringtail
6 4 (0.13%) Veritas eDiscovery
7 3 (0.097%) Sage 50
8 2 (0.065%) SAP S/4HANA
9 1 (0.032%) Elite 3E
9 1 (0.032%) Oracle EBS R12
9 1 (0.032%) Oracle Procure-to-Pay
9 1 (0.032%) SAP Business One
9 1 (0.032%) SAP EWM
9 1 (0.032%) SAP IBP
9 1 (0.032%) SAP LE
9 1 (0.032%) SAP SCM
9 1 (0.032%) Shopify
Cloud Services
1 371 (12.03%) Azure
2 193 (6.26%) AWS
3 136 (4.41%) SaaS
4 114 (3.70%) Power Platform
5 91 (2.95%) Azure DevOps
6 86 (2.79%) PaaS
7 83 (2.69%) Microsoft 365
8 68 (2.20%) GCP
9 42 (1.36%) Serverless
10 31 (1.00%) iPaaS
11 25 (0.81%) Dynamics 365
11 25 (0.81%) GitHub
12 24 (0.78%) Cloud Computing
13 22 (0.71%) AWS Lambda
14 21 (0.68%) Amazon SQS
15 18 (0.58%) Azure Machine Learning
15 18 (0.58%) Azure Synapse Analytics
16 17 (0.55%) Entra ID
17 16 (0.52%) Azure Data Factory
18 15 (0.49%) Azure Cosmos DB
Communications & Networking
1 735 (23.82%) Wireless
2 734 (23.79%) Wi-Fi
3 732 (23.73%) 5G
4 731 (23.70%) Bluetooth
5 730 (23.66%) GSM
5 730 (23.66%) LTE
5 730 (23.66%) UMTS
6 218 (7.07%) Broadband
7 74 (2.40%) VPN
8 72 (2.33%) TCP/IP
9 27 (0.88%) VoIP
10 26 (0.84%) Firewall
11 15 (0.49%) DNS
12 10 (0.32%) DHCP
12 10 (0.32%) Internet
13 9 (0.29%) LAN
13 9 (0.29%) VLAN
13 9 (0.29%) WAN
14 5 (0.16%) FTP
14 5 (0.16%) HTTP
Database & Business Intelligence
1 95 (3.08%) Power BI
2 56 (1.82%) SQL Server
3 26 (0.84%) Big Data
4 24 (0.78%) MySQL
4 24 (0.78%) PostgreSQL
5 23 (0.75%) Data Warehouse
6 20 (0.65%) MongoDB
6 20 (0.65%) NoSQL
7 19 (0.62%) BusinessObjects
7 19 (0.62%) Relational Database
8 18 (0.58%) Tableau
9 16 (0.52%) Data Mining
10 13 (0.42%) BigQuery
11 11 (0.36%) Data Lake
11 11 (0.36%) DB2
11 11 (0.36%) Looker
12 10 (0.32%) Cloud Spanner
13 8 (0.26%) SQL Server Integration Services
14 7 (0.23%) Amazon RDS
14 7 (0.23%) Qlik Sense
Development Applications
1 73 (2.37%) JIRA
2 64 (2.07%) Cucumber
2 64 (2.07%) Robot Framework
3 44 (1.43%) Git
4 15 (0.49%) GitLab
4 15 (0.49%) Rational DOORS
5 13 (0.42%) Bitbucket
6 9 (0.29%) Jenkins
7 7 (0.23%) ClearCase
7 7 (0.23%) webpack
8 6 (0.19%) Grunt
8 6 (0.19%) Jasmine
8 6 (0.19%) Mocha
8 6 (0.19%) Visual Studio
9 4 (0.13%) Selenium
9 4 (0.13%) Subversion
10 2 (0.065%) CircleCI
10 2 (0.065%) Postman
10 2 (0.065%) Visual Studio Code
11 1 (0.032%) ER Studio
General
1 969 (31.41%) Social Skills
2 764 (24.76%) Electronics
3 639 (20.71%) Finance
4 301 (9.76%) Inclusion and Diversity
5 294 (9.53%) Analytical Skills
6 211 (6.84%) Retail
7 209 (6.77%) Aerospace
8 186 (6.03%) Marketing
9 156 (5.06%) Public Sector
10 154 (4.99%) Aeronautics
11 145 (4.70%) Legal
12 133 (4.31%) Banking
13 123 (3.99%) Telecoms
14 118 (3.82%) Law
15 114 (3.70%) Presentation Skills
16 90 (2.92%) Influencing Skills
17 81 (2.63%) Automotive
18 72 (2.33%) Manufacturing
19 61 (1.98%) Avionics
19 61 (1.98%) Organisational Skills
Job Titles
1 794 (25.74%) Test Engineer
2 730 (23.66%) Electronics Engineer
2 730 (23.66%) Electronics Test Engineer
3 701 (22.72%) Senior
4 449 (14.55%) Lead
5 376 (12.19%) Systems Engineer
6 368 (11.93%) Senior Systems Engineer
7 228 (7.39%) Support Engineer
8 188 (6.09%) Team Leader
9 128 (4.15%) Lead Systems Engineer
10 105 (3.40%) Developer
11 84 (2.72%) Architect
12 78 (2.53%) Analyst
13 72 (2.33%) Senior Manager
14 71 (2.30%) DevOps Engineer
15 65 (2.11%) Test Automation Engineer
16 63 (2.04%) Development Manager
17 53 (1.72%) Software Engineer
18 47 (1.52%) Risk Manager
19 46 (1.49%) Business Manager
Libraries, Frameworks & Software Standards
1 92 (2.98%) .NET
2 61 (1.98%) React
3 44 (1.43%) AngularJS
4 35 (1.13%) RESTful
5 29 (0.94%) .NET Framework
6 24 (0.78%) CSS
6 24 (0.78%) YAML
7 23 (0.75%) OAuth
8 21 (0.68%) JWT
9 20 (0.65%) HTML
10 18 (0.58%) Spring Boot
11 17 (0.55%) Bootstrap
11 17 (0.55%) Kafka
11 17 (0.55%) REST
12 16 (0.52%) React Native
13 14 (0.45%) Node.js
14 12 (0.39%) .NET Core
14 12 (0.39%) GraphQL
14 12 (0.39%) jQuery
14 12 (0.39%) Vue
Miscellaneous
1 760 (24.64%) Driving Licence
2 111 (3.60%) Product Ownership
3 110 (3.57%) e-Learning
4 108 (3.50%) Hybrid Cloud
5 98 (3.18%) Management Information System
6 64 (2.07%) Linux Command Line
7 63 (2.04%) Onboarding
8 58 (1.88%) Self-Motivation
9 54 (1.75%) Data Structures
10 49 (1.59%) Cloud Native
11 46 (1.49%) Greenfield Project
12 39 (1.26%) Robotics
13 38 (1.23%) Blockchain
14 34 (1.10%) Security Posture
15 31 (1.00%) FMCG
16 30 (0.97%) Public Cloud
17 29 (0.94%) Algorithms
18 28 (0.91%) Social Media
19 25 (0.81%) PMI
20 23 (0.75%) Data Centre
Operating Systems
1 378 (12.25%) Windows
2 216 (7.00%) Windows Server 2012
3 124 (4.02%) Linux
4 29 (0.94%) Apple iOS
4 29 (0.94%) Windows Server
5 20 (0.65%) Android
6 11 (0.36%) Windows 10
7 10 (0.32%) Mac OS
7 10 (0.32%) Windows Vista
8 5 (0.16%) Unix
9 2 (0.065%) Red Hat Enterprise Linux
10 1 (0.032%) Ubuntu
10 1 (0.032%) Windows Server 2016
10 1 (0.032%) Windows Server 2019
Processes & Methodologies
1 1,764 (57.18%) Mentoring
2 797 (25.83%) Customer Requirements
3 796 (25.80%) Agile
4 766 (24.83%) Validation
5 752 (24.38%) Verification and Validation
6 741 (24.02%) Test Strategy
7 405 (13.13%) Systems Engineering
8 390 (12.64%) Problem-Solving
9 367 (11.90%) Continuous Improvement
10 325 (10.53%) DevOps
11 302 (9.79%) Creative Thinking
12 299 (9.69%) Mathematics
13 283 (9.17%) Physics
14 244 (7.91%) Artificial Intelligence
15 238 (7.71%) Stakeholder Management
16 232 (7.52%) Project Management
17 230 (7.46%) Proactive Maintenance
18 221 (7.16%) Risk Management
19 218 (7.07%) Proactive Monitoring
20 216 (7.00%) Procure-to-Pay
Programming Languages
1 174 (5.64%) Python
2 159 (5.15%) SQL
3 134 (4.34%) JavaScript
4 114 (3.70%) PowerShell
5 102 (3.31%) C#
6 85 (2.76%) Java
7 74 (2.40%) Bash
8 54 (1.75%) TypeScript
9 21 (0.68%) R
9 21 (0.68%) VBA
10 18 (0.58%) MATLAB
11 13 (0.42%) Bicep
11 13 (0.42%) C++
12 10 (0.32%) C
13 9 (0.29%) Go
13 9 (0.29%) Kotlin
13 9 (0.29%) PHP
14 8 (0.26%) T-SQL
15 6 (0.19%) Ada
16 4 (0.13%) Ruby
Qualifications
1 1,654 (53.61%) Degree
2 876 (28.40%) HND
3 391 (12.67%) BPSS Clearance
4 102 (3.31%) Security Cleared
5 90 (2.92%) HNC
6 68 (2.20%) Master's Degree
7 49 (1.59%) DBS Check
8 47 (1.52%) Computer Science Degree
9 44 (1.43%) CRISC
9 44 (1.43%) PMI Certification
10 43 (1.39%) ACCA
10 43 (1.39%) CISSP
11 41 (1.33%) Microsoft Certification
12 37 (1.20%) CISM
13 36 (1.17%) DV Cleared
14 35 (1.13%) Chartered Engineer
15 34 (1.10%) CISA
16 32 (1.04%) SC Cleared
17 28 (0.91%) Six Sigma Black Belt
18 27 (0.88%) Six Sigma Green Belt
Quality Assurance & Compliance
1 144 (4.67%) QA
2 121 (3.92%) ARP4754
2 121 (3.92%) DO-254
2 121 (3.92%) IEC 61508
3 77 (2.50%) ISO/IEC 27001
4 45 (1.46%) ITGC
5 34 (1.10%) Data Quality
6 30 (0.97%) Accessibility
7 29 (0.94%) NIST
8 27 (0.88%) GDPR
9 24 (0.78%) NCSC
9 24 (0.78%) Sarbanes-Oxley
10 23 (0.75%) PMO
10 23 (0.75%) SOC 2
11 21 (0.68%) GAAP
11 21 (0.68%) IFRS
12 20 (0.65%) Cyber Essentials
12 20 (0.65%) SLA
13 18 (0.58%) PMBOK
14 17 (0.55%) ISO 9001
System Software
1 253 (8.20%) Active Directory
2 50 (1.62%) Docker
3 14 (0.45%) Hyper-V
4 10 (0.32%) Virtual Desktop
5 7 (0.23%) Virtual Machines
6 6 (0.19%) Embedded Firmware
6 6 (0.19%) Firmware
6 6 (0.19%) VMware Infrastructure
7 4 (0.13%) VMware ESXi
8 3 (0.097%) Apache Flume
8 3 (0.097%) HDFS
9 2 (0.065%) Virtual Servers
10 1 (0.032%) vSphere
Systems Management
1 77 (2.50%) Kubernetes
2 52 (1.69%) Terraform
3 16 (0.52%) Ansible
3 16 (0.52%) Microsoft Intune
4 10 (0.32%) Grafana
5 8 (0.26%) SCCM
6 6 (0.19%) Prometheus
7 5 (0.16%) CASB
8 4 (0.13%) Argo
8 4 (0.13%) Kibana
8 4 (0.13%) logstash
8 4 (0.13%) QRadar
8 4 (0.13%) vCenter Server
9 3 (0.097%) Autotask
9 3 (0.097%) Oozie
10 2 (0.065%) Progress Chef
10 2 (0.065%) Puppet
10 2 (0.065%) SCOM
10 2 (0.065%) WMI
10 2 (0.065%) WSUS
Vendors
1 528 (17.12%) Microsoft
2 215 (6.97%) Sun
3 105 (3.40%) IBM
4 94 (3.05%) Red Hat
5 62 (2.01%) Oracle
6 60 (1.94%) BT
7 50 (1.62%) Google
7 50 (1.62%) MathWorks
7 50 (1.62%) ServiceNow
8 42 (1.36%) Databricks
9 39 (1.26%) Adobe
10 36 (1.17%) Salesforce
10 36 (1.17%) SAP
11 30 (0.97%) TikTok
12 26 (0.84%) Workday
13 24 (0.78%) Facebook
13 24 (0.78%) Informatica
13 24 (0.78%) Siemens
14 17 (0.55%) Apple
15 16 (0.52%) Cisco