Microsoft Excel Jobs in the North of England

Microsoft Excel
England > North of England

The table below provides summary statistics for permanent job vacancies advertised in the North of England requiring Microsoft Excel skills. It includes a benchmarking guide to the annual salaries offered in vacancies that cited Microsoft Excel over the 6 months leading up to 18 May 2025, comparing them to the same period in the previous two years.

6 months to
18 May 2025
Same period 2024 Same period 2023
Rank 74 77 83
Rank change year-on-year +3 +6 +26
Permanent jobs citing Microsoft Excel 475 549 668
As % of all permanent jobs advertised in the North of England 4.04% 3.11% 3.97%
As % of the Applications category 30.96% 39.50% 46.39%
Number of salaries quoted 318 344 283
10th Percentile £25,480 £23,500 £22,000
25th Percentile £37,500 £26,000 £30,500
Median annual salary (50th Percentile) £50,000 £33,359 £34,000
Median % change year-on-year +49.88% -1.88% -12.54%
75th Percentile £51,240 £45,000 £47,492
90th Percentile £57,875 £52,500 £52,977
England median annual salary £46,000 £40,000 £45,000
% change year-on-year +15.00% -11.11% -

All Software Application Skills
North of England

Microsoft Excel falls under the Software Applications category. For comparison with the information above, the following table provides summary statistics for all permanent job vacancies requiring software application skills in the North of England.

Permanent vacancies with a requirement for software application skills 1,534 1,390 1,440
As % of all permanent jobs advertised in the North of England 13.04% 7.87% 8.55%
Number of salaries quoted 766 986 719
10th Percentile £26,943 £23,500 £22,000
25th Percentile £37,574 £26,250 £27,600
Median annual salary (50th Percentile) £47,683 £33,000 £36,500
Median % change year-on-year +44.49% -9.59% -2.67%
75th Percentile £51,240 £44,500 £50,000
90th Percentile £58,750 £57,500 £62,500
England median annual salary £47,683 £37,572 £45,000
% change year-on-year +26.91% -16.51% -

Microsoft Excel
Job Vacancy Trend in the North of England

Job postings citing Microsoft Excel as a proportion of all IT jobs advertised in the North of England.
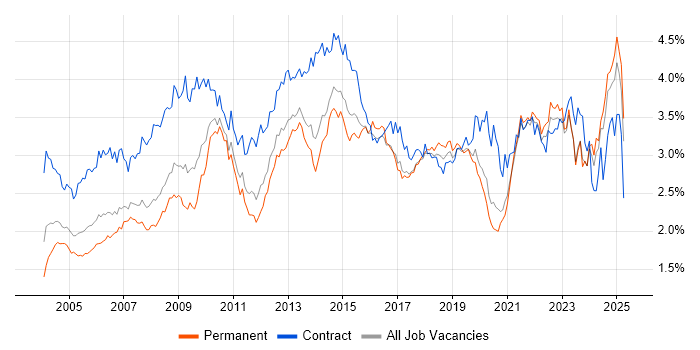
Job vacancy trend for Microsoft Excel in the North of England

Microsoft Excel
Salary Trend in the North of England

3-month moving average salary quoted in jobs citing Microsoft Excel in the North of England.

Salary trend for Microsoft Excel in the North of England

Microsoft Excel
Salary Histogram in the North of England

Salary distribution for jobs citing Microsoft Excel in the North of England over the 6 months to 18 May 2025.

Salary histogram for Microsoft Excel in the North of England

Microsoft Excel
Job Locations in the North of England

The table below looks at the demand and provides a guide to the median salaries quoted in IT jobs citing Microsoft Excel within the North of England region over the 6 months to 18 May 2025. The 'Rank Change' column provides an indication of the change in demand within each location based on the same 6 month period last year.

Location Rank Change
on Same Period
Last Year
Matching
Permanent
IT Job Ads
Median Salary
Past 6 Months
Median Salary
% Change
on Same Period
Last Year
Live
Jobs
North West -1 402 £50,055 +43.01% 214
Yorkshire -3 61 £29,500 -15.71% 138
North East -6 12 £39,100 +30.33% 51
Microsoft Excel
England

Microsoft Excel
Co-occurring Skills and Capabilities in the North of England by Category

The follow tables expand on the table above by listing co-occurrences grouped by category. The same employment type, locality and period is covered with up to 20 co-occurrences shown in each of the following categories:

Application Platforms
1 12 (2.53%) Confluence
2 10 (2.11%) SharePoint
3 6 (1.26%) WordPress
4 4 (0.84%) Jupyter
5 3 (0.63%) CMS
6 2 (0.42%) IBM Domino
Applications
1 281 (59.16%) Microsoft PowerPoint
2 250 (52.63%) Microsoft Office
3 49 (10.32%) Microsoft Project
4 12 (2.53%) Spreadsheet
5 10 (2.11%) MS Visio
Business Applications
1 159 (33.47%) Teamcenter
2 4 (0.84%) Markit EDM
3 3 (0.63%) Dynamics NAV
3 3 (0.63%) Maximo
3 3 (0.63%) Oracle EBS
4 2 (0.42%) Dynamics CRM
4 2 (0.42%) NetSuite
4 2 (0.42%) SAP BPC
5 1 (0.21%) iTrent
5 1 (0.21%) NEC Housing
Cloud Services
1 68 (14.32%) Power Platform
2 31 (6.53%) Microsoft 365
3 23 (4.84%) Azure
4 13 (2.74%) Google Analytics
5 9 (1.89%) Entra ID
6 6 (1.26%) Google Ads
7 4 (0.84%) Dynamics 365
7 4 (0.84%) Figma
7 4 (0.84%) Google Data Studio
7 4 (0.84%) Google Sheets
7 4 (0.84%) Google Workspace
7 4 (0.84%) Miro
7 4 (0.84%) SaaS
7 4 (0.84%) Slack
8 3 (0.63%) Canva
9 2 (0.42%) Adobe Analytics
9 2 (0.42%) Azure DevOps
9 2 (0.42%) Google Docs
9 2 (0.42%) Google Drive
9 2 (0.42%) Snowflake
Communications & Networking
1 13 (2.74%) Firewall
2 10 (2.11%) LAN
3 9 (1.89%) Intranet
4 4 (0.84%) Wireless
5 2 (0.42%) Structured Cabling
5 2 (0.42%) VoIP
6 1 (0.21%) Broadband
6 1 (0.21%) Internet
6 1 (0.21%) Kerberos
6 1 (0.21%) Modbus
6 1 (0.21%) PBX
6 1 (0.21%) RTP
6 1 (0.21%) Unified Communications
6 1 (0.21%) WPA
Database & Business Intelligence
1 68 (14.32%) Power BI
2 23 (4.84%) Tableau
3 10 (2.11%) Power Query
4 5 (1.05%) SQL Server
5 4 (0.84%) Data Lake
5 4 (0.84%) Dremio
5 4 (0.84%) Oracle Reports
5 4 (0.84%) PowerPivot
6 2 (0.42%) BigQuery
6 2 (0.42%) BusinessObjects
6 2 (0.42%) Data Warehouse
6 2 (0.42%) SQL Server Integration Services
6 2 (0.42%) SQL Server Reporting Services
7 1 (0.21%) BusinessObjects Web Intelligence
7 1 (0.21%) Data Mining
7 1 (0.21%) MySQL
7 1 (0.21%) Qlik Sense
7 1 (0.21%) QlikView
Development Applications
1 17 (3.58%) JIRA
2 4 (0.84%) Balsamiq
3 2 (0.42%) Git
3 2 (0.42%) SQL Server Management Studio (SSMS)
4 1 (0.21%) ClearCase
4 1 (0.21%) ClearQuest
4 1 (0.21%) LabVIEW
4 1 (0.21%) Maven
4 1 (0.21%) Rational DOORS
4 1 (0.21%) Subversion
General
1 351 (73.89%) Social Skills
2 161 (33.89%) Aerospace
3 159 (33.47%) Automotive
4 123 (25.89%) Finance
5 84 (17.68%) Analytical Skills
6 46 (9.68%) Presentation Skills
7 32 (6.74%) Organisational Skills
8 23 (4.84%) Marketing
9 14 (2.95%) Manufacturing
10 10 (2.11%) Inclusion and Diversity
10 10 (2.11%) Public Sector
10 10 (2.11%) Retail
11 7 (1.47%) Advertising
12 5 (1.05%) Banking
12 5 (1.05%) Billing
12 5 (1.05%) Law
13 4 (0.84%) Back Office
13 4 (0.84%) Financial Institution
13 4 (0.84%) Legal
13 4 (0.84%) Pharmaceutical
Job Titles
1 160 (33.68%) Systems Engineer
2 87 (18.32%) Analyst
3 71 (14.95%) Project Manager
4 42 (8.84%) Assistant Project Manager
5 40 (8.42%) Data Analyst
6 37 (7.79%) Administrator
7 26 (5.47%) Procurement Analyst
8 24 (5.05%) Integration Engineer
8 24 (5.05%) Senior
8 24 (5.05%) Systems Integration Engineer
9 16 (3.37%) IT Administrator
10 15 (3.16%) Senior Systems Engineer
11 13 (2.74%) ERP Manager
11 13 (2.74%) ERP Project Manager
11 13 (2.74%) Financial Analyst
12 12 (2.53%) Lead
13 11 (2.32%) IT Support
14 9 (1.89%) Development Manager
14 9 (1.89%) Service Desk Engineer
15 7 (1.47%) CRM Executive
Libraries, Frameworks & Software Standards
1 2 (0.42%) .NET
1 2 (0.42%) XML
2 1 (0.21%) .NET Framework
2 1 (0.21%) Drools
2 1 (0.21%) Lightning Web Components
2 1 (0.21%) OAuth
2 1 (0.21%) OpenID
2 1 (0.21%) SAML
Miscellaneous
1 48 (10.11%) Management Information System
2 28 (5.89%) Social Media
3 19 (4.00%) Data Protection Act
4 16 (3.37%) Onboarding
5 12 (2.53%) Product Ownership
6 11 (2.32%) FMCG
7 9 (1.89%) e-Learning
8 7 (1.47%) Self-Motivation
9 5 (1.05%) Analytical Mindset
9 5 (1.05%) Data Structures
10 4 (0.84%) Blackberry
10 4 (0.84%) Equities
10 4 (0.84%) Life Science
10 4 (0.84%) Reference Data
11 3 (0.63%) CCTV
11 3 (0.63%) Graphic Design
11 3 (0.63%) Legacy Systems
11 3 (0.63%) PMI
11 3 (0.63%) Pricing Data
12 2 (0.42%) Public Cloud
Operating Systems
1 31 (6.53%) Windows
2 10 (2.11%) Windows 10
3 9 (1.89%) Windows Server
4 8 (1.68%) Windows Vista
5 4 (0.84%) Android
Processes & Methodologies
1 160 (33.68%) PLM
2 157 (33.05%) Systems Engineering
3 64 (13.47%) Data Analysis
4 61 (12.84%) Analytics
5 59 (12.42%) ERP
5 59 (12.42%) Process Improvement
6 55 (11.58%) Business Intelligence
7 53 (11.16%) Customer Service
7 53 (11.16%) Data Management
8 51 (10.74%) Continuous Improvement
8 51 (10.74%) Project Delivery
9 49 (10.32%) Project Management
10 46 (9.68%) Problem-Solving
10 46 (9.68%) Visualisation
11 41 (8.63%) Economics
12 34 (7.16%) Decision-Making
13 33 (6.95%) Data Analytics
14 28 (5.89%) Agile
15 26 (5.47%) Indirect Procurement
15 26 (5.47%) Source to Pay
Programming Languages
1 159 (33.47%) MATLAB
2 45 (9.47%) SQL
3 8 (1.68%) VBA
4 7 (1.47%) Python
4 7 (1.47%) VB
5 6 (1.26%) T-SQL
6 3 (0.63%) Data Analysis Expressions
6 3 (0.63%) PL/SQL
7 2 (0.42%) R
8 1 (0.21%) C#
8 1 (0.21%) C++
8 1 (0.21%) Java
Qualifications
1 253 (53.26%) Degree
2 211 (44.42%) BPSS Clearance
3 168 (35.37%) HND
4 160 (33.68%) HNC
5 41 (8.63%) DBS Check
6 14 (2.95%) Master's Degree
6 14 (2.95%) MBA
7 12 (2.53%) ACCA
7 12 (2.53%) CIMA
8 9 (1.89%) SC Cleared
8 9 (1.89%) Security Cleared
9 8 (1.68%) PRINCE2 Certification
10 4 (0.84%) AAT
10 4 (0.84%) ITIL Certification
10 4 (0.84%) Microsoft Certification
10 4 (0.84%) PMI Certification
11 3 (0.63%) Tableau Certification
12 2 (0.42%) BICSI RCDD
12 2 (0.42%) ITIL Foundation Certificate
13 1 (0.21%) PMP
Quality Assurance & Compliance
1 47 (9.89%) Data Quality
2 25 (5.26%) SLA
3 6 (1.26%) QA
4 3 (0.63%) ISO 14001
4 3 (0.63%) ISO 9001
4 3 (0.63%) ISO/IEC 27001
5 2 (0.42%) GDPR
6 1 (0.21%) IFRS
6 1 (0.21%) PMO
System Software
1 27 (5.68%) Active Directory
2 2 (0.42%) Hyper-V
2 2 (0.42%) VMware Infrastructure
Systems Management
1 2 (0.42%) Microsoft Intune
2 1 (0.21%) Single Sign-On
Vendors
1 317 (66.74%) Microsoft
2 159 (33.47%) ANSYS
3 42 (8.84%) SAP
4 20 (4.21%) Google
5 18 (3.79%) Salesforce
6 13 (2.74%) IFS
7 11 (2.32%) Capita
8 8 (1.68%) Adobe
8 8 (1.68%) Bloomberg
9 6 (1.26%) Oracle
10 5 (1.05%) ServiceNow
11 4 (0.84%) Cognos
11 4 (0.84%) Databricks
11 4 (0.84%) iManage
11 4 (0.84%) Intapp
11 4 (0.84%) Reuters
12 2 (0.42%) Freshdesk
12 2 (0.42%) Hyperion
12 2 (0.42%) VMware
12 2 (0.42%) YouTube