Analytics Jobs in the North of England

Analytics
England > North of England

The table below provides summary statistics for permanent job vacancies advertised in the North of England requiring Analytics skills. It includes a benchmarking guide to the annual salaries offered in vacancies that cited Analytics over the 6 months leading up to 29 May 2025, comparing them to the same period in the previous two years.

6 months to
29 May 2025
Same period 2024 Same period 2023
Rank 74 37 21
Rank change year-on-year -37 -16 +20
Permanent jobs citing Analytics 469 902 1,731
As % of all permanent jobs advertised in the North of England 4.05% 4.96% 10.46%
As % of the Processes & Methodologies category 4.29% 6.06% 10.81%
Number of salaries quoted 222 680 423
10th Percentile £25,481 £31,250 £36,250
25th Percentile £41,375 £39,500 £46,250
Median annual salary (50th Percentile) £55,000 £50,000 £60,000
Median % change year-on-year +10.00% -16.67% +9.09%
75th Percentile £77,375 £66,250 £74,700
90th Percentile £87,500 £88,750 £83,750
England median annual salary £65,000 £59,000 £67,003
% change year-on-year +10.17% -11.94% +3.08%

All Process and Methodology Skills
North of England

Analytics falls under the Processes and Methodologies category. For comparison with the information above, the following table provides summary statistics for all permanent job vacancies requiring process or methodology skills in the North of England.

Permanent vacancies with a requirement for process or methodology skills 10,934 14,895 16,009
As % of all permanent jobs advertised in the North of England 94.33% 81.86% 96.70%
Number of salaries quoted 5,434 11,380 7,847
10th Percentile £25,087 £27,500 £31,250
25th Percentile £37,500 £37,074 £40,000
Median annual salary (50th Percentile) £50,055 £50,000 £55,000
Median % change year-on-year +0.11% -9.09% +10.00%
75th Percentile £61,992 £65,000 £70,000
90th Percentile £77,500 £80,000 £81,250
England median annual salary £57,500 £55,000 £62,500
% change year-on-year +4.55% -12.00% +4.17%

Analytics
Job Vacancy Trend in the North of England

Job postings citing Analytics as a proportion of all IT jobs advertised in the North of England.
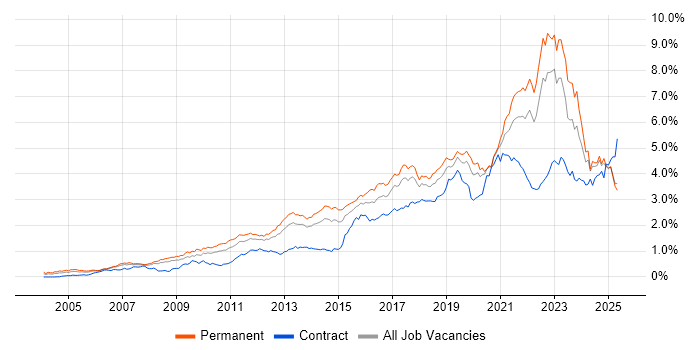
Job vacancy trend for Analytics in the North of England

Analytics
Salary Trend in the North of England

3-month moving average salary quoted in jobs citing Analytics in the North of England.

Salary trend for Analytics in the North of England

Analytics
Salary Histogram in the North of England

Salary distribution for jobs citing Analytics in the North of England over the 6 months to 29 May 2025.

Salary histogram for Analytics in the North of England

Analytics
Job Locations in the North of England

The table below looks at the demand and provides a guide to the median salaries quoted in IT jobs citing Analytics within the North of England region over the 6 months to 29 May 2025. The 'Rank Change' column provides an indication of the change in demand within each location based on the same 6 month period last year.

Location Rank Change
on Same Period
Last Year
Matching
Permanent
IT Job Ads
Median Salary
Past 6 Months
Median Salary
% Change
on Same Period
Last Year
Live
Jobs
North West -54 324 £53,750 +3.20% 386
Yorkshire +4 134 £58,650 +29.62% 176
North East -20 15 £51,000 +2.00% 83
Analytics
England

Analytics
Co-occurring Skills and Capabilities in the North of England by Category

The follow tables expand on the table above by listing co-occurrences grouped by category. The same employment type, locality and period is covered with up to 20 co-occurrences shown in each of the following categories:

Application Platforms
1 16 (3.41%) SAS
2 15 (3.20%) Oracle Application Server
3 14 (2.99%) CMS
4 13 (2.77%) Apache Spark
5 9 (1.92%) Apache
5 9 (1.92%) WordPress
6 4 (0.85%) Apache Airflow
6 4 (0.85%) IBM Domino
7 3 (0.64%) Microsoft Exchange
7 3 (0.64%) SharePoint
8 2 (0.43%) Confluence
8 2 (0.43%) nginx
9 1 (0.21%) SharePoint Server
Applications
1 62 (13.22%) Microsoft Excel
2 20 (4.26%) Microsoft PowerPoint
3 9 (1.92%) Microsoft Office
4 4 (0.85%) Adobe Illustrator
4 4 (0.85%) Adobe Premiere
4 4 (0.85%) Photoshop
5 1 (0.21%) Adobe Creative Suite
5 1 (0.21%) Chatbot
5 1 (0.21%) SPSS
Business Applications
1 4 (0.85%) IBM Planning Analytics
1 4 (0.85%) Infor LN
1 4 (0.85%) Oracle ERP
2 3 (0.64%) NetSuite
2 3 (0.64%) Shopify
3 2 (0.43%) Dynamics CRM
3 2 (0.43%) Payment Gateway
4 1 (0.21%) iTrent
4 1 (0.21%) SAP S/4HANA
Cloud Services
1 130 (27.72%) Power Platform
2 70 (14.93%) Azure
3 44 (9.38%) AWS
4 42 (8.96%) Google Analytics
5 21 (4.48%) Snowflake
6 18 (3.84%) GCP
7 17 (3.62%) Azure Data Factory
8 13 (2.77%) Azure DevOps
8 13 (2.77%) Azure Synapse Analytics
9 11 (2.35%) Google Ads
10 10 (2.13%) dbt
10 10 (2.13%) SaaS
11 9 (1.92%) Azure Monitor
11 9 (1.92%) Serverless
12 8 (1.71%) Entra ID
12 8 (1.71%) Facebook Ads
13 7 (1.49%) Power Automate
14 6 (1.28%) Microsoft 365
15 5 (1.07%) AWS CloudFormation
15 5 (1.07%) Cloud Computing
Communications & Networking
1 7 (1.49%) DNS
2 4 (0.85%) Firewall
2 4 (0.85%) SD-WAN
2 4 (0.85%) VPN
2 4 (0.85%) WAN
3 2 (0.43%) Reverse Proxy
3 2 (0.43%) TCP/IP
4 1 (0.21%) Internet
Database & Business Intelligence
1 127 (27.08%) Power BI
2 38 (8.10%) Data Warehouse
3 35 (7.46%) Big Data
4 24 (5.12%) Tableau
5 22 (4.69%) Data Lake
5 22 (4.69%) SQL Server
6 18 (3.84%) Oracle Reports
7 15 (3.20%) Enterprise Data Warehouse
8 12 (2.56%) MySQL
9 9 (1.92%) Relational Database
10 7 (1.49%) Amazon Athena
10 7 (1.49%) BusinessObjects
10 7 (1.49%) NoSQL
10 7 (1.49%) Power Query
11 6 (1.28%) MongoDB
12 5 (1.07%) GIS
12 5 (1.07%) Hadoop
12 5 (1.07%) Oracle Database
12 5 (1.07%) PostgreSQL
13 4 (0.85%) Azure SQL Database
Development Applications
1 16 (3.41%) Git
2 9 (1.92%) JIRA
3 7 (1.49%) Jenkins
4 4 (0.85%) Cypress.io
4 4 (0.85%) Eclipse
4 4 (0.85%) Eclipse RCP
5 3 (0.64%) GitLab
5 3 (0.64%) Selenium
6 2 (0.43%) ER Studio
6 2 (0.43%) JUnit
6 2 (0.43%) SQL Server Management Studio (SSMS)
7 1 (0.21%) Jasmine
7 1 (0.21%) JMeter
7 1 (0.21%) MLflow
7 1 (0.21%) Postman
7 1 (0.21%) RStudio
7 1 (0.21%) SonarQube
General
1 255 (54.37%) Social Skills
2 195 (41.58%) Finance
3 104 (22.17%) Analytical Skills
4 67 (14.29%) Organisational Skills
5 60 (12.79%) Banking
6 56 (11.94%) Inclusion and Diversity
7 55 (11.73%) Marketing
8 39 (8.32%) Retail
9 27 (5.76%) Presentation Skills
10 25 (5.33%) Advertising
11 17 (3.62%) Military
12 14 (2.99%) Manufacturing
13 9 (1.92%) Automotive
13 9 (1.92%) Law
14 7 (1.49%) Legal
14 7 (1.49%) Public Sector
15 4 (0.85%) Brand Awareness
15 4 (0.85%) Influencing Skills
15 4 (0.85%) Pharmaceutical
15 4 (0.85%) Wholesale Banking
Job Titles
1 145 (30.92%) Analyst
2 77 (16.42%) Senior
3 62 (13.22%) Data Analyst
4 46 (9.81%) Digital Analyst
5 43 (9.17%) Lead
6 40 (8.53%) Data Engineer
7 27 (5.76%) Developer
8 26 (5.54%) Procurement Analyst
9 21 (4.48%) Graduate
10 20 (4.26%) Architect
10 20 (4.26%) Graduate Analyst
11 19 (4.05%) Senior Analyst
12 18 (3.84%) Compliance Analyst
12 18 (3.84%) Senior Data Engineer
13 16 (3.41%) Data Manager
13 16 (3.41%) Data Scientist
14 15 (3.20%) Product Manager
15 11 (2.35%) Project Manager
16 8 (1.71%) DevOps Engineer
16 8 (1.71%) Solutions Architect
Libraries, Frameworks & Software Standards
1 19 (4.05%) CSS
2 18 (3.84%) HTML
3 10 (2.13%) React
4 9 (1.92%) .NET
5 8 (1.71%) Middleware
5 8 (1.71%) RESTful
6 6 (1.28%) AngularJS
6 6 (1.28%) Node.js
7 5 (1.07%) Kafka
7 5 (1.07%) REST
8 4 (0.85%) ARM Templates
8 4 (0.85%) Jest
8 4 (0.85%) JSON
8 4 (0.85%) JSP
8 4 (0.85%) Next.js
8 4 (0.85%) PySpark
8 4 (0.85%) SOAP
8 4 (0.85%) TensorFlow
8 4 (0.85%) Vue
9 3 (0.64%) PyTorch
Miscellaneous
1 38 (8.10%) Management Information System
2 35 (7.46%) Product Ownership
3 15 (3.20%) Social Media
4 14 (2.99%) FMCG
5 11 (2.35%) Algorithms
6 8 (1.71%) Animation
6 8 (1.71%) Distributed Systems
6 8 (1.71%) Photography
6 8 (1.71%) Podcast
7 7 (1.49%) Analytical Mindset
7 7 (1.49%) Credit Risk
7 7 (1.49%) Data Centre
8 6 (1.28%) Hybrid Cloud
8 6 (1.28%) Mobile App
9 5 (1.07%) NHS
9 5 (1.07%) Social Network
10 4 (0.85%) Cyber Threat
10 4 (0.85%) Life Science
10 4 (0.85%) Mainframe
10 4 (0.85%) Market Risk
Operating Systems
1 11 (2.35%) Windows
2 10 (2.13%) Linux
3 2 (0.43%) Windows 10
3 2 (0.43%) Windows Server
4 1 (0.21%) Android
4 1 (0.21%) Apple iOS
4 1 (0.21%) Mac OS
4 1 (0.21%) Windows Server 2016
4 1 (0.21%) Windows Server 2019
Processes & Methodologies
1 174 (37.10%) Data Analytics
2 152 (32.41%) Agile
3 146 (31.13%) Business Intelligence
4 91 (19.40%) Problem-Solving
5 90 (19.19%) Visualisation
6 88 (18.76%) Artificial Intelligence
7 73 (15.57%) Data Management
8 64 (13.65%) Decision-Making
8 64 (13.65%) Time Management
9 58 (12.37%) Data Analysis
10 52 (11.09%) DevOps
10 52 (11.09%) Digital Strategy
11 51 (10.87%) Project Delivery
12 50 (10.66%) ETL
13 49 (10.45%) Data Pipeline
14 46 (9.81%) Technology Transformation
15 44 (9.38%) Economics
16 42 (8.96%) Data Modelling
16 42 (8.96%) ERP
16 42 (8.96%) Mentoring
Programming Languages
1 123 (26.23%) SQL
2 82 (17.48%) Python
3 21 (4.48%) Java
4 19 (4.05%) JavaScript
5 14 (2.99%) R
6 12 (2.56%) C#
6 12 (2.56%) PowerShell
7 10 (2.13%) T-SQL
7 10 (2.13%) TypeScript
8 9 (1.92%) PHP
9 8 (1.71%) Scala
10 6 (1.28%) Data Analysis Expressions
11 5 (1.07%) VB
12 4 (0.85%) Ada
12 4 (0.85%) Bicep
12 4 (0.85%) C++
12 4 (0.85%) Rust
12 4 (0.85%) Shell Script
13 2 (0.43%) Bash
13 2 (0.43%) VBA
Qualifications
1 193 (41.15%) Degree
2 29 (6.18%) DBS Check
3 22 (4.69%) BPSS Clearance
3 22 (4.69%) Master's Degree
4 20 (4.26%) ACCA
4 20 (4.26%) CIMA
5 16 (3.41%) ICAEW
6 12 (2.56%) CCAB
6 12 (2.56%) CIPFA
7 11 (2.35%) MBA
8 10 (2.13%) Azure Certification
9 8 (1.71%) Computer Science Degree
9 8 (1.71%) Security Cleared
10 6 (1.28%) PhD
11 4 (0.85%) Microsoft Certification
11 4 (0.85%) SC Cleared
12 3 (0.64%) Tableau Certification
13 2 (0.43%) AWS Certified Solutions Architect
13 2 (0.43%) CISA
13 2 (0.43%) SnowPro
Quality Assurance & Compliance
1 65 (13.86%) Data Quality
2 18 (3.84%) EMIR
2 18 (3.84%) MiFID
3 17 (3.62%) GDPR
4 11 (2.35%) Accessibility
5 9 (1.92%) IFRS
6 7 (1.49%) PCI DSS
7 6 (1.28%) Actionable Recommendations
7 6 (1.28%) SOC 2
8 4 (0.85%) Basel II
8 4 (0.85%) Basel III
8 4 (0.85%) Dodd-Frank
8 4 (0.85%) HIPAA
8 4 (0.85%) IFRS 9
8 4 (0.85%) QA
9 2 (0.43%) ISO/IEC 27001
9 2 (0.43%) Sarbanes-Oxley
10 1 (0.21%) California Consumer Privacy Act
10 1 (0.21%) ITGC
10 1 (0.21%) SLA
System Software
1 13 (2.77%) Docker
2 9 (1.92%) Virtual Machines
3 4 (0.85%) Active Directory
4 2 (0.43%) VMware Infrastructure
5 1 (0.21%) BitLocker
5 1 (0.21%) Hyper-V
5 1 (0.21%) Microsoft App-V
5 1 (0.21%) Virtual Desktop
5 1 (0.21%) vSphere
Systems Management
1 10 (2.13%) Kubernetes
1 10 (2.13%) Terraform
2 4 (0.85%) Single Sign-On
3 3 (0.64%) Ansible
4 2 (0.43%) Prometheus
4 2 (0.43%) SCCM
5 1 (0.21%) Active Directory Federation Services
5 1 (0.21%) Failover Clustering
5 1 (0.21%) Microsoft Intune
Vendors
1 61 (13.01%) Microsoft
2 49 (10.45%) Alteryx
3 48 (10.23%) Google
4 42 (8.96%) SAP
5 34 (7.25%) Oracle
6 22 (4.69%) Databricks
7 12 (2.56%) Capita
8 10 (2.13%) Facebook
8 10 (2.13%) ServiceNow
9 9 (1.92%) IBM
10 7 (1.49%) TikTok
11 6 (1.28%) Adobe
11 6 (1.28%) Hotjar
12 4 (0.85%) Bloomberg
12 4 (0.85%) Cognos
12 4 (0.85%) Hyperion
12 4 (0.85%) Infor
12 4 (0.85%) Instagram
12 4 (0.85%) Meraki
12 4 (0.85%) Palantir