Risk Management
UK

The following table provides summary statistics for permanent job vacancies with a requirement for Risk Management skills. Included is a benchmarking guide to the salaries offered in vacancies that have cited Risk Management over the 6 months to 30 November 2023 with a comparison to the same period in the previous 2 years.

6 months to
30 Nov 2023
Same period 2022 Same period 2021
Rank 114 105 110
Rank change year-on-year -9 +5 +101
Permanent jobs citing Risk Management 1,535 4,141 4,125
As % of all permanent jobs advertised in the UK 2.85% 3.28% 3.19%
As % of the Processes & Methodologies category 3.03% 3.42% 3.34%
Number of salaries quoted 1,019 2,234 1,796
10th Percentile £44,500 £38,750 £40,250
25th Percentile £52,000 £51,250 £50,000
Median annual salary (50th Percentile) £70,000 £67,500 £65,000
Median % change year-on-year +3.70% +3.85% -
75th Percentile £88,916 £85,000 £85,000
90th Percentile £112,500 £105,000 £102,500
UK excluding London median annual salary £60,000 £57,500 £55,000
% change year-on-year +4.35% +4.55% -5.17%

All Process and Methodology Skills
UK

Risk Management is in the Processes and Methodologies category. The following table is for comparison with the above and provides summary statistics for all permanent job vacancies with a requirement for process or methodology skills.

Permanent vacancies with a requirement for process or methodology skills 50,664 120,987 123,563
As % of all permanent jobs advertised in the UK 94.08% 95.74% 95.44%
Number of salaries quoted 36,731 73,454 82,144
10th Percentile £32,500 £34,347 £32,500
25th Percentile £43,750 £45,000 £42,500
Median annual salary (50th Percentile) £60,000 £60,000 £59,500
Median % change year-on-year - +0.84% +8.18%
75th Percentile £80,000 £81,250 £77,500
90th Percentile £98,750 £100,000 £95,000
UK excluding London median annual salary £52,500 £53,000 £50,000
% change year-on-year -0.94% +6.00% +4.17%

Risk Management
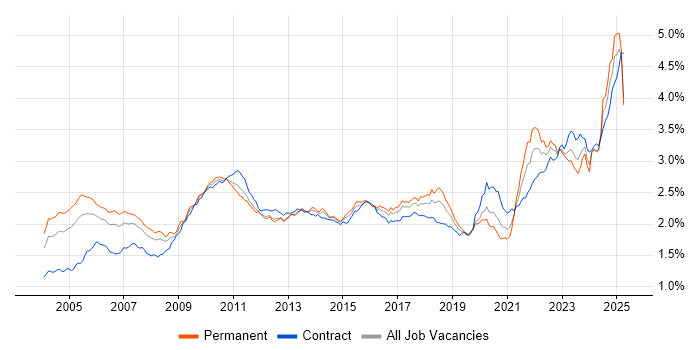
Job Vacancy Trend

Job postings citing Risk Management as a proportion of all IT jobs advertised.

Job vacancy trend for Risk Management in the UK

Risk Management
Salary Trend

3-month moving average salary quoted in jobs citing Risk Management.

Salary trend for Risk Management in the UK

Risk Management
Salary Histogram

Salary distribution for jobs citing Risk Management over the 6 months to 30 November 2023.

Salary histogram for Risk Management in the UK

Risk Management
Top 18 Job Locations

The table below looks at the demand and provides a guide to the median salaries quoted in IT jobs citing Risk Management within the UK over the 6 months to 30 November 2023. The 'Rank Change' column provides an indication of the change in demand within each location based on the same 6 month period last year.

Location Rank Change
on Same Period
Last Year
Matching
Permanent
IT Job Ads
Median Salary
Past 6 Months
Median Salary
% Change
on Same Period
Last Year
Live
Jobs
England -12 1,328 £70,000 +3.70% 1,236
UK excluding London -16 869 £60,000 +4.35% 647
Work from Home +13 608 £70,000 +4.34% 487
London -9 589 £80,000 +6.67% 681
North of England +41 211 £60,000 +4.35% 164
South East -48 169 £58,025 +5.50% 179
South West +36 166 £70,000 +16.67% 115
Midlands +10 122 £54,000 -1.82% 82
North West +33 108 £60,000 +6.67% 104
Yorkshire +46 97 £70,576 +19.59% 46
West Midlands +27 95 £54,000 +0.93% 58
Scotland +15 95 £70,576 +5.20% 39
East of England -7 49 £57,500 +4.55% 59
Northern Ireland -13 33 £63,750 +24.39% 18
East Midlands +17 27 £54,000 -1.82% 24
Wales -12 23 £51,528 -7.84% 14
North East +24 6 £54,000 +43.56% 14
Channel Islands - 2 £47,000 -

Risk Management
Co-occurring Skills and Capabilities by Category

The follow tables expand on the table above by listing co-occurrences grouped by category. The same employment type, locality and period is covered with up to 20 co-occurrences shown in each of the following categories:

Application Platforms
1 36 (2.35%) SAS
2 19 (1.24%) Apache Spark
3 16 (1.04%) SharePoint
4 15 (0.98%) Apache
5 12 (0.78%) Anypoint
6 10 (0.65%) Confluence
6 10 (0.65%) IIS
7 6 (0.39%) Jupyter
8 4 (0.26%) Apache Airflow
9 3 (0.20%) MS Exchange
10 2 (0.13%) Alfresco
10 2 (0.13%) Captiva
10 2 (0.13%) CMS
10 2 (0.13%) Documentum
10 2 (0.13%) NServiceBus
11 1 (0.065%) Camunda
Applications
1 56 (3.65%) Microsoft Office
2 47 (3.06%) Microsoft Excel
3 21 (1.37%) Microsoft PowerPoint
4 19 (1.24%) Microsoft Project
5 12 (0.78%) MS Visio
6 6 (0.39%) OrCAD
7 3 (0.20%) Windchill
8 2 (0.13%) AutoCAD
9 1 (0.065%) Adobe Creative Suite
9 1 (0.065%) Sketch
9 1 (0.065%) Spreadsheet
9 1 (0.065%) Trello
Business Applications
1 8 (0.52%) Dynamics CRM
1 8 (0.52%) Primavera
2 6 (0.39%) BusinessWorks
3 4 (0.26%) Front Arena
4 3 (0.20%) Endur
5 2 (0.13%) ION Anvil
5 2 (0.13%) ION MarketView
5 2 (0.13%) Maximo
5 2 (0.13%) Oracle Payables
5 2 (0.13%) Oracle Procure-to-Pay
5 2 (0.13%) SAP GRC
6 1 (0.065%) IBM Planning Analytics
6 1 (0.065%) Payment Gateway
6 1 (0.065%) SAP ERP
6 1 (0.065%) SAP HR
6 1 (0.065%) SAP S/4HANA
6 1 (0.065%) SAP SCM
6 1 (0.065%) Summit
Cloud Services
1 172 (11.21%) Azure
2 104 (6.78%) AWS
3 75 (4.89%) SaaS
4 64 (4.17%) PaaS
5 61 (3.97%) GCP
6 53 (3.45%) Microsoft 365
7 48 (3.13%) IaaS
8 43 (2.80%) Power Platform
9 27 (1.76%) Entra ID
10 13 (0.85%) Cloud Computing
11 10 (0.65%) Datadog
12 9 (0.59%) Azure DevOps
12 9 (0.59%) Azure Sentinel
12 9 (0.59%) PowerApps
13 6 (0.39%) Collibra
13 6 (0.39%) Power Automate
13 6 (0.39%) Vertex AI
14 5 (0.33%) BrowserStack
14 5 (0.33%) Dynamics 365
14 5 (0.33%) WhatsApp
Communications & Networking
1 49 (3.19%) Firewall
2 21 (1.37%) Network Security
3 10 (0.65%) WAN
4 9 (0.59%) TCP/IP
4 9 (0.59%) VPN
5 8 (0.52%) LAN
6 7 (0.46%) Intrusion Detection
7 6 (0.39%) SD-WAN
7 6 (0.39%) Software-Defined Radio
8 5 (0.33%) ATM
8 5 (0.33%) Wi-Fi
8 5 (0.33%) Wireless
9 3 (0.20%) Broadband
9 3 (0.20%) Internet
9 3 (0.20%) MPLS
9 3 (0.20%) Unified Communications
9 3 (0.20%) Wireshark
10 2 (0.13%) 4G
10 2 (0.13%) PuTTY
10 2 (0.13%) Radio Access Network
Database & Business Intelligence
1 52 (3.39%) Data Warehouse
2 40 (2.61%) NoSQL
3 39 (2.54%) Power BI
4 37 (2.41%) Data Lake
5 32 (2.08%) SQL Server
6 15 (0.98%) Metadata
7 13 (0.85%) SQL Server Reporting Services
8 12 (0.78%) Tableau
9 10 (0.65%) Big Data
9 10 (0.65%) SQL Server Integration Services
10 9 (0.59%) Relational Database
11 7 (0.46%) Hadoop
12 6 (0.39%) Metadata Repository
13 5 (0.33%) MySQL
13 5 (0.33%) Oracle Database
13 5 (0.33%) SQL Server Analysis Services
14 4 (0.26%) Hazelcast
15 3 (0.20%) Azure SQL Database
15 3 (0.20%) KDB
15 3 (0.20%) Redis
Development Applications
1 45 (2.93%) JIRA
2 26 (1.69%) Git
3 12 (0.78%) Jenkins
4 11 (0.72%) Selenium
5 7 (0.46%) Maven
5 7 (0.46%) SpecFlow
5 7 (0.46%) Team Foundation Server
6 6 (0.39%) Rational DOORS
7 5 (0.33%) NUnit
7 5 (0.33%) Visual Studio
8 4 (0.26%) JUnit
8 4 (0.26%) Subversion
9 3 (0.20%) Oracle APEX
10 2 (0.13%) Apache Continuum
10 2 (0.13%) Burp Suite
10 2 (0.13%) Cucumber
10 2 (0.13%) GCC
10 2 (0.13%) GDB
10 2 (0.13%) SoapUI
10 2 (0.13%) WebDriver
General
1 656 (42.74%) Finance
2 523 (34.07%) Social Skills
3 261 (17.00%) Banking
4 251 (16.35%) Analytical Skills
5 182 (11.86%) Retail
6 171 (11.14%) Legal
7 93 (6.06%) Inclusion and Diversity
7 93 (6.06%) Influencing Skills
8 92 (5.99%) Public Sector
9 71 (4.63%) Marketing
10 55 (3.58%) Presentation Skills
11 54 (3.52%) Law
12 50 (3.26%) Front Office
13 37 (2.41%) Organisational Skills
14 32 (2.08%) Manufacturing
15 30 (1.95%) Telecoms
16 22 (1.43%) Retail Finance
17 20 (1.30%) Financial Institution
18 17 (1.11%) Back Office
18 17 (1.11%) Investment Banking
Job Titles
1 221 (14.40%) Analyst
2 169 (11.01%) Senior
3 167 (10.88%) Project Manager
4 141 (9.19%) Architect
5 122 (7.95%) Lead
6 106 (6.91%) IT Manager
6 106 (6.91%) Security Manager
7 78 (5.08%) Developer
8 73 (4.76%) Solutions Architect
9 69 (4.50%) Consultant
9 69 (4.50%) Security Analyst
10 63 (4.10%) Risk Manager
11 62 (4.04%) Risk Analyst
11 62 (4.04%) Site Controller
12 55 (3.58%) Senior Analyst
13 47 (3.06%) Information Analyst
13 47 (3.06%) IT Project Manager
14 45 (2.93%) Information Security Analyst
14 45 (2.93%) Senior Manager
15 42 (2.74%) Security Consultant
Libraries, Frameworks & Software Standards
1 64 (4.17%) ModSecurity
2 54 (3.52%) OpenID
3 23 (1.50%) OAuth
4 20 (1.30%) Kafka
5 19 (1.24%) REST
6 17 (1.11%) .NET
7 12 (0.78%) React
7 12 (0.78%) Spring
8 11 (0.72%) Middleware
8 11 (0.72%) Web Services
9 10 (0.65%) HTML
10 9 (0.59%) CSS
11 8 (0.52%) PyTorch
11 8 (0.52%) scikit-learn
11 8 (0.52%) TensorFlow
12 7 (0.46%) AngularJS
12 7 (0.46%) EDI
12 7 (0.46%) Keras
12 7 (0.46%) SailPoint
12 7 (0.46%) XML
Miscellaneous
1 288 (18.76%) Management Information System
2 69 (4.50%) Greenfield Project
3 64 (4.17%) Product Ownership
4 61 (3.97%) Self-Motivation
5 56 (3.65%) Credit Risk
6 44 (2.87%) Cloud Native
7 35 (2.28%) Blockchain
7 35 (2.28%) Mainframe
8 34 (2.21%) Foreign Exchange (FX)
9 29 (1.89%) Onboarding
9 29 (1.89%) Security Posture
9 29 (1.89%) Virtual Team
10 28 (1.82%) Algorithms
11 27 (1.76%) Cyber Threat
11 27 (1.76%) Derivative
12 25 (1.63%) Market Risk
13 24 (1.56%) Operational Technology
14 22 (1.43%) Data Structures
14 22 (1.43%) Fixed Income
15 20 (1.30%) Cyberattack
Operating Systems
1 54 (3.52%) Windows
2 48 (3.13%) Unix
3 36 (2.35%) Linux
4 20 (1.30%) Windows Server
5 9 (0.59%) Android
5 9 (0.59%) Ubuntu
6 8 (0.52%) Windows 10
6 8 (0.52%) Windows Server 2016
7 7 (0.46%) Windows Server 2012
8 6 (0.39%) AIX
8 6 (0.39%) Apple iOS
9 2 (0.13%) Kali Linux
10 1 (0.065%) Mac OS
10 1 (0.065%) Windows 7
10 1 (0.065%) Windows 8
10 1 (0.065%) Windows Server 2019
Processes & Methodologies
1 478 (31.14%) Agile
2 389 (25.34%) Information Security
3 353 (23.00%) Cybersecurity
4 240 (15.64%) Project Management
5 211 (13.75%) Stakeholder Management
6 191 (12.44%) Project Delivery
7 175 (11.40%) Roadmaps
8 169 (11.01%) Problem-Solving
9 143 (9.32%) ITIL
10 136 (8.86%) Continuous Improvement
11 134 (8.73%) Analytics
12 133 (8.66%) Security Management
13 127 (8.27%) Actionable Insight
13 127 (8.27%) Change Management
14 119 (7.75%) IT Strategy
15 115 (7.49%) Information Security Management
16 111 (7.23%) Business Continuity
16 111 (7.23%) ISMS
17 106 (6.91%) Validation
18 100 (6.51%) Coaching
Programming Languages
1 135 (8.79%) Python
2 98 (6.38%) SQL
3 56 (3.65%) Java
4 47 (3.06%) C#
5 44 (2.87%) PowerShell
5 44 (2.87%) R
6 38 (2.48%) C++
7 24 (1.56%) JavaScript
8 20 (1.30%) C
9 14 (0.91%) Bash
10 11 (0.72%) MATLAB
11 9 (0.59%) Search Processing Language
11 9 (0.59%) T-SQL
11 9 (0.59%) TypeScript
12 6 (0.39%) VBA
13 5 (0.33%) PL/SQL
14 4 (0.26%) Data Analysis Expressions
15 3 (0.20%) Kotlin
16 2 (0.13%) Scala
16 2 (0.13%) Shell Script
Qualifications
1 410 (26.71%) Degree
2 244 (15.90%) CISSP
3 220 (14.33%) Security Cleared
4 206 (13.42%) CISM
5 165 (10.75%) CRISC
6 126 (8.21%) CISA
7 77 (5.02%) SC Cleared
8 49 (3.19%) Computer Science Degree
8 49 (3.19%) Master's Degree
9 46 (3.00%) DV Cleared
10 36 (2.35%) CESG Certified Professional
11 30 (1.95%) CompTIA Security+
12 26 (1.69%) ISACA
13 25 (1.63%) PMI Certification
14 24 (1.56%) PMP
15 22 (1.43%) Cisco Certification
16 21 (1.37%) CISMP
17 20 (1.30%) (ISC)2 CCSP
18 18 (1.17%) CompTIA CySA+
19 16 (1.04%) PhD
Quality Assurance & Compliance
1 246 (16.03%) ISO/IEC 27001
2 211 (13.75%) NIST
3 193 (12.57%) GRC
4 89 (5.80%) QA
5 72 (4.69%) PMO
6 71 (4.63%) ISO 22301
7 65 (4.23%) Cyber Essentials
8 52 (3.39%) GDPR
9 47 (3.06%) PCI DSS
10 40 (2.61%) IFRS
11 37 (2.41%) NCSC
12 31 (2.02%) COBIT
12 31 (2.02%) Cyber Essentials PLUS
13 28 (1.82%) NIST 800
13 28 (1.82%) RMADS
14 26 (1.69%) IFRS 9
15 19 (1.24%) Data Quality
15 19 (1.24%) Sarbanes-Oxley
16 12 (0.78%) CRD IV
17 11 (0.72%) HMG Security Policy Framework
System Software
1 57 (3.71%) Active Directory
2 22 (1.43%) Docker
3 8 (0.52%) Hyper-V
4 5 (0.33%) VMware Infrastructure
5 4 (0.26%) Firmware
5 4 (0.26%) Virtual Machines
5 4 (0.26%) vSphere
6 3 (0.20%) Embedded Firmware
7 2 (0.13%) Citrix Hypervisor
7 2 (0.13%) HDFS
8 1 (0.065%) Apache ZooKeeper
8 1 (0.065%) Virtual Desktop
8 1 (0.065%) VMware NSX
Systems Management
1 26 (1.69%) Kubernetes
2 13 (0.85%) Terraform
3 11 (0.72%) Ansible
4 10 (0.65%) SCOM
5 7 (0.46%) Microsoft Intune
5 7 (0.46%) SCCM
5 7 (0.46%) Single Sign-On
6 6 (0.39%) Nessus
7 5 (0.33%) HP ALM
8 4 (0.26%) Active Directory Federation Services
9 2 (0.13%) Cisco CUCM
9 2 (0.13%) Progress Chef
9 2 (0.13%) Puppet
10 1 (0.065%) CASB
10 1 (0.065%) Functional Safety
10 1 (0.065%) Jamf Pro
10 1 (0.065%) PingFederate
10 1 (0.065%) RSA Archer
10 1 (0.065%) WSUS
Vendors
1 144 (9.38%) Microsoft
2 68 (4.43%) CA
3 37 (2.41%) ServiceNow
4 25 (1.63%) Oracle
4 25 (1.63%) SAP
5 20 (1.30%) VMware
6 17 (1.11%) Salesforce
7 16 (1.04%) BMC
8 14 (0.91%) MuleSoft
9 13 (0.85%) Cisco
10 12 (0.78%) IBM
11 10 (0.65%) Citrix
11 10 (0.65%) New Relic
11 10 (0.65%) Splunk
12 9 (0.59%) AppDynamics
12 9 (0.59%) Cadence
12 9 (0.59%) Confluent
13 7 (0.46%) Google
13 7 (0.46%) NEC
14 6 (0.39%) Alteryx