Post-Production
UK
The table below provides summary statistics and contractor rates for jobs requiring Post-Production skills. It covers contract job vacancies from the 6 months leading up to 12 February 2026, with comparisons to the same periods in the previous two years.
| 6 months to 12 Feb 2026 |
Same period 2025 | Same period 2024 | |
|---|---|---|---|
| Rank | 573 | 508 | 595 |
| Rank change year-on-year | -65 | +87 | +125 |
| Contract jobs citing Post-Production | 16 | 19 | 11 |
| As % of all contract jobs in the UK | 0.040% | 0.061% | 0.025% |
| As % of the Processes & Methodologies category | 0.046% | 0.069% | 0.029% |
| Number of daily rates quoted | 12 | 8 | 4 |
| 10th Percentile | £313 | £217 | £215 |
| 25th Percentile | £315 | £249 | £218 |
| Median daily rate (50th Percentile) | £413 | £325 | £313 |
| Median % change year-on-year | +26.92% | +4.00% | -35.06% |
| 75th Percentile | £656 | £394 | £434 |
| 90th Percentile | £915 | £559 | £496 |
| UK excluding London median daily rate | - | £244 | £400 |
| % change year-on-year | - | -39.00% | -13.51% |
| Number of hourly rates quoted | 0 | 1 | 0 |
| Median hourly rate | - | £26.50 | - |
| UK excluding London median hourly rate | - | £26.50 | - |
All Process & Methodology Skills
UK
Post-Production falls under the Processes and Methodologies category. For comparison with the information above, the following table provides summary statistics for all contract job vacancies requiring process or methodology skills.
| Contract vacancies with a requirement for process or methodology skills | 34,652 | 27,713 | 38,573 |
| As % of all contract IT jobs advertised in the UK | 87.01% | 89.46% | 87.07% |
| Number of daily rates quoted | 21,939 | 16,970 | 25,283 |
| 10th Percentile | £306 | £306 | £300 |
| 25th Percentile | £408 | £413 | £413 |
| Median daily rate (50th Percentile) | £500 | £525 | £525 |
| Median % change year-on-year | -4.76% | - | -4.55% |
| 75th Percentile | £613 | £638 | £638 |
| 90th Percentile | £720 | £738 | £738 |
| UK excluding London median daily rate | £478 | £498 | £500 |
| % change year-on-year | -4.06% | -0.35% | - |
| Number of hourly rates quoted | 2,087 | 853 | 2,111 |
| 10th Percentile | £14.50 | £15.62 | £13.28 |
| 25th Percentile | £17.69 | £21.05 | £16.25 |
| Median hourly rate | £25.15 | £32.50 | £33.07 |
| Median % change year-on-year | -22.62% | -1.71% | +1.74% |
| 75th Percentile | £60.00 | £63.75 | £60.00 |
| 90th Percentile | £70.00 | £75.00 | £72.90 |
| UK excluding London median hourly rate | £25.15 | £31.51 | £35.00 |
| % change year-on-year | -20.18% | -9.97% | +9.38% |
Post-Production
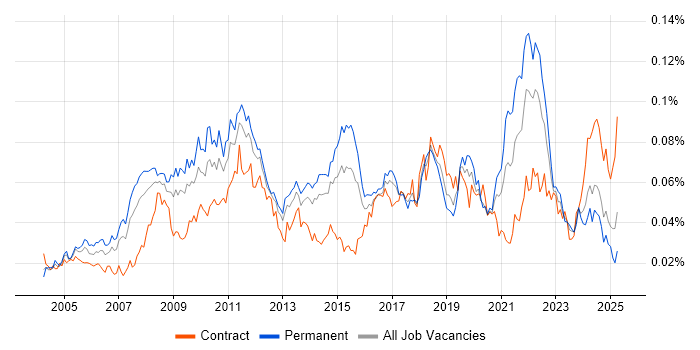
Job Vacancy Trend
Historical trend showing the proportion of contract IT job postings citing Post-Production relative to all contract IT jobs advertised.

Post-Production
Daily Rate Trend
Contractor daily rate distribution trend for jobs in the UK citing Post-Production.

Post-Production
Daily Rate Histogram
Daily rate distribution for jobs citing Post-Production over the 6 months to 12 February 2026.
Post-Production
Hourly Rate Trend
Contractor hourly rate distribution trend for jobs in the UK citing Post-Production.

Post-Production
Top 3 Contract Job Locations
The table below looks at the demand and provides a guide to the median contractor rates quoted in IT jobs citing Post-Production within the UK over the 6 months to 12 February 2026. The 'Rank Change' column provides an indication of the change in demand within each location based on the same 6 month period last year.
| Location | Rank Change on Same Period Last Year |
Matching Contract IT Job Ads |
Median Daily Rate Past 6 Months |
Median Daily Rate % Change on Same Period Last Year |
Live Jobs |
|---|---|---|---|---|---|
| London | -39 | 13 | £435 | +33.85% | 3 |
| England | -81 | 13 | £435 | +33.85% | 7 |
| Work from Home | -5 | 8 | £335 | -56.77% | 3 |
Post-Production
Co-Occurring Skills & Capabilities by Category
The following tables expand on the one above by listing co-occurrences grouped by category. They cover the same employment type, locality and period, with up to 20 co-occurrences shown in each category:
