Asset Management Contracts with Work from Home Options

Asset Management
UK > Work from Home

The table below provides summary statistics for remote or hybrid contract work requiring Asset Management skills. It includes a benchmarking guide to the contractor rates offered in vacancies that cited Asset Management over the 6 months leading up to 24 June 2024, comparing them to the same period in the previous two years.

6 months to
24 Jun 2024
Same period 2023 Same period 2022
Rank 69 138 219
Rank change year-on-year +69 +81 -105
Contract jobs citing Asset Management 429 418 563
As % of all contract jobs with a WFH option 2.91% 1.75% 1.28%
As % of the Processes & Methodologies category 3.33% 1.95% 1.41%
Number of daily rates quoted 373 324 430
10th Percentile £500 £400 £350
25th Percentile £563 £475 £438
Median daily rate (50th Percentile) £750 £600 £500
Median % change year-on-year +25.00% +20.00% -4.76%
75th Percentile £850 £739 £675
90th Percentile £888 £798 £788
UK median daily rate £625 £550 £575
% change year-on-year +13.64% -4.35% +9.52%
Number of hourly rates quoted 5 12 8
10th Percentile £13.56 £16.04 £36.30
25th Percentile £14.41 £21.13 £58.75
Median hourly rate £18.13 £29.11 £75.00
Median % change year-on-year -37.72% -61.19% +408.47%
75th Percentile £35.00 £59.63 £84.63
90th Percentile - £69.60 £85.00
UK median hourly rate £18.13 £21.49 £20.00
% change year-on-year -15.62% +7.43% +35.59%

All Process and Methodology Skills
Work from Home

Asset Management falls under the Processes and Methodologies category. For comparison with the information above, the following table provides summary statistics for all contract job vacancies with remote or hybrid options requiring process or methodology skills.

Contract vacancies with a requirement for process or methodology skills 12,871 21,399 39,942
As % of all contract jobs with a WFH option 87.23% 89.63% 91.07%
Number of daily rates quoted 8,673 15,206 29,099
10th Percentile £325 £363 £363
25th Percentile £425 £450 £438
Median daily rate (50th Percentile) £525 £540 £525
Median % change year-on-year -2.78% +2.86% +5.42%
75th Percentile £638 £650 £638
90th Percentile £750 £750 £738
UK median daily rate £525 £550 £538
% change year-on-year -4.55% +2.33% +7.50%
Number of hourly rates quoted 572 495 518
10th Percentile £15.02 £18.49 £14.96
25th Percentile £24.00 £25.75 £20.75
Median hourly rate £43.00 £52.13 £40.00
Median % change year-on-year -17.51% +30.33% +66.67%
75th Percentile £60.00 £67.50 £60.00
90th Percentile £74.95 £78.45 £72.50
UK median hourly rate £37.00 £35.65 £26.00
% change year-on-year +3.79% +37.12% +13.04%

Asset Management
Trend for Jobs with a WFH Option

Job vacancies with a work from home option citing Asset Management as a proportion of all IT jobs advertised.
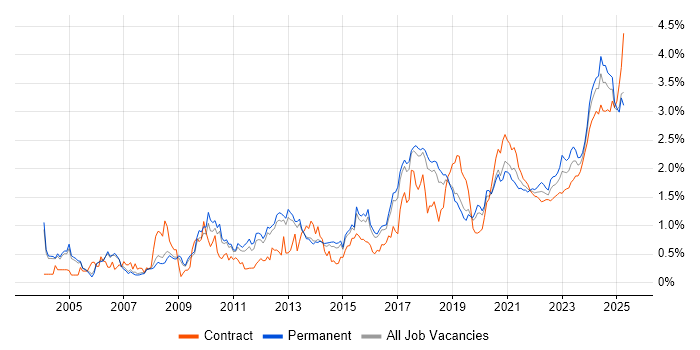
Asset Management trend for jobs with a WFH option

Asset Management
Daily Rate Trend for Jobs with a WFH Option

3-month moving average daily rate quoted in job vacancies with a work from home option citing Asset Management.

Asset Management daily rate for jobs with a WFH option

Asset Management
Daily Rate Histogram for Jobs with a WFH Option

Daily rate distribution for jobs with a work from home option citing Asset Management over the 6 months to 24 June 2024.

Asset Management daily rate histogram for jobs with a WFH option

Asset Management
Hourly Rate Trend for Jobs with a WFH Option

3-month moving average hourly rate quoted in job vacancies with a work from home option citing Asset Management.

Asset Management hourly rate for jobs with a WFH option

Asset Management
Hourly Rate Histogram for Jobs with a WFH Option

Hourly rate distribution for jobs with a work from home option citing Asset Management over the 6 months to 24 June 2024.

Asset Management hourly rate histogram for jobs with a WFH option

Asset Management
Co-occurring Skills and Capabilities with WFH Options by Category

The follow tables expand on the table above by listing co-occurrences grouped by category. The same employment type, locality and period is covered with up to 20 co-occurrences shown in each of the following categories:

Application Platforms
1 169 (39.39%) Apache Airflow
2 146 (34.03%) Apache
3 3 (0.70%) CMS
3 3 (0.70%) Confluence
4 2 (0.47%) ArcGIS
4 2 (0.47%) SharePoint
5 1 (0.23%) Headless CMS
5 1 (0.23%) Microsoft Exchange
5 1 (0.23%) Moodle
Applications
1 6 (1.40%) Microsoft Office
2 4 (0.93%) Microsoft Excel
3 2 (0.47%) Microsoft PowerPoint
4 1 (0.23%) 3ds Max
4 1 (0.23%) Blender
4 1 (0.23%) Spreadsheet
Business Applications
1 9 (2.10%) SimCorp Dimension
2 5 (1.17%) Maximo
3 4 (0.93%) Aladdin
3 4 (0.93%) SAP S/4HANA
4 3 (0.70%) Orchestrade
5 2 (0.47%) SAP FI
5 2 (0.47%) SAP IS-U
5 2 (0.47%) Shopify
6 1 (0.23%) Markit EDM
6 1 (0.23%) Oracle EBS
6 1 (0.23%) Remedy ITSM
6 1 (0.23%) Sparx Enterprise Architect
Cloud Services
1 214 (49.88%) AWS
2 166 (38.69%) dbt
3 135 (31.47%) Snowflake
4 107 (24.94%) GCP
5 50 (11.66%) Azure
6 28 (6.53%) Power Platform
7 8 (1.86%) Amazon EC2
7 8 (1.86%) Amazon ECS
7 8 (1.86%) Amazon EKS
8 5 (1.17%) Azure Service Bus
9 4 (0.93%) Azure DevOps
9 4 (0.93%) Collibra
9 4 (0.93%) Dagster
10 3 (0.70%) Dynamics 365
10 3 (0.70%) IaaS
10 3 (0.70%) SaaS
11 2 (0.47%) BigCommerce
11 2 (0.47%) GitHub
11 2 (0.47%) Microsoft 365
11 2 (0.47%) SAP Commerce Cloud
Communications & Networking
1 4 (0.93%) Network Security
2 2 (0.47%) BGP
2 2 (0.47%) Cisco ASA
2 2 (0.47%) Cisco Nexus
2 2 (0.47%) DHCP
2 2 (0.47%) DNS
2 2 (0.47%) HTTP
2 2 (0.47%) Internet
2 2 (0.47%) OSPF
2 2 (0.47%) SNMP
2 2 (0.47%) TCP/IP
3 1 (0.23%) 4G
3 1 (0.23%) 5G
3 1 (0.23%) LAN
3 1 (0.23%) MPLS
3 1 (0.23%) SD-WAN
3 1 (0.23%) Structured Cabling
3 1 (0.23%) VoIP
3 1 (0.23%) WAN
3 1 (0.23%) Wireless
Database & Business Intelligence
1 161 (37.53%) Dremio
2 157 (36.60%) Apache Arrow
3 153 (35.66%) Amazon Athena
4 142 (33.10%) Data Lake
5 138 (32.17%) Apache Ignite
6 28 (6.53%) Power BI
7 26 (6.06%) Big Data
8 14 (3.26%) Tableau
9 7 (1.63%) Data Warehouse
9 7 (1.63%) SQL Server
10 6 (1.40%) Metadata
11 2 (0.47%) BusinessObjects
11 2 (0.47%) PostgreSQL
12 1 (0.23%) Azure SQL Database
12 1 (0.23%) Data Mining
12 1 (0.23%) GIS
12 1 (0.23%) NoSQL
12 1 (0.23%) Oracle Database
12 1 (0.23%) Relational Database
12 1 (0.23%) Star Schema
Development Applications
1 10 (2.33%) JIRA
2 3 (0.70%) Git
3 2 (0.47%) ERwin
4 1 (0.23%) GitLab
4 1 (0.23%) PowerDesigner
4 1 (0.23%) Selenium
General
1 298 (69.46%) Finance
2 222 (51.75%) Front Office
3 166 (38.69%) Banking
4 130 (30.30%) Investment Banking
5 47 (10.96%) Social Skills
6 29 (6.76%) Back Office
7 27 (6.29%) Analytical Skills
8 17 (3.96%) Public Sector
9 6 (1.40%) Law
9 6 (1.40%) Legal
9 6 (1.40%) Marketing
9 6 (1.40%) Presentation Skills
10 4 (0.93%) Retail
11 3 (0.70%) Documentation Skills
12 2 (0.47%) General Ledger
12 2 (0.47%) Inclusion and Diversity
12 2 (0.47%) Local Government
12 2 (0.47%) Publishing
13 1 (0.23%) Billing
13 1 (0.23%) Military
Job Titles
1 114 (26.57%) Developer
2 113 (26.34%) Software Engineer
3 86 (20.05%) Senior
4 75 (17.48%) AWS Engineer
5 71 (16.55%) Python Engineer
6 70 (16.32%) Analyst
7 69 (16.08%) Developer/Software Engineer
8 64 (14.92%) Python Software Engineer
9 56 (13.05%) AWS Software Engineer
9 56 (13.05%) Lead
10 51 (11.89%) Senior Software Engineer
11 48 (11.19%) Java Engineer
11 48 (11.19%) Java Software Engineer
12 45 (10.49%) Python Developer
13 42 (9.79%) Software Developer
14 40 (9.32%) Business Analyst
15 37 (8.62%) Team Leader
16 36 (8.39%) Lead Developer
16 36 (8.39%) Lead Software Developer
16 36 (8.39%) Lead Software Engineer
Libraries, Frameworks & Software Standards
1 166 (38.69%) gRPC
2 165 (38.46%) Protocol Buffers
3 139 (32.40%) Pandas
4 132 (30.77%) NumPy
4 132 (30.77%) SciPy
5 39 (9.09%) React
6 28 (6.53%) Redux
7 27 (6.29%) Node.js
8 23 (5.36%) Web Services
9 17 (3.96%) AngularJS
10 16 (3.73%) Vue
11 11 (2.56%) Material-UI
12 10 (2.33%) .NET
12 10 (2.33%) PySpark
13 7 (1.63%) CSS
13 7 (1.63%) HTML
14 6 (1.40%) GraphQL
15 4 (0.93%) ASP.NET
15 4 (0.93%) ASP.NET Core
16 3 (0.70%) ADO
Miscellaneous
1 201 (46.85%) Hedge funds
2 188 (43.82%) Fixed Income
3 184 (42.89%) Derivative
4 163 (38.00%) Equities
5 147 (34.27%) Foreign Exchange (FX)
6 28 (6.53%) Product Ownership
7 21 (4.90%) Management Information System
8 20 (4.66%) Clustering
9 16 (3.73%) Pricing Data
10 14 (3.26%) CMDB
11 6 (1.40%) Virtual Team
12 5 (1.17%) Legacy Applications
13 4 (0.93%) Data Centre
13 4 (0.93%) Greenfield Project
14 3 (0.70%) Algorithms
14 3 (0.70%) Cloud Native
14 3 (0.70%) DTCC
15 2 (0.47%) Legacy Systems
15 2 (0.47%) Mobile App
15 2 (0.47%) Team-Oriented Environment
Operating Systems
1 10 (2.33%) Windows
2 4 (0.93%) Linux
2 4 (0.93%) Windows 10
3 1 (0.23%) Mac OS
3 1 (0.23%) Unix
3 1 (0.23%) Windows Server
Processes & Methodologies
1 232 (54.08%) Investment Management
2 217 (50.58%) Agile
3 168 (39.16%) Software Engineering
4 56 (13.05%) Analytics
5 53 (12.35%) Line Management
6 45 (10.49%) Service Management
7 43 (10.02%) Greeks
8 39 (9.09%) Mentoring
9 37 (8.62%) ITSM
10 35 (8.16%) IT Asset Management
10 35 (8.16%) Migration
11 34 (7.93%) Problem-Solving
12 31 (7.23%) DevOps
12 31 (7.23%) ITIL
13 30 (6.99%) Performance Attribution
14 29 (6.76%) Fintech
15 25 (5.83%) Service Delivery
16 22 (5.13%) Product Management
16 22 (5.13%) User Stories
17 21 (4.90%) Operations Management
Programming Languages
1 250 (58.28%) Python
2 177 (41.26%) JavaScript
3 154 (35.90%) TypeScript
4 148 (34.50%) Java
5 77 (17.95%) SQL
6 34 (7.93%) C#
7 19 (4.43%) Go
8 10 (2.33%) R
9 6 (1.40%) Ruby
9 6 (1.40%) Scala
10 5 (1.17%) Kotlin
10 5 (1.17%) PowerShell
11 3 (0.70%) Data Analysis Expressions
12 2 (0.47%) ABAP
13 1 (0.23%) Shell Script
13 1 (0.23%) XPath
Qualifications
1 31 (7.23%) Security Cleared
2 30 (6.99%) SC Cleared
3 12 (2.80%) Degree
4 4 (0.93%) Computer Science Degree
5 2 (0.47%) ACCA
5 2 (0.47%) BPSS Clearance
5 2 (0.47%) CCDP
5 2 (0.47%) CCNP
5 2 (0.47%) CIMA
5 2 (0.47%) CIPFA
5 2 (0.47%) Cisco Certification
5 2 (0.47%) ICAEW
5 2 (0.47%) ITIL Certification
6 1 (0.23%) Master's Degree
6 1 (0.23%) MRICS
Quality Assurance & Compliance
1 55 (12.82%) Data Quality
2 6 (1.40%) QA
3 5 (1.17%) GDPR
3 5 (1.17%) ISO/IEC 27001
4 3 (0.70%) Accessibility
4 3 (0.70%) Cyber Essentials
4 3 (0.70%) SLA
5 2 (0.47%) Sarbanes-Oxley
6 1 (0.23%) Def Stans
6 1 (0.23%) GRC
6 1 (0.23%) ISO 14001
6 1 (0.23%) ISO 9001
6 1 (0.23%) NEBOSH
System Software
1 4 (0.93%) Virtual Desktop
2 2 (0.47%) VMware Infrastructure
3 1 (0.23%) Active Directory
3 1 (0.23%) Docker
3 1 (0.23%) VMware ESXi
3 1 (0.23%) vSphere
Systems Management
1 23 (5.36%) Kubernetes
2 22 (5.13%) Terraform
3 21 (4.90%) Prometheus
4 4 (0.93%) Ansible
4 4 (0.93%) Jamf Pro
5 3 (0.70%) Grafana
5 3 (0.70%) SCCM
6 1 (0.23%) Dell DRAC
6 1 (0.23%) Progress Chef
6 1 (0.23%) Puppet
6 1 (0.23%) SCOM
Vendors
1 31 (7.23%) ServiceNow
2 23 (5.36%) Microsoft
3 20 (4.66%) Bloomberg
4 10 (2.33%) SimCorp
5 8 (1.86%) Reuters
5 8 (1.86%) SAP
6 6 (1.40%) Alteryx
7 5 (1.17%) Databricks
7 5 (1.17%) Oracle
8 4 (0.93%) Nexthink
8 4 (0.93%) Snow
9 3 (0.70%) Adobe
9 3 (0.70%) Charles River
9 3 (0.70%) VMware
10 2 (0.47%) CheckPoint
10 2 (0.47%) Cisco
10 2 (0.47%) Citrix
10 2 (0.47%) NEC
10 2 (0.47%) Salesforce
10 2 (0.47%) Sophos