Terraform Jobs in the City of London

Terraform
Central London > City of London

The table below provides summary statistics for permanent job vacancies advertised in the City of London requiring Terraform skills. It includes a benchmarking guide to the annual salaries offered in vacancies that cited Terraform over the 6 months leading up to 24 August 2025, comparing them to the same period in the previous two years.

6 months to
24 Aug 2025
Same period 2024 Same period 2023
Rank 50 32 26
Rank change year-on-year -18 -6 +13
DemandTrendPermanent jobs citing Terraform 99 205 338
As % of all permanent jobs advertised in the City of London 5.39% 6.89% 8.60%
As % of the Systems Management category 39.29% 38.83% 43.28%
Number of salaries quoted 67 177 290
10th Percentile £64,500 - £53,750
25th Percentile £72,500 £65,000 £60,200
Median annual salary (50th Percentile) £80,000 £85,000 £80,000
Median % change year-on-year -5.88% +6.25% -5.88%
75th Percentile £96,250 £105,000 £95,000
90th Percentile £115,000 £112,500 £110,000
Central London median annual salary £80,000 £85,000 £80,000
% change year-on-year -5.88% +6.25% -5.88%

All Systems Management Skills
City of London

Terraform falls under the Systems Management category. For comparison with the information above, the following table provides summary statistics for all permanent job vacancies requiring systems management skills in the City of London.

DemandTrendPermanent vacancies with a requirement for systems management skills 252 528 781
As % of all permanent jobs advertised in the City of London 13.73% 17.75% 19.88%
Number of salaries quoted 192 407 649
10th Percentile £40,000 £48,000 £42,500
25th Percentile £52,500 £62,500 £56,250
Median annual salary (50th Percentile) £75,000 £80,000 £75,000
Median % change year-on-year -6.25% +6.67% -9.09%
75th Percentile £90,000 £97,500 £95,000
90th Percentile £115,000 £112,500 £110,250
Central London median annual salary £75,000 £80,000 £75,000
% change year-on-year -6.25% +6.67% -6.25%

Terraform
Job Vacancy Trend in the City of London

Job postings citing Terraform as a proportion of all IT jobs advertised in the City of London.
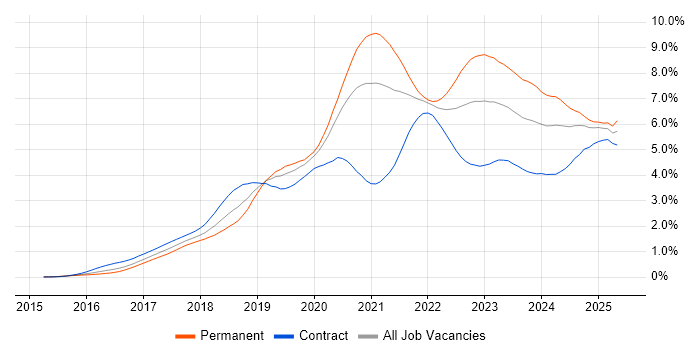
Job vacancy trend for Terraform in the City of London

Terraform
Salary Trend in the City of London

Salary distribution trend for jobs in the City of London citing Terraform.

Salary distribution trend for jobs in the City of London citing Terraform

Terraform
Salary Histogram in the City of London

Salary distribution for jobs citing Terraform in the City of London over the 6 months to 24 August 2025.

Salary histogram for Terraform in the City of London

Terraform
Job Locations in the City of London

The table below looks at the demand and provides a guide to the median salaries quoted in IT jobs citing Terraform within the City of London region over the 6 months to 24 August 2025. The 'Rank Change' column provides an indication of the change in demand within each location based on the same 6 month period last year.

Location Rank Change
on Same Period
Last Year
Matching
DemandTrendPermanent
IT Job Ads
Median Salary
Past 6 Months
Median Salary
% Change
on Same Period
Last Year
Live
Jobs
London Bridge 0 9 £102,000 +33.77%
Terraform
Central London

Terraform
Co-occurring Skills and Capabilities in the City of London by Category

The follow tables expand on the table above by listing co-occurrences grouped by category. The same employment type, locality and period is covered with up to 20 co-occurrences shown in each of the following categories:

Application Platforms
1 2 (2.02%) Apache Airflow
1 2 (2.02%) Apache Spark
1 2 (2.02%) Microsoft Exchange
2 1 (1.01%) IIS
2 1 (1.01%) SharePoint
Business Applications
1 1 (1.01%) Elite 3E
Cloud Services
1 64 (64.65%) AWS
2 63 (63.64%) Azure
3 25 (25.25%) AWS CloudFormation
3 25 (25.25%) GCP
4 21 (21.21%) GitHub
5 17 (17.17%) Azure DevOps
6 13 (13.13%) GitHub Actions
6 13 (13.13%) Pulumi
7 11 (11.11%) Amazon EKS
8 9 (9.09%) Snowflake
9 8 (8.08%) Azure Monitor
9 8 (8.08%) Serverless
10 7 (7.07%) Entra ID
11 6 (6.06%) PaaS
12 5 (5.05%) Amazon S3
12 5 (5.05%) Microsoft 365
12 5 (5.05%) SaaS
13 4 (4.04%) AWS Lambda
13 4 (4.04%) Azure Data Factory
13 4 (4.04%) Azure Synapse Analytics
Communications & Networking
1 5 (5.05%) Kerberos
1 5 (5.05%) Network Security
2 4 (4.04%) VPN
3 2 (2.02%) Broadband
3 2 (2.02%) DNS
3 2 (2.02%) LAN
3 2 (2.02%) WAN
4 1 (1.01%) DHCP
4 1 (1.01%) IPsec
4 1 (1.01%) SAN
Database & Business Intelligence
1 8 (8.08%) Data Warehouse
2 5 (5.05%) Data Vault
2 5 (5.05%) Semantic Layer
3 4 (4.04%) Amazon RDS
4 3 (3.03%) Elasticsearch
4 3 (3.03%) NoSQL
4 3 (3.03%) SQL Server
5 2 (2.02%) Amazon Redshift
5 2 (2.02%) DynamoDB
5 2 (2.02%) Metadata
5 2 (2.02%) RDBMS
5 2 (2.02%) Relational Database
6 1 (1.01%) Azure SQL Database
6 1 (1.01%) Delta Lake
6 1 (1.01%) Hadoop
6 1 (1.01%) MongoDB
6 1 (1.01%) MySQL
6 1 (1.01%) PostgreSQL
6 1 (1.01%) Power BI
6 1 (1.01%) Spark SQL
Development Applications
1 17 (17.17%) Git
2 7 (7.07%) Jenkins
3 6 (6.06%) Bitbucket
4 5 (5.05%) GitLab
5 2 (2.02%) CircleCI
5 2 (2.02%) Jaeger
5 2 (2.02%) MLflow
5 2 (2.02%) Visual Studio Code
6 1 (1.01%) JIRA
6 1 (1.01%) TeamCity
6 1 (1.01%) Vagrant
General
1 31 (31.31%) Finance
2 29 (29.29%) Social Skills
3 8 (8.08%) Law
4 6 (6.06%) Inclusion and Diversity
5 5 (5.05%) Analytical Skills
6 3 (3.03%) Banking
6 3 (3.03%) Financial Institution
6 3 (3.03%) Public Sector
7 2 (2.02%) Advertising
7 2 (2.02%) Front Office
7 2 (2.02%) Legal
7 2 (2.02%) Retail
Job Titles
1 30 (30.30%) Senior
2 19 (19.19%) Lead
3 18 (18.18%) DevOps Engineer
4 14 (14.14%) Cloud Engineer
5 12 (12.12%) Platform Engineer
6 11 (11.11%) Azure Engineer
7 10 (10.10%) Data Engineer
7 10 (10.10%) Developer
8 8 (8.08%) Infrastructure Engineer
8 8 (8.08%) Lead Data Engineer
9 7 (7.07%) Senior Cloud Engineer
9 7 (7.07%) Site Reliability Engineer
9 7 (7.07%) Software Engineer
10 6 (6.06%) Senior DevOps
10 6 (6.06%) Senior DevOps Engineer
11 5 (5.05%) Identity and Access Management Engineer
11 5 (5.05%) Identity Management Engineer
11 5 (5.05%) Senior Developer
11 5 (5.05%) Senior Software Engineer
12 4 (4.04%) Architect
Libraries, Frameworks & Software Standards
1 9 (9.09%) Loki
2 8 (8.08%) ARM Templates
3 6 (6.06%) Node.js
4 5 (5.05%) .NET
4 5 (5.05%) LDAP
4 5 (5.05%) OAuth
4 5 (5.05%) OpenID
4 5 (5.05%) SailPoint
4 5 (5.05%) SAML
5 4 (4.04%) AWS CDK
5 4 (4.04%) CSS
5 4 (4.04%) HTML
5 4 (4.04%) Pandas
6 3 (3.03%) Elastic Stack
6 3 (3.03%) FastAPI
6 3 (3.03%) React
6 3 (3.03%) REST
6 3 (3.03%) Spring
6 3 (3.03%) Spring Boot
7 2 (2.02%) Kafka
Miscellaneous
1 11 (11.11%) Cloud Native
2 9 (9.09%) Onboarding
3 6 (6.06%) Public Cloud
4 5 (5.05%) PKI
5 3 (3.03%) Cyber Threat
5 3 (3.03%) Cyberattack
5 3 (3.03%) Reinsurance
6 2 (2.02%) Legacy Systems
6 2 (2.02%) Private Cloud
7 1 (1.01%) Clustering
7 1 (1.01%) CMDB
7 1 (1.01%) Data Centre
7 1 (1.01%) Data Structures
7 1 (1.01%) Linux Command Line
7 1 (1.01%) Management Information System
7 1 (1.01%) Product Ownership
7 1 (1.01%) Security Posture
Operating Systems
1 20 (20.20%) Linux
2 13 (13.13%) Windows
3 11 (11.11%) Windows Server
4 6 (6.06%) Red Hat Enterprise Linux
5 4 (4.04%) Unix
6 3 (3.03%) Android
7 2 (2.02%) CentOS
8 1 (1.01%) Amazon Linux
8 1 (1.01%) VMS
8 1 (1.01%) Windows Server 2016
8 1 (1.01%) Windows Server 2019
Processes & Methodologies
1 67 (67.68%) Infrastructure as Code
2 63 (63.64%) DevOps
3 56 (56.57%) CI/CD
4 34 (34.34%) Agile
5 32 (32.32%) Containerisation
6 22 (22.22%) Mentoring
7 21 (21.21%) Problem-Solving
8 20 (20.20%) Roadmaps
9 19 (19.19%) Platform Engineering
10 17 (17.17%) Analytics
11 16 (16.16%) Software Engineering
11 16 (16.16%) Stakeholder Management
12 14 (14.14%) Observability
13 13 (13.13%) Artificial Intelligence
14 12 (12.12%) Continuous Deployment
14 12 (12.12%) Continuous Integration
15 11 (11.11%) Data Science
15 11 (11.11%) Root Cause Analysis
16 10 (10.10%) High Availability
16 10 (10.10%) Identity Access Management
Programming Languages
1 48 (48.48%) Python
2 23 (23.23%) Java
3 17 (17.17%) Bash
3 17 (17.17%) Go
3 17 (17.17%) PowerShell
4 11 (11.11%) SQL
5 10 (10.10%) JavaScript
6 9 (9.09%) Scala
6 9 (9.09%) TypeScript
7 4 (4.04%) Bicep
8 3 (3.03%) C++
8 3 (3.03%) Rust
9 2 (2.02%) C#
9 2 (2.02%) PHP
10 1 (1.01%) Apex Code
10 1 (1.01%) Kotlin
10 1 (1.01%) SOQL
Qualifications
1 8 (8.08%) Computer Science Degree
1 8 (8.08%) Degree
1 8 (8.08%) Master's Degree
2 6 (6.06%) Azure Certification
2 6 (6.06%) Microsoft Certification
2 6 (6.06%) Security Cleared
3 5 (5.05%) CISM
3 5 (5.05%) CISSP
3 5 (5.05%) DV Cleared
4 4 (4.04%) AWS Certification
5 1 (1.01%) SC Cleared
5 1 (1.01%) SnowPro
Quality Assurance & Compliance
1 3 (3.03%) GDPR
2 1 (1.01%) Data Quality
2 1 (1.01%) HIPAA
2 1 (1.01%) QA
System Software
1 28 (28.28%) Docker
2 12 (12.12%) Active Directory
3 8 (8.08%) VMware Infrastructure
4 1 (1.01%) Hyper-V
4 1 (1.01%) Terminal Server
4 1 (1.01%) Virtual Desktop
4 1 (1.01%) VMware ESXi
Systems Management
1 46 (46.46%) Kubernetes
2 34 (34.34%) Ansible
3 11 (11.11%) Grafana
4 5 (5.05%) QRadar
4 5 (5.05%) Single Sign-On
5 4 (4.04%) Argo
5 4 (4.04%) Prometheus
6 3 (3.03%) Microsoft Intune
6 3 (3.03%) Progress Chef
6 3 (3.03%) SCOM
7 2 (2.02%) Kustomize
8 1 (1.01%) Consul
8 1 (1.01%) Kubeflow
8 1 (1.01%) NetBackup
8 1 (1.01%) Packer
8 1 (1.01%) Puppet
8 1 (1.01%) Salt
Vendors
1 19 (19.19%) Microsoft
2 14 (14.14%) Google
3 12 (12.12%) VMware
4 8 (8.08%) Cisco
4 8 (8.08%) Databricks
4 8 (8.08%) Hitachi
4 8 (8.08%) SolarWinds
5 5 (5.05%) Commvault
5 5 (5.05%) Red Hat
5 5 (5.05%) Splunk
6 3 (3.03%) Citrix
6 3 (3.03%) Pure Storage
7 2 (2.02%) HP
7 2 (2.02%) Nimble Storage
8 1 (1.01%) EMC
8 1 (1.01%) Informatica
8 1 (1.01%) Intapp
8 1 (1.01%) NetApp
8 1 (1.01%) Salesforce
8 1 (1.01%) Talend