Computer Science Jobs in the Midlands

Computer Science
England > Midlands

The table below provides summary statistics for permanent job vacancies advertised in the Midlands requiring Computer Science skills. It includes a benchmarking guide to the annual salaries offered in vacancies that cited Computer Science over the 6 months leading up to 20 July 2025, comparing them to the same period in the previous two years.

6 months to
20 Jul 2025
Same period 2024 Same period 2023
Rank 69 66 78
Rank change year-on-year -3 +12 -14
Permanent jobs citing Computer Science 263 441 305
As % of all permanent jobs advertised in the Midlands 3.80% 3.48% 3.90%
As % of the Processes & Methodologies category 4.35% 4.39% 4.07%
Number of salaries quoted 147 278 193
10th Percentile £28,400 £27,675 £30,500
25th Percentile £32,500 £32,500 £42,500
Median annual salary (50th Percentile) £45,000 £45,500 £60,000
Median % change year-on-year -1.10% -24.17% +22.45%
75th Percentile £65,000 £60,000 £70,000
90th Percentile £71,250 £78,750 £75,000
England median annual salary £60,000 £60,000 £65,000
% change year-on-year - -7.69% +8.33%

All Process and Methodology Skills
Midlands

Computer Science falls under the Processes and Methodologies category. For comparison with the information above, the following table provides summary statistics for all permanent job vacancies requiring process or methodology skills in the Midlands.

Permanent vacancies with a requirement for process or methodology skills 6,041 10,057 7,491
As % of all permanent jobs advertised in the Midlands 87.32% 79.28% 95.90%
Number of salaries quoted 2,954 6,494 4,282
10th Percentile £26,750 £26,750 £30,028
25th Percentile £32,500 £35,000 £39,028
Median annual salary (50th Percentile) £48,000 £50,000 £52,500
Median % change year-on-year -4.00% -4.76% +5.00%
75th Percentile £63,750 £62,500 £67,500
90th Percentile £77,500 £75,000 £77,725
England median annual salary £55,000 £55,000 £62,500
% change year-on-year - -12.00% +4.17%

Computer Science
Job Vacancy Trend in the Midlands

Job postings citing Computer Science as a proportion of all IT jobs advertised in the Midlands.
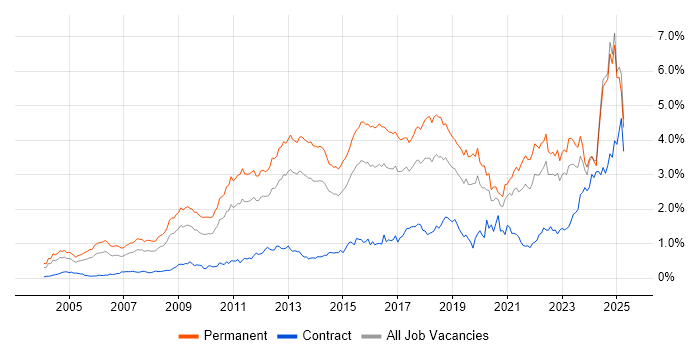
Job vacancy trend for Computer Science in the Midlands

Computer Science
Salary Trend in the Midlands

3-month moving average salary quoted in jobs citing Computer Science in the Midlands.

Salary trend for Computer Science in the Midlands

Computer Science
Salary Histogram in the Midlands

Salary distribution for jobs citing Computer Science in the Midlands over the 6 months to 20 July 2025.

Salary histogram for Computer Science in the Midlands

Computer Science
Job Locations in the Midlands

The table below looks at the demand and provides a guide to the median salaries quoted in IT jobs citing Computer Science within the Midlands region over the 6 months to 20 July 2025. The 'Rank Change' column provides an indication of the change in demand within each location based on the same 6 month period last year.

Location Rank Change
on Same Period
Last Year
Matching
Permanent
IT Job Ads
Median Salary
Past 6 Months
Median Salary
% Change
on Same Period
Last Year
Live
Jobs
West Midlands +3 165 £53,688 +7.38% 157
East Midlands -1 91 £40,101 +0.25% 84
Computer Science
England

Computer Science
Co-occurring Skills and Capabilities in the Midlands by Category

The follow tables expand on the table above by listing co-occurrences grouped by category. The same employment type, locality and period is covered with up to 20 co-occurrences shown in each of the following categories:

Application Platforms
1 3 (1.14%) Microsoft Exchange
2 2 (0.76%) Apache Spark
2 2 (0.76%) CMS
2 2 (0.76%) Jupyter
2 2 (0.76%) WordPress
3 1 (0.38%) SharePoint
Applications
1 29 (11.03%) Chatbot
2 10 (3.80%) Simulink
3 7 (2.66%) Microsoft Office
4 6 (2.28%) Microsoft Excel
4 6 (2.28%) Revit
5 2 (0.76%) MS Visio
Business Applications
1 10 (3.80%) Teamcenter
2 7 (2.66%) Dynamics CRM
2 7 (2.66%) Dynamics NAV
3 3 (1.14%) Sparx Enterprise Architect
4 2 (0.76%) Shopify
5 1 (0.38%) NetSuite
5 1 (0.38%) Oracle EBS
5 1 (0.38%) Sage 200
5 1 (0.38%) SAP ERP
Cloud Services
1 45 (17.11%) Azure
2 31 (11.79%) AWS
3 12 (4.56%) Amazon ECS
4 10 (3.80%) Dynamics 365
4 10 (3.80%) GCP
5 8 (3.04%) Cloud Computing
5 8 (3.04%) Microsoft 365
6 7 (2.66%) Power Platform
7 6 (2.28%) Entra ID
8 5 (1.90%) GitHub
9 4 (1.52%) Cloud Functions
9 4 (1.52%) Google App Engine
9 4 (1.52%) Google Compute Engine
9 4 (1.52%) Google Workspace
9 4 (1.52%) Serverless
10 3 (1.14%) SaaS
11 2 (0.76%) FinancialForce
11 2 (0.76%) Lucidchart
11 2 (0.76%) Slack
11 2 (0.76%) Snowflake
Communications & Networking
1 17 (6.46%) Broadband
2 8 (3.04%) DNS
3 7 (2.66%) DHCP
3 7 (2.66%) Firewall
4 6 (2.28%) VPN
5 5 (1.90%) Modbus
5 5 (1.90%) TCP/IP
5 5 (1.90%) WLAN
6 4 (1.52%) BGP
6 4 (1.52%) HTTP
6 4 (1.52%) OSPF
6 4 (1.52%) VLAN
7 2 (0.76%) LAN
7 2 (0.76%) WAN
8 1 (0.38%) Cisco IOS
8 1 (0.38%) PuTTY
8 1 (0.38%) Wireless
Database & Business Intelligence
1 15 (5.70%) SQL Server
2 11 (4.18%) MySQL
3 8 (3.04%) Big Data
4 7 (2.66%) NoSQL
4 7 (2.66%) Power BI
5 6 (2.28%) Metadata
5 6 (2.28%) Relational Database
6 5 (1.90%) BigQuery
7 4 (1.52%) Cloud Spanner
8 3 (1.14%) Hazelcast
9 2 (0.76%) Elasticsearch
9 2 (0.76%) Electronic Patient Records
9 2 (0.76%) FileMaker
9 2 (0.76%) Hadoop
9 2 (0.76%) Looker
9 2 (0.76%) MongoDB
9 2 (0.76%) PostgreSQL
9 2 (0.76%) Tableau
10 1 (0.38%) SQL Server Reporting Services
10 1 (0.38%) Star Schema
Development Applications
1 17 (6.46%) JIRA
2 13 (4.94%) Selenium
3 11 (4.18%) Rational DOORS
4 6 (2.28%) Git
5 5 (1.90%) ERwin
6 3 (1.14%) GitLab
7 2 (0.76%) ER Studio
7 2 (0.76%) PowerDesigner
8 1 (0.38%) Atlassian Bamboo
8 1 (0.38%) Cucumber
8 1 (0.38%) FitNesse
8 1 (0.38%) Jenkins
8 1 (0.38%) Newman
8 1 (0.38%) Subversion
8 1 (0.38%) TestRail
General
1 100 (38.02%) Social Skills
2 44 (16.73%) Analytical Skills
3 32 (12.17%) Finance
4 25 (9.51%) Manufacturing
5 12 (4.56%) Electronics
6 11 (4.18%) Aerospace
7 10 (3.80%) Inclusion and Diversity
8 9 (3.42%) Retail
9 8 (3.04%) Public Sector
10 7 (2.66%) Presentation Skills
11 5 (1.90%) Advertising
11 5 (1.90%) Automotive
11 5 (1.90%) Documentation Skills
11 5 (1.90%) Law
11 5 (1.90%) Marketing
12 4 (1.52%) Organisational Skills
13 3 (1.14%) Banking
13 3 (1.14%) Financial Institution
13 3 (1.14%) Games
13 3 (1.14%) Multimedia
Job Titles
1 36 (13.69%) Developer
2 30 (11.41%) Lead
3 29 (11.03%) Trainer
4 22 (8.37%) Graduate
5 21 (7.98%) Analyst
6 20 (7.60%) Graduate Developer
7 19 (7.22%) Architect
7 19 (7.22%) Systems Engineer
8 17 (6.46%) Automation Engineer
9 13 (4.94%) C# Developer
9 13 (4.94%) Junior
10 12 (4.56%) Mathematician
10 12 (4.56%) Site Engineer
10 12 (4.56%) Site Reliability Engineer
10 12 (4.56%) Validation Engineer
11 11 (4.18%) Graduate C# Developer
11 11 (4.18%) IT Graduate
12 10 (3.80%) Data Scientist
12 10 (3.80%) Junior Systems Engineer
13 8 (3.04%) Support Analyst
Libraries, Frameworks & Software Standards
1 25 (9.51%) .NET
2 24 (9.13%) HTML
3 14 (5.32%) CSS
4 12 (4.56%) Loki
4 12 (4.56%) React
5 10 (3.80%) ASP.NET
5 10 (3.80%) jQuery
6 7 (2.66%) Middleware
7 6 (2.28%) Node.js
7 6 (2.28%) REST
7 6 (2.28%) WinForms
8 5 (1.90%) EDI
9 4 (1.52%) AngularJS
9 4 (1.52%) Express.js
9 4 (1.52%) React Native
9 4 (1.52%) SailPoint
9 4 (1.52%) Web Services
10 3 (1.14%) Hibernate
10 3 (1.14%) Laravel
10 3 (1.14%) RabbitMQ
Miscellaneous
1 19 (7.22%) Self-Motivation
2 18 (6.84%) SCADA
3 15 (5.70%) Operational Technology
4 10 (3.80%) Management Information System
5 7 (2.66%) Virtual Team
6 6 (2.28%) Algorithms
6 6 (2.28%) Security Posture
7 5 (1.90%) Driving Licence
8 4 (1.52%) Cyberattack
8 4 (1.52%) Mobile App
8 4 (1.52%) Smartphone
9 3 (1.14%) Cyber Threat
10 2 (0.76%) Data Structures
10 2 (0.76%) Hybrid Cloud
10 2 (0.76%) IoT
10 2 (0.76%) Life Science
10 2 (0.76%) Product Ownership
10 2 (0.76%) Security Operations Centre
10 2 (0.76%) Video Conferencing
10 2 (0.76%) Video\Live Streaming
Operating Systems
1 15 (5.70%) Windows
2 12 (4.56%) Linux
3 7 (2.66%) Mac OS X
4 6 (2.28%) Windows 10
4 6 (2.28%) Windows Server
5 4 (1.52%) Ubuntu
5 4 (1.52%) Windows Server 2016
5 4 (1.52%) Windows Server 2019
6 2 (0.76%) Mac OS
7 1 (0.38%) OpenVMS
7 1 (0.38%) Red Hat Enterprise Linux
7 1 (0.38%) Unix
Processes & Methodologies
1 77 (29.28%) Problem-Solving
2 68 (25.86%) Artificial Intelligence
3 58 (22.05%) Mathematics
4 49 (18.63%) Mentoring
5 41 (15.59%) Statistics
6 40 (15.21%) Continuous Improvement
7 38 (14.45%) Machine Learning
8 37 (14.07%) Agile
9 35 (13.31%) Cybersecurity
10 29 (11.03%) Conversational UI
10 29 (11.03%) DevOps
11 26 (9.89%) Project Management
12 24 (9.13%) Data Privacy
12 24 (9.13%) Roadmaps
12 24 (9.13%) Validation
13 21 (7.98%) Analytics
14 19 (7.22%) Product Management
14 19 (7.22%) UML
15 18 (6.84%) Data Science
15 18 (6.84%) Physics
Programming Languages
1 71 (27.00%) SQL
2 58 (22.05%) C#
3 46 (17.49%) Java
4 42 (15.97%) Python
5 35 (13.31%) JavaScript
6 33 (12.55%) C++
7 32 (12.17%) PHP
8 31 (11.79%) TypeScript
9 29 (11.03%) MATLAB
10 26 (9.89%) R
11 21 (7.98%) C
12 19 (7.22%) Dart
12 19 (7.22%) Ruby
12 19 (7.22%) Rust
13 4 (1.52%) PL/SQL
13 4 (1.52%) PowerShell
14 1 (0.38%) Bash
14 1 (0.38%) Kusto Query Language
Qualifications
1 237 (90.11%) Degree
2 132 (50.19%) Computer Science Degree
3 31 (11.79%) Master's Degree
3 31 (11.79%) PhD
4 19 (7.22%) BPSS Clearance
5 17 (6.46%) Security Cleared
6 12 (4.56%) ISTQB
7 11 (4.18%) Microsoft Certification
8 9 (3.42%) SC Cleared
9 8 (3.04%) DBS Check
9 8 (3.04%) HND
10 7 (2.66%) MCSE
11 6 (2.28%) Chartered Engineer
12 5 (1.90%) DV Cleared
12 5 (1.90%) MCP
13 4 (1.52%) CISSP
13 4 (1.52%) CITP
13 4 (1.52%) HNC
13 4 (1.52%) TOGAF Certification
14 3 (1.14%) Cisco Certification
Quality Assurance & Compliance
1 7 (2.66%) QA
2 6 (2.28%) ISO/IEC 12207
3 4 (1.52%) ISO 9001
4 3 (1.14%) Data Quality
4 3 (1.14%) ISO/IEC 27001
5 2 (0.76%) Cyber Essentials
5 2 (0.76%) Cyber Essentials PLUS
5 2 (0.76%) NIST
6 1 (0.38%) ISO 22301
System Software
1 9 (3.42%) Active Directory
2 4 (1.52%) Docker
3 3 (1.14%) VMware Infrastructure
4 2 (0.76%) Firmware
Systems Management
1 17 (6.46%) Kubernetes
2 12 (4.56%) Grafana
2 12 (4.56%) Prometheus
2 12 (4.56%) Terraform
3 1 (0.38%) Microsoft Intune
3 1 (0.38%) Oracle RMAN
Vendors
1 39 (14.83%) Microsoft
2 29 (11.03%) PayPal
3 16 (6.08%) Google
4 10 (3.80%) IBM
5 6 (2.28%) Cisco
6 4 (1.52%) Apple
6 4 (1.52%) Dell
6 4 (1.52%) Fortinet
6 4 (1.52%) Okta
6 4 (1.52%) ServiceNow
6 4 (1.52%) Ubiquiti
7 3 (1.14%) Oracle
7 3 (1.14%) Salesforce
7 3 (1.14%) Sparx
7 3 (1.14%) VMware
8 2 (0.76%) Databricks
8 2 (0.76%) MuleSoft
8 2 (0.76%) SAP
8 2 (0.76%) WooCommerce
9 1 (0.38%) Lauterbach