Computer Science Jobs in England

Computer Science
UK > England

The following table provides summary statistics for permanent job vacancies advertised in England with a requirement for Computer Science skills. Included is a benchmarking guide to the salaries offered in vacancies that have cited Computer Science over the 6 months to 27 April 2024 with a comparison to the same period in the previous 2 years.

6 months to
27 Apr 2024
Same period 2023 Same period 2022
Rank 40 58 44
Rank change year-on-year +18 -14 +12
Permanent jobs citing Computer Science 4,154 4,796 8,924
As % of all permanent jobs advertised in England 4.90% 5.14% 6.83%
As % of the Processes & Methodologies category 5.70% 5.38% 7.14%
Number of salaries quoted 3,020 2,683 3,444
10th Percentile £32,500 £36,250 £32,000
25th Percentile £41,250 £45,000 £42,500
Median annual salary (50th Percentile) £60,000 £65,000 £60,000
Median % change year-on-year -7.69% +8.33% -
75th Percentile £82,816 £91,250 £85,000
90th Percentile £105,000 £115,000 £105,000
UK median annual salary £60,000 £65,000 £60,000
% change year-on-year -7.69% +8.33% +4.35%

All Process and Methodology Skills
England

Computer Science is in the Processes and Methodologies category. The following table is for comparison with the above and provides summary statistics for all permanent job vacancies advertised in England with a requirement for process or methodology skills.

Permanent vacancies with a requirement for process or methodology skills 72,814 89,178 125,034
As % of all permanent jobs advertised in England 85.85% 95.66% 95.65%
Number of salaries quoted 53,731 52,642 73,765
10th Percentile £29,000 £34,250 £33,327
25th Percentile £39,750 £46,000 £44,250
Median annual salary (50th Percentile) £55,000 £62,500 £60,000
Median % change year-on-year -12.00% +4.17% +9.09%
75th Percentile £73,750 £82,500 £80,000
90th Percentile £93,750 £101,250 £97,500
UK median annual salary £55,000 £62,000 £60,000
% change year-on-year -11.29% +3.33% +9.09%

Computer Science
Job Vacancy Trend in England

Job postings citing Computer Science as a proportion of all IT jobs advertised in England.
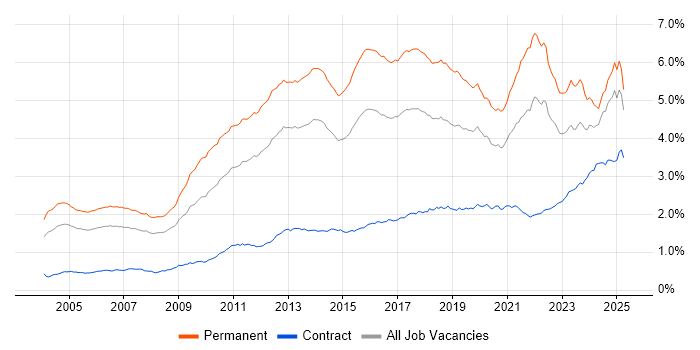
Job vacancy trend for Computer Science in England

Computer Science
Salary Trend in England

3-month moving average salary quoted in jobs citing Computer Science in England.

Salary trend for Computer Science in England

Computer Science
Salary Histogram in England

Salary distribution for jobs citing Computer Science in England over the 6 months to 27 April 2024.

Salary histogram for Computer Science in England

Computer Science
Job Locations in England

The table below looks at the demand and provides a guide to the median salaries quoted in IT jobs citing Computer Science within the England region over the 6 months to 27 April 2024. The 'Rank Change' column provides an indication of the change in demand within each location based on the same 6 month period last year.

Location Rank Change
on Same Period
Last Year
Matching
Permanent
IT Job Ads
Median Salary
Past 6 Months
Median Salary
% Change
on Same Period
Last Year
Live
Jobs
London +6 1,534 £77,500 -3.13% 818
South East +4 1,012 £60,000 +9.09% 232
North of England +100 632 £47,500 - 203
Midlands +21 369 £50,000 -1.96% 118
North West +92 348 £50,000 -6.98% 115
South West +19 338 £48,750 -7.14% 101
West Midlands +35 251 £51,431 -3.87% 63
East of England -5 247 £46,000 -1.08% 157
Yorkshire +96 224 £45,000 -12.62% 55
East Midlands -6 112 £42,500 -5.56% 55
North East +12 60 £50,617 +26.54% 34
Computer Science
UK

Computer Science
Co-occurring Skills and Capabilities in England by Category

The follow tables expand on the table above by listing co-occurrences grouped by category. The same employment type, locality and period is covered with up to 20 co-occurrences shown in each of the following categories:

Application Platforms
1 143 (3.44%) Microsoft Exchange
2 79 (1.90%) Apache Spark
3 78 (1.88%) SharePoint
4 42 (1.01%) Apache
5 39 (0.94%) CMS
6 36 (0.87%) Confluence
7 32 (0.77%) SAS
8 24 (0.58%) IIS
9 23 (0.55%) WordPress
10 20 (0.48%) Apache Airflow
11 12 (0.29%) Jupyter
11 12 (0.29%) Tomcat
12 10 (0.24%) OpenStack
13 8 (0.19%) Apache Pig
13 8 (0.19%) Oracle Workflow
14 7 (0.17%) nginx
15 6 (0.14%) Moodle
16 4 (0.096%) Adobe Experience Manager
17 3 (0.072%) WildFly
18 2 (0.048%) Cloud Foundry
Applications
1 99 (2.38%) Microsoft Office
2 69 (1.66%) Microsoft Excel
3 35 (0.84%) Simulink
4 23 (0.55%) Microsoft PowerPoint
5 16 (0.39%) Photoshop
6 14 (0.34%) Trello
7 9 (0.22%) MS Visio
7 9 (0.22%) SPSS
8 4 (0.096%) Microsoft Project
9 3 (0.072%) Sketch
9 3 (0.072%) Spreadsheet
10 2 (0.048%) Adobe Illustrator
10 2 (0.048%) InVision
10 2 (0.048%) Stateflow
10 2 (0.048%) TargetLink
10 2 (0.048%) Zeplin
11 1 (0.024%) Acrobat
11 1 (0.024%) GNU Octave
11 1 (0.024%) Mathematica
11 1 (0.024%) UXPin
Business Applications
1 52 (1.25%) Dynamics CRM
2 26 (0.63%) SDL Web 8
3 22 (0.53%) NetSuite
4 18 (0.43%) SAP S/4HANA
5 10 (0.24%) SAP ERP
6 9 (0.22%) SAP CX
7 8 (0.19%) Shopify
8 5 (0.12%) Distributed Ledger
8 5 (0.12%) Odoo
9 4 (0.096%) Magento
9 4 (0.096%) Sage 200
9 4 (0.096%) SAP CO
9 4 (0.096%) SAP FI
9 4 (0.096%) SAP FI/CO
10 3 (0.072%) Endur
10 3 (0.072%) Payment Gateway
10 3 (0.072%) Sage 300 ERP
10 3 (0.072%) SAP Business One
11 2 (0.048%) CA PPM
11 2 (0.048%) Oracle ERP
Cloud Services
1 768 (18.49%) AWS
2 754 (18.15%) Azure
3 265 (6.38%) Microsoft 365
4 224 (5.39%) Power Platform
5 223 (5.37%) GCP
6 171 (4.12%) SaaS
7 138 (3.32%) Serverless
8 110 (2.65%) GitHub
9 105 (2.53%) AWS Lambda
10 101 (2.43%) Azure DevOps
11 88 (2.12%) Cloud Computing
12 84 (2.02%) Amazon S3
13 56 (1.35%) PowerApps
14 55 (1.32%) Amazon EC2
15 47 (1.13%) Power Automate
16 43 (1.04%) IaaS
17 39 (0.94%) PaaS
18 34 (0.82%) Amazon Kinesis
19 32 (0.77%) Dynamics 365
20 30 (0.72%) Snowflake
Communications & Networking
1 173 (4.16%) WAN
2 150 (3.61%) Network Security
3 148 (3.56%) Firewall
4 141 (3.39%) Wireless
5 130 (3.13%) SD-WAN
6 107 (2.58%) WebEx
7 105 (2.53%) Cisco IOS
8 86 (2.07%) TCP/IP
9 82 (1.97%) DNS
10 77 (1.85%) VPN
11 57 (1.37%) Internet
12 47 (1.13%) Wi-Fi
13 46 (1.11%) LAN
14 44 (1.06%) HTTP
15 41 (0.99%) Intrusion Detection
16 39 (0.94%) DHCP
17 28 (0.67%) VLAN
18 27 (0.65%) SAN
19 23 (0.55%) Ethernet
20 22 (0.53%) RS-232
Database & Business Intelligence
1 395 (9.51%) SQL Server
2 207 (4.98%) Power BI
3 179 (4.31%) MySQL
4 167 (4.02%) NoSQL
5 164 (3.95%) Relational Database
6 138 (3.32%) PostgreSQL
7 129 (3.11%) Data Warehouse
8 105 (2.53%) Redis
9 99 (2.38%) Big Data
10 77 (1.85%) Tableau
11 63 (1.52%) SQL Server Integration Services
12 62 (1.49%) Hadoop
13 57 (1.37%) Amazon RDS
14 51 (1.23%) SQL Server Reporting Services
15 48 (1.16%) Amazon Redshift
15 48 (1.16%) MongoDB
16 41 (0.99%) RDBMS
17 37 (0.89%) Data Lake
18 30 (0.72%) Elasticsearch
19 29 (0.70%) Azure SQL Database
Development Applications
1 480 (11.56%) Git
2 159 (3.83%) JIRA
3 80 (1.93%) Jenkins
4 73 (1.76%) Visual Studio
5 69 (1.66%) GitLab
6 53 (1.28%) Selenium
7 45 (1.08%) Cypress.io
8 42 (1.01%) TeamCity
9 41 (0.99%) NUnit
9 41 (0.99%) Subversion
10 38 (0.91%) Moq
11 33 (0.79%) CMake
12 32 (0.77%) Burp Suite
13 30 (0.72%) Metasploit
13 30 (0.72%) Postman
14 25 (0.60%) Maven
15 23 (0.55%) Bitbucket
15 23 (0.55%) JUnit
16 19 (0.46%) Sourcetree
17 17 (0.41%) Octopus Deploy
General
1 1,736 (41.79%) Social Skills
2 783 (18.85%) Analytical Skills
3 637 (15.33%) Finance
4 288 (6.93%) Inclusion and Diversity
5 202 (4.86%) Manufacturing
6 201 (4.84%) Marketing
7 184 (4.43%) Electronics
8 125 (3.01%) Retail
9 110 (2.65%) Games
9 110 (2.65%) Public Sector
10 109 (2.62%) Presentation Skills
11 107 (2.58%) Legal
12 93 (2.24%) Telecoms
13 81 (1.95%) Organisational Skills
14 77 (1.85%) Banking
15 76 (1.83%) Law
16 69 (1.66%) Automotive
17 65 (1.56%) Aerospace
17 65 (1.56%) Front Office
18 63 (1.52%) Military
Job Titles
1 1,074 (25.85%) Developer
2 683 (16.44%) Senior
3 491 (11.82%) Software Engineer
4 386 (9.29%) Lead
5 258 (6.21%) Analyst
6 256 (6.16%) Software Developer
7 238 (5.73%) Senior Developer
8 235 (5.66%) Architect
9 204 (4.91%) Data Scientist
10 148 (3.56%) Junior
11 141 (3.39%) IT Support
12 135 (3.25%) Senior Software Engineer
13 132 (3.18%) Graduate
14 122 (2.94%) .NET Developer
15 113 (2.72%) Support Specialist
16 111 (2.67%) Full Stack Developer
17 107 (2.58%) IT Support Specialist
18 93 (2.24%) C# Developer
18 93 (2.24%) Data Engineer
19 92 (2.21%) Java Developer
Libraries, Frameworks & Software Standards
1 627 (15.09%) .NET
2 407 (9.80%) React
3 388 (9.34%) HTML
4 371 (8.93%) CSS
5 258 (6.21%) AngularJS
6 166 (4.00%) .NET Core
7 160 (3.85%) ASP.NET
8 158 (3.80%) Node.js
9 148 (3.56%) RESTful
10 130 (3.13%) .NET Framework
10 130 (3.13%) REST
11 127 (3.06%) HTML5
12 115 (2.77%) Kafka
13 110 (2.65%) Web Services
14 103 (2.48%) Spring
15 100 (2.41%) JSON
16 93 (2.24%) Vue
17 87 (2.09%) XML
18 82 (1.97%) jQuery
19 77 (1.85%) SOAP
Miscellaneous
1 471 (11.34%) Algorithms
2 385 (9.27%) Management Information System
3 239 (5.75%) Self-Motivation
4 198 (4.77%) Data Structures
5 145 (3.49%) Client/Server
6 122 (2.94%) Product Ownership
7 109 (2.62%) Video Conferencing
8 105 (2.53%) Wiki
9 103 (2.48%) Greenfield Project
10 97 (2.34%) Mobile App
11 93 (2.24%) Onboarding
12 73 (1.76%) Cloud Native
12 73 (1.76%) Data Centre
13 69 (1.66%) IoT
14 68 (1.64%) Virtual Team
15 62 (1.49%) Cyber Threat
16 57 (1.37%) Distributed Systems
17 51 (1.23%) Embedded Systems
17 51 (1.23%) Hedge funds
17 51 (1.23%) Security Posture
Operating Systems
1 543 (13.07%) Windows
2 472 (11.36%) Linux
3 185 (4.45%) Android
4 151 (3.64%) Windows 10
5 101 (2.43%) Windows Server
6 79 (1.90%) Unix
7 64 (1.54%) Apple iOS
8 56 (1.35%) Mac OS
9 33 (0.79%) Kali Linux
10 26 (0.63%) Ubuntu
11 21 (0.51%) Windows Server 2016
11 21 (0.51%) Windows Server 2019
12 18 (0.43%) Red Hat Enterprise Linux
13 17 (0.41%) CentOS
14 15 (0.36%) Embedded Linux
15 11 (0.26%) Debian
16 10 (0.24%) VMS
17 8 (0.19%) Windows Server 2012
18 5 (0.12%) Mac OS X
19 4 (0.096%) SUSE
Processes & Methodologies
1 1,628 (39.19%) Problem-Solving
2 1,072 (25.81%) Agile
3 1,043 (25.11%) Software Engineering
4 693 (16.68%) Mathematics
5 517 (12.45%) Mentoring
6 493 (11.87%) DevOps
7 478 (11.51%) Artificial Intelligence
8 464 (11.17%) Cybersecurity
9 437 (10.52%) Data Science
10 425 (10.23%) Machine Learning
11 370 (8.91%) Analytics
12 369 (8.88%) Decision-Making
12 369 (8.88%) Project Management
13 349 (8.40%) Data Analysis
14 318 (7.66%) CI/CD
15 301 (7.25%) Roadmaps
16 283 (6.81%) Full Stack Development
17 267 (6.43%) Continuous Improvement
18 264 (6.36%) Business Intelligence
19 260 (6.26%) Coaching
Programming Languages
1 968 (23.30%) Python
2 883 (21.26%) SQL
3 864 (20.80%) C#
4 773 (18.61%) JavaScript
5 480 (11.56%) Java
6 326 (7.85%) TypeScript
7 325 (7.82%) C++
8 281 (6.76%) C
9 153 (3.68%) PHP
10 115 (2.77%) PowerShell
11 97 (2.34%) R
12 77 (1.85%) Bash
12 77 (1.85%) T-SQL
13 74 (1.78%) Fortran
14 71 (1.71%) Go
15 57 (1.37%) Kotlin
16 53 (1.28%) Scala
17 51 (1.23%) MATLAB
18 33 (0.79%) Perl
19 31 (0.75%) Embedded C
Qualifications
1 3,768 (90.71%) Degree
2 2,141 (51.54%) Computer Science Degree
3 708 (17.04%) Master's Degree
4 259 (6.23%) Security Cleared
5 207 (4.98%) PhD
6 157 (3.78%) SC Cleared
7 156 (3.76%) CISSP
8 132 (3.18%) Microsoft Certification
9 97 (2.34%) Cisco Certification
10 94 (2.26%) CISM
11 78 (1.88%) AWS Certification
12 73 (1.76%) Azure Certification
13 63 (1.52%) PMI Certification
14 56 (1.35%) PMP
15 52 (1.25%) CCNP
16 51 (1.23%) CCNA
17 43 (1.04%) A+ Certification
17 43 (1.04%) CISA
18 41 (0.99%) DBS Check
18 41 (0.99%) Numerate Degree
Quality Assurance & Compliance
1 250 (6.02%) QA
2 105 (2.53%) ISO/IEC 27001
3 99 (2.38%) Data Quality
4 96 (2.31%) GDPR
5 75 (1.81%) Accessibility
6 73 (1.76%) NIST
7 38 (0.91%) PMO
8 34 (0.82%) PCI DSS
8 34 (0.82%) WCAG
9 26 (0.63%) Cyber Essentials
10 25 (0.60%) SLA
11 22 (0.53%) HIPAA
12 18 (0.43%) SOC 2
13 15 (0.36%) ISO 13485
14 14 (0.34%) Actionable Recommendations
14 14 (0.34%) GRC
14 14 (0.34%) NCSC
14 14 (0.34%) Sarbanes-Oxley
15 12 (0.29%) California Consumer Privacy Act
16 11 (0.26%) CDISC
System Software
1 415 (9.99%) Docker
2 239 (5.75%) Active Directory
3 112 (2.70%) VMware ESXi
4 108 (2.60%) XenApp
5 105 (2.53%) Microsoft App-V
5 105 (2.53%) XenDesktop
6 74 (1.78%) VMware Infrastructure
7 68 (1.64%) Firmware
8 35 (0.84%) Virtual Machines
9 32 (0.77%) Hyper-V
10 24 (0.58%) Embedded Firmware
11 12 (0.29%) HDFS
12 9 (0.22%) vSphere
13 8 (0.19%) KVM
13 8 (0.19%) Virtual Desktop
14 7 (0.17%) Virtual Servers
15 4 (0.096%) pfSense
16 2 (0.048%) LXC
16 2 (0.048%) NFS
17 1 (0.024%) Microsoft Virtual Server
Systems Management
1 311 (7.49%) Kubernetes
2 147 (3.54%) Terraform
3 117 (2.82%) SCCM
4 105 (2.53%) AirWatch
5 53 (1.28%) Ansible
6 20 (0.48%) Microsoft Intune
7 15 (0.36%) Puppet
8 14 (0.34%) ZABBIX
9 12 (0.29%) Grafana
9 12 (0.29%) WSUS
10 10 (0.24%) Nagios
11 9 (0.22%) Nessus
12 7 (0.17%) CASB
12 7 (0.17%) Kubeflow
12 7 (0.17%) Prometheus
12 7 (0.17%) SCOM
13 6 (0.14%) CloudHub
13 6 (0.14%) Computer Emergency Response Teams
13 6 (0.14%) QRadar
13 6 (0.14%) Single Sign-On
Vendors
1 692 (16.66%) Microsoft
2 195 (4.69%) Cisco
3 155 (3.73%) Google
4 111 (2.67%) Citrix
5 105 (2.53%) Oracle
6 92 (2.21%) SAP
7 91 (2.19%) VMware
8 60 (1.44%) Salesforce
9 33 (0.79%) Databricks
10 31 (0.75%) Adobe
11 29 (0.70%) Xilinx
12 28 (0.67%) Juniper
13 25 (0.60%) Apple
14 22 (0.53%) Atlassian
14 22 (0.53%) ServiceNow
15 21 (0.51%) IBM
16 20 (0.48%) F5
17 19 (0.46%) Xamarin
18 15 (0.36%) Red Hat
18 15 (0.36%) Veeam