Coaching Jobs in the North of England

Coaching
England > North of England

The table below provides summary statistics for permanent job vacancies advertised in the North of England requiring Coaching skills. It includes a benchmarking guide to the annual salaries offered in vacancies that cited Coaching over the 6 months leading up to 17 June 2025, comparing them to the same period in the previous two years.

6 months to
17 Jun 2025
Same period 2024 Same period 2023
Rank 45 19 20
Rank change year-on-year -26 +1 +16
Permanent jobs citing Coaching 695 1,617 1,609
As % of all permanent jobs advertised in the North of England 5.86% 7.94% 10.44%
As % of the Processes & Methodologies category 6.35% 9.95% 10.80%
Number of salaries quoted 374 1,194 340
10th Percentile £33,775 £36,000 £36,075
25th Percentile £48,000 £42,238 £47,500
Median annual salary (50th Percentile) £54,793 £57,965 £65,000
Median % change year-on-year -5.47% -10.82% +4.00%
75th Percentile - £75,772 £81,095
90th Percentile £79,625 £84,964 £90,250
England median annual salary £54,793 £60,000 £67,500
% change year-on-year -8.68% -11.11% -0.33%

All Process and Methodology Skills
North of England

Coaching falls under the Processes and Methodologies category. For comparison with the information above, the following table provides summary statistics for all permanent job vacancies requiring process or methodology skills in the North of England.

Permanent vacancies with a requirement for process or methodology skills 10,953 16,253 14,902
As % of all permanent jobs advertised in the North of England 92.30% 79.76% 96.72%
Number of salaries quoted 5,453 11,957 7,737
10th Percentile £25,084 £27,500 £31,250
25th Percentile £33,250 £37,500 £40,000
Median annual salary (50th Percentile) £50,000 £50,000 £55,000
Median % change year-on-year - -9.09% +10.00%
75th Percentile £61,967 £65,000 £70,000
90th Percentile £77,500 £79,000 £81,250
England median annual salary £57,500 £55,000 £62,500
% change year-on-year +4.55% -12.00% +4.17%

Coaching
Job Vacancy Trend in the North of England

Job postings citing Coaching as a proportion of all IT jobs advertised in the North of England.
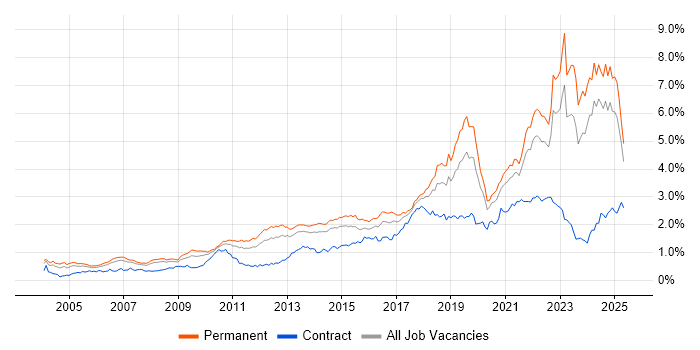
Job vacancy trend for Coaching in the North of England

Coaching
Salary Trend in the North of England

3-month moving average salary quoted in jobs citing Coaching in the North of England.

Salary trend for Coaching in the North of England

Coaching
Salary Histogram in the North of England

Salary distribution for jobs citing Coaching in the North of England over the 6 months to 17 June 2025.

Salary histogram for Coaching in the North of England

Coaching
Job Locations in the North of England

The table below looks at the demand and provides a guide to the median salaries quoted in IT jobs citing Coaching within the North of England region over the 6 months to 17 June 2025. The 'Rank Change' column provides an indication of the change in demand within each location based on the same 6 month period last year.

Location Rank Change
on Same Period
Last Year
Matching
Permanent
IT Job Ads
Median Salary
Past 6 Months
Median Salary
% Change
on Same Period
Last Year
Live
Jobs
North West -19 550 £54,793 -5.47% 1,396
Yorkshire -53 95 £70,000 +14.37% 840
North East -18 50 £40,000 -34.65% 335
Coaching
England

Coaching
Co-occurring Skills and Capabilities in the North of England by Category

The follow tables expand on the table above by listing co-occurrences grouped by category. The same employment type, locality and period is covered with up to 20 co-occurrences shown in each of the following categories:

Application Platforms
1 11 (1.58%) SharePoint
2 6 (0.86%) Confluence
3 4 (0.58%) Microsoft Exchange
4 3 (0.43%) Apache Airflow
4 3 (0.43%) Apache Spark
4 3 (0.43%) SAS
5 1 (0.14%) WordPress
Applications
1 54 (7.77%) Microsoft Office
2 50 (7.19%) Simulink
3 10 (1.44%) Microsoft Excel
4 9 (1.29%) Microsoft PowerPoint
5 1 (0.14%) Microsoft Project
Business Applications
1 3 (0.43%) Sage 50
2 1 (0.14%) SAP Business One
Cloud Services
1 73 (10.50%) Azure
2 59 (8.49%) AWS
3 26 (3.74%) Microsoft 365
4 22 (3.17%) GCP
5 20 (2.88%) Power Platform
6 13 (1.87%) Azure DevOps
7 10 (1.44%) Azure Machine Learning
8 7 (1.01%) GitHub
9 6 (0.86%) Serverless
10 5 (0.72%) Cloud Composer
10 5 (0.72%) Cloud Computing
10 5 (0.72%) Entra ID
10 5 (0.72%) Mimecast
11 4 (0.58%) Amazon SQS
11 4 (0.58%) AWS Lambda
12 3 (0.43%) Amazon EKS
12 3 (0.43%) Amazon S3
12 3 (0.43%) AWS CloudFormation
12 3 (0.43%) Dynamics 365
13 2 (0.29%) SaaS
Communications & Networking
1 19 (2.73%) VoIP
2 9 (1.29%) Wireless
3 8 (1.15%) 5G
3 8 (1.15%) Bluetooth
3 8 (1.15%) GSM
3 8 (1.15%) LTE
3 8 (1.15%) UMTS
3 8 (1.15%) Wi-Fi
4 6 (0.86%) Broadband
4 6 (0.86%) DHCP
4 6 (0.86%) DNS
5 5 (0.72%) TCP/IP
5 5 (0.72%) VPN
6 4 (0.58%) Firewall
7 3 (0.43%) Internet
7 3 (0.43%) PuTTY
8 2 (0.29%) LAN
8 2 (0.29%) WAN
Database & Business Intelligence
1 18 (2.59%) Power BI
2 17 (2.45%) SQL Server
3 13 (1.87%) Cloud Spanner
3 13 (1.87%) PostgreSQL
4 10 (1.44%) BigQuery
5 8 (1.15%) Data Warehouse
6 7 (1.01%) MongoDB
6 7 (1.01%) MySQL
7 4 (0.58%) Biml
7 4 (0.58%) BusinessObjects
7 4 (0.58%) NoSQL
7 4 (0.58%) SQL Server Analysis Services
7 4 (0.58%) SQL Server Integration Services
7 4 (0.58%) SQL Server Reporting Services
7 4 (0.58%) Tableau
8 3 (0.43%) Amazon Athena
8 3 (0.43%) Impala
8 3 (0.43%) Metadata
8 3 (0.43%) Qlik Sense
8 3 (0.43%) Spark SQL
Development Applications
1 20 (2.88%) Git
2 16 (2.30%) JIRA
3 8 (1.15%) Jenkins
4 7 (1.01%) ClearCase
4 7 (1.01%) Rational DOORS
5 6 (0.86%) GitLab
6 5 (0.72%) Cucumber
7 4 (0.58%) Robot Framework
7 4 (0.58%) Visual Studio
8 2 (0.29%) Postman
8 2 (0.29%) SoapUI
9 1 (0.14%) Appium
9 1 (0.14%) ESLint
9 1 (0.14%) Katalon Studio
9 1 (0.14%) Selenium
9 1 (0.14%) Storybook
9 1 (0.14%) webpack
General
1 209 (30.07%) Social Skills
2 181 (26.04%) Aerospace
3 141 (20.29%) Aeronautics
4 117 (16.83%) Finance
5 75 (10.79%) Analytical Skills
6 68 (9.78%) Automotive
7 65 (9.35%) Manufacturing
8 62 (8.92%) Influencing Skills
9 61 (8.78%) Avionics
10 46 (6.62%) Banking
11 44 (6.33%) Retail
12 17 (2.45%) Law
13 15 (2.16%) Legal
14 13 (1.87%) Inclusion and Diversity
14 13 (1.87%) Public Sector
15 12 (1.73%) Games
15 12 (1.73%) Marketing
16 11 (1.58%) Electronics
17 8 (1.15%) Local Government
17 8 (1.15%) Presentation Skills
Job Titles
1 364 (52.37%) Senior
2 270 (38.85%) Systems Engineer
3 263 (37.84%) Senior Systems Engineer
4 256 (36.83%) Lead
5 125 (17.99%) Team Leader
6 116 (16.69%) Lead Systems Engineer
7 32 (4.60%) Instrumentation Engineer
7 32 (4.60%) Senior Electrical Engineer
8 19 (2.73%) Developer
9 18 (2.59%) Analyst
9 18 (2.59%) Project Manager
9 18 (2.59%) Senior Manager
9 18 (2.59%) Software Engineer
10 16 (2.30%) Senior Software Engineer
11 15 (2.16%) Technical Leader
12 14 (2.01%) Engineering Manager
13 13 (1.87%) Data Engineer
13 13 (1.87%) Development Manager
13 13 (1.87%) Test Engineer
14 11 (1.58%) Business Manager
Libraries, Frameworks & Software Standards
1 25 (3.60%) .NET
2 22 (3.17%) React
3 20 (2.88%) AngularJS
4 15 (2.16%) Kafka
5 14 (2.01%) Node.js
6 13 (1.87%) .NET Core
6 13 (1.87%) Spring Boot
7 10 (1.44%) RESTful
8 7 (1.01%) Laravel
8 7 (1.01%) XML
8 7 (1.01%) XSD
9 6 (0.86%) .NET Framework
9 6 (0.86%) Vue
10 5 (0.72%) REST
11 4 (0.58%) ASP.NET Web Forms
11 4 (0.58%) PySpark
11 4 (0.58%) WinForms
12 3 (0.43%) Apache NiFi
12 3 (0.43%) Serverless Framework
12 3 (0.43%) Spring
Miscellaneous
1 20 (2.88%) Self-Motivation
2 15 (2.16%) Management Information System
2 15 (2.16%) Product Ownership
3 14 (2.01%) Public Cloud
4 13 (1.87%) Driving Licence
5 11 (1.58%) Private Cloud
6 10 (1.44%) Social Media
7 8 (1.15%) Algorithms
7 8 (1.15%) e-Learning
7 8 (1.15%) FMCG
8 7 (1.01%) Enterprise Cloud
9 6 (0.86%) Cloud Native
10 4 (0.58%) Linux Command Line
11 3 (0.43%) Analytical Mindset
11 3 (0.43%) Data Centre
11 3 (0.43%) Hybrid Cloud
11 3 (0.43%) Onboarding
11 3 (0.43%) Virtual Reality
12 2 (0.29%) Educational Technology
12 2 (0.29%) Legacy Systems
Operating Systems
1 35 (5.04%) Windows
2 20 (2.88%) Linux
3 10 (1.44%) Windows Vista
4 6 (0.86%) Windows 10
4 6 (0.86%) Windows Server
5 4 (0.58%) Windows Server 2012
6 3 (0.43%) Unix
7 2 (0.29%) Red Hat Enterprise Linux
8 1 (0.14%) Mac OS
Processes & Methodologies
1 295 (42.45%) Systems Engineering
2 197 (28.35%) Mentoring
3 178 (25.61%) Mathematics
3 178 (25.61%) Physics
4 176 (25.32%) Model-Based Systems Engineering
5 164 (23.60%) Agile
6 86 (12.37%) Continuous Improvement
6 86 (12.37%) Performance Management
7 79 (11.37%) Problem-Solving
7 79 (11.37%) Six Sigma
8 76 (10.94%) Cost Control
9 72 (10.36%) Collaborative Working
9 72 (10.36%) Customer Requirements
10 68 (9.78%) Project Management
11 62 (8.92%) Lean Manufacturing
12 61 (8.78%) Cryptography
13 60 (8.63%) Technical Leadership
14 56 (8.06%) Software Engineering
15 54 (7.77%) CMMI
15 54 (7.77%) System Testing
Programming Languages
1 50 (7.19%) SQL
2 37 (5.32%) JavaScript
3 35 (5.04%) Java
4 29 (4.17%) TypeScript
5 26 (3.74%) Python
6 24 (3.45%) C#
7 14 (2.01%) PowerShell
8 11 (1.58%) Bash
9 7 (1.01%) PHP
10 5 (0.72%) T-SQL
11 3 (0.43%) PROC SQL
11 3 (0.43%) R
12 2 (0.29%) Apex Code
12 2 (0.29%) Kotlin
13 1 (0.14%) Bicep
13 1 (0.14%) Go
13 1 (0.14%) VBA
Qualifications
1 319 (45.90%) BPSS Clearance
2 311 (44.75%) Degree
3 193 (27.77%) HND
4 90 (12.95%) HNC
5 32 (4.60%) Chartered Engineer
6 24 (3.45%) Six Sigma Black Belt
6 24 (3.45%) Six Sigma Green Belt
7 20 (2.88%) ACCA
8 15 (2.16%) Microsoft Certification
9 13 (1.87%) DBS Check
10 12 (1.73%) CCAB
10 12 (1.73%) CIMA
10 12 (1.73%) CIPFA
10 12 (1.73%) ICAEW
11 10 (1.44%) CRISC
12 7 (1.01%) Security Cleared
13 6 (0.86%) AWS Certification
14 5 (0.72%) Azure Certification
14 5 (0.72%) SC Cleared
15 4 (0.58%) Cisco Certification
Quality Assurance & Compliance
1 61 (8.78%) ISO 9001
2 54 (7.77%) AQAP
3 37 (5.32%) ARP4754
3 37 (5.32%) DO-254
3 37 (5.32%) IEC 61508
4 29 (4.17%) QA
5 16 (2.30%) Data Quality
6 10 (1.44%) Cyber Essentials
7 9 (1.29%) COBIT
8 8 (1.15%) GAAP
8 8 (1.15%) IFRS
9 7 (1.01%) Sarbanes-Oxley
10 6 (0.86%) ITGC
11 5 (0.72%) Accessibility
11 5 (0.72%) ISO/IEC 27001
11 5 (0.72%) NIST
12 3 (0.43%) ISO 20022
13 2 (0.29%) NCSC
13 2 (0.29%) NIST 800
14 1 (0.14%) PMO
System Software
1 21 (3.02%) Docker
2 16 (2.30%) Active Directory
3 5 (0.72%) Hyper-V
4 3 (0.43%) Apache Flume
4 3 (0.43%) HDFS
4 3 (0.43%) Virtual Desktop
Systems Management
1 24 (3.45%) Kubernetes
2 21 (3.02%) Terraform
3 7 (1.01%) SCCM
4 5 (0.72%) Grafana
5 4 (0.58%) Microsoft Intune
6 3 (0.43%) Kibana
6 3 (0.43%) logstash
6 3 (0.43%) Oozie
6 3 (0.43%) Prometheus
7 2 (0.29%) Ansible
7 2 (0.29%) Microsoft Data Protection Manager
7 2 (0.29%) SCOM
7 2 (0.29%) WSUS
8 1 (0.14%) Istio
8 1 (0.14%) Puppet
Vendors
1 94 (13.53%) Microsoft
2 50 (7.19%) MathWorks
3 32 (4.60%) BT
4 17 (2.45%) Google
5 16 (2.30%) Siemens
6 10 (1.44%) Cisco
6 10 (1.44%) Informatica
7 8 (1.15%) Oracle
8 7 (1.01%) Databricks
9 6 (0.86%) ServiceNow
10 5 (0.72%) Revolut
10 5 (0.72%) SAP
10 5 (0.72%) Sophos
11 4 (0.58%) Sage
11 4 (0.58%) Sun
12 3 (0.43%) Facebook
12 3 (0.43%) Fortinet
12 3 (0.43%) Meraki
12 3 (0.43%) MicroStrategy
12 3 (0.43%) Salesforce