Collaborative Working Jobs in the North of England

Collaborative Working
England > North of England

The table below provides summary statistics for permanent job vacancies advertised in the North of England requiring Collaborative Working skills. It includes a benchmarking guide to the annual salaries offered in vacancies that cited Collaborative Working over the 6 months leading up to 26 April 2025, comparing them to the same period in the previous two years.

6 months to
26 Apr 2025
Same period 2024 Same period 2023
Rank 123 85 78
Rank change year-on-year -38 -7 +39
Permanent jobs citing Collaborative Working 244 483 729
As % of all permanent jobs advertised in the North of England 2.23% 2.80% 4.15%
As % of the Processes & Methodologies category 2.36% 3.34% 4.28%
Number of salaries quoted 191 342 346
10th Percentile £35,000 £26,500 £34,861
25th Percentile £41,250 £35,000 £42,500
Median annual salary (50th Percentile) £54,793 £47,500 £57,500
Median % change year-on-year +15.35% -17.39% +4.55%
75th Percentile £63,750 £61,250 £72,500
90th Percentile £82,500 £87,375 £82,125
England median annual salary £55,000 £50,000 £60,000
% change year-on-year +10.00% -16.67% -

All Process and Methodology Skills
North of England

Collaborative Working falls under the Processes and Methodologies category. For comparison with the information above, the following table provides summary statistics for all permanent job vacancies requiring process or methodology skills in the North of England.

Permanent vacancies with a requirement for process or methodology skills 10,320 14,471 17,027
As % of all permanent jobs advertised in the North of England 94.34% 83.85% 96.91%
Number of salaries quoted 5,742 11,115 8,079
10th Percentile £25,750 £27,500 £31,250
25th Percentile £39,500 £37,000 £40,000
Median annual salary (50th Percentile) £50,055 £50,000 £55,000
Median % change year-on-year +0.11% -9.09% +9.45%
75th Percentile £63,750 £65,000 £70,000
90th Percentile £78,750 £80,000 £82,500
England median annual salary £57,560 £55,000 £62,500
% change year-on-year +4.65% -12.00% +4.17%

Collaborative Working
Job Vacancy Trend in the North of England

Job postings citing Collaborative Working as a proportion of all IT jobs advertised in the North of England.
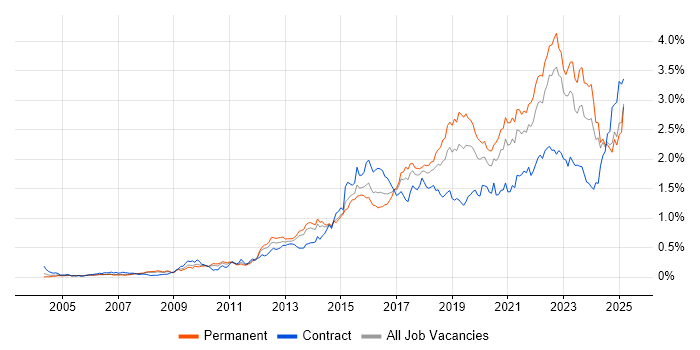
Job vacancy trend for Collaborative Working in the North of England

Collaborative Working
Salary Trend in the North of England

3-month moving average salary quoted in jobs citing Collaborative Working in the North of England.

Salary trend for Collaborative Working in the North of England

Collaborative Working
Salary Histogram in the North of England

Salary distribution for jobs citing Collaborative Working in the North of England over the 6 months to 26 April 2025.

Salary histogram for Collaborative Working in the North of England

Collaborative Working
Job Locations in the North of England

The table below looks at the demand and provides a guide to the median salaries quoted in IT jobs citing Collaborative Working within the North of England region over the 6 months to 26 April 2025. The 'Rank Change' column provides an indication of the change in demand within each location based on the same 6 month period last year.

Location Rank Change
on Same Period
Last Year
Matching
Permanent
IT Job Ads
Median Salary
Past 6 Months
Median Salary
% Change
on Same Period
Last Year
Live
Jobs
North West -46 156 £54,793 +9.59% 204
Yorkshire +17 74 £58,500 +23.16% 88
North East +2 14 £35,000 -16.17% 25
Collaborative Working
England

Collaborative Working
Co-occurring Skills and Capabilities in the North of England by Category

The follow tables expand on the table above by listing co-occurrences grouped by category. The same employment type, locality and period is covered with up to 20 co-occurrences shown in each of the following categories:

Application Platforms
1 14 (5.74%) Confluence
2 6 (2.46%) CMS
3 2 (0.82%) Apache Spark
3 2 (0.82%) Microsoft Exchange
4 1 (0.41%) Kentico
4 1 (0.41%) Mule
4 1 (0.41%) nginx
4 1 (0.41%) SAS
4 1 (0.41%) SharePoint
4 1 (0.41%) Umbraco
4 1 (0.41%) WordPress
Applications
1 11 (4.51%) Microsoft Excel
2 10 (4.10%) SPSS
3 7 (2.87%) Microsoft Project
4 5 (2.05%) Adobe Illustrator
4 5 (2.05%) MS Visio
4 5 (2.05%) Photoshop
5 4 (1.64%) Adobe Premiere
5 4 (1.64%) Microsoft PowerPoint
5 4 (1.64%) Spreadsheet
6 3 (1.23%) Microsoft Office
7 2 (0.82%) Adobe XD
7 2 (0.82%) Trello
8 1 (0.41%) Adobe Creative Suite
8 1 (0.41%) Blender
8 1 (0.41%) InDesign
8 1 (0.41%) Maya
8 1 (0.41%) Sketch
Business Applications
1 17 (6.97%) NetSuite
2 6 (2.46%) Infor LN
2 6 (2.46%) SAP BPC
3 2 (0.82%) Line 50
3 2 (0.82%) Magento
3 2 (0.82%) SAP S/4HANA
3 2 (0.82%) SAP SD
4 1 (0.41%) Shopify
Cloud Services
1 31 (12.70%) Azure
2 19 (7.79%) AWS
3 13 (5.33%) Microsoft 365
4 12 (4.92%) GCP
5 10 (4.10%) Power Platform
6 7 (2.87%) Dynamics 365
6 7 (2.87%) Entra ID
6 7 (2.87%) GitHub
6 7 (2.87%) SaaS
7 6 (2.46%) Serverless
8 5 (2.05%) AWS Lambda
9 4 (1.64%) Azure Logic Apps
9 4 (1.64%) Power Automate
9 4 (1.64%) PowerApps
10 3 (1.23%) AWS CloudFormation
10 3 (1.23%) AWS Step Functions
10 3 (1.23%) Azure DevOps
10 3 (1.23%) Cloud Computing
11 2 (0.82%) Amazon EC2
11 2 (0.82%) Amazon S3
Communications & Networking
1 16 (6.56%) Firewall
2 14 (5.74%) Intrusion Detection
3 3 (1.23%) Network Security
4 2 (0.82%) Wireless
4 2 (0.82%) ZigBee
5 1 (0.41%) ADSL
5 1 (0.41%) Broadband
5 1 (0.41%) DHCP
5 1 (0.41%) DNS
5 1 (0.41%) Internet
5 1 (0.41%) LAN
5 1 (0.41%) NetScaler
5 1 (0.41%) SAN
5 1 (0.41%) WAN
Database & Business Intelligence
1 16 (6.56%) Tableau
2 10 (4.10%) Power BI
3 5 (2.05%) NoSQL
3 5 (2.05%) SQL Server
4 4 (1.64%) Power Query
4 4 (1.64%) PowerPivot
5 3 (1.23%) Azure SQL Database
5 3 (1.23%) Big Data
5 3 (1.23%) Metadata
5 3 (1.23%) PostgreSQL
6 2 (0.82%) Ataccama
6 2 (0.82%) Data Warehouse
6 2 (0.82%) Hadoop
6 2 (0.82%) MongoDB
6 2 (0.82%) Redis
7 1 (0.41%) Amazon RDS
7 1 (0.41%) BigQuery
7 1 (0.41%) DynamoDB
7 1 (0.41%) Looker
7 1 (0.41%) Relational Database
Development Applications
1 17 (6.97%) JIRA
2 12 (4.92%) Jenkins
3 9 (3.69%) Git
4 7 (2.87%) Cucumber
5 6 (2.46%) Oracle Forms
6 4 (1.64%) GitLab
7 2 (0.82%) Visual Studio
8 1 (0.41%) Artifactory
8 1 (0.41%) Bitbucket
8 1 (0.41%) CircleCI
8 1 (0.41%) Eclipse
8 1 (0.41%) git-flow
8 1 (0.41%) JUnit
8 1 (0.41%) NetBeans
8 1 (0.41%) NUnit
8 1 (0.41%) Postman
8 1 (0.41%) SoapUI
8 1 (0.41%) SonarQube
8 1 (0.41%) SQL Server Management Studio (SSMS)
8 1 (0.41%) Visual Studio Code
General
1 172 (70.49%) Social Skills
2 91 (37.30%) Finance
3 80 (32.79%) Analytical Skills
4 43 (17.62%) Influencing Skills
5 41 (16.80%) Avionics
6 33 (13.52%) Organisational Skills
7 26 (10.66%) Banking
8 18 (7.38%) Marketing
9 14 (5.74%) Legal
10 13 (5.33%) Manufacturing
11 9 (3.69%) Retail
12 7 (2.87%) Law
13 6 (2.46%) Billing
13 6 (2.46%) Electronics
13 6 (2.46%) Police
13 6 (2.46%) Public Sector
14 3 (1.23%) Advertising
14 3 (1.23%) Documentation Skills
14 3 (1.23%) Telecoms
15 2 (0.82%) Games
Job Titles
1 70 (28.69%) Senior
2 42 (17.21%) Systems Engineer
3 41 (16.80%) Senior Systems Engineer
4 33 (13.52%) Analyst
5 21 (8.61%) Consultant
6 20 (8.20%) Architect
7 17 (6.97%) Functional Consultant
7 17 (6.97%) Lead
7 17 (6.97%) NetSuite Consultant
8 15 (6.15%) Developer
8 15 (6.15%) Security Architect
9 13 (5.33%) Team Leader
9 13 (5.33%) Vendor Manager
10 11 (4.51%) Business Analyst
11 10 (4.10%) Market Analyst
11 10 (4.10%) Software Engineer
12 6 (2.46%) Project Accountant
12 6 (2.46%) Project Manager
12 6 (2.46%) Quality Engineer
12 6 (2.46%) Software Team Leader
Libraries, Frameworks & Software Standards
1 11 (4.51%) CSS
1 11 (4.51%) HTML
2 7 (2.87%) JWT
2 7 (2.87%) OAuth
2 7 (2.87%) OAuth2
2 7 (2.87%) REST
2 7 (2.87%) SOAP
2 7 (2.87%) Spring
2 7 (2.87%) Spring Boot
3 6 (2.46%) .NET
3 6 (2.46%) RESTful
4 5 (2.05%) Web Services
5 4 (1.64%) Saxon XSLT
6 3 (1.23%) .NET Framework
6 3 (1.23%) GraphQL
6 3 (1.23%) React
7 2 (0.82%) AngularJS
7 2 (0.82%) ASP.NET
7 2 (0.82%) Entity Framework
7 2 (0.82%) Node.js
Miscellaneous
1 37 (15.16%) Social Media
2 29 (11.89%) Self-Motivation
3 27 (11.07%) Team-Oriented Environment
4 24 (9.84%) Management Information System
5 15 (6.15%) Security Posture
6 13 (5.33%) Product Ownership
7 5 (2.05%) Virtual Team
8 4 (1.64%) CMDB
9 3 (1.23%) Algorithms
9 3 (1.23%) Cloud Native
10 2 (0.82%) Analytical Mindset
10 2 (0.82%) Cyber Threat
10 2 (0.82%) Distributed Systems
10 2 (0.82%) NHS
10 2 (0.82%) Smart Energy
11 1 (0.41%) Animation
11 1 (0.41%) Data Protection Act
11 1 (0.41%) Interactive Media
11 1 (0.41%) Online Banking
11 1 (0.41%) Photography
Operating Systems
1 39 (15.98%) Windows
2 34 (13.93%) Windows Vista
3 6 (2.46%) Android
4 4 (1.64%) Linux
5 3 (1.23%) Windows Server
6 1 (0.41%) Ubuntu
6 1 (0.41%) Windows 10
6 1 (0.41%) Windows Server 2012
Processes & Methodologies
1 104 (42.62%) Problem-Solving
2 56 (22.95%) Continuous Improvement
3 53 (21.72%) Agile
4 44 (18.03%) Coaching
5 43 (17.62%) Systems Engineering
6 42 (17.21%) Customer Requirements
7 41 (16.80%) Cryptography
7 41 (16.80%) Model-Based Systems Engineering
8 33 (13.52%) Decision-Making
8 33 (13.52%) DevOps
9 30 (12.30%) Requirements Gathering
10 28 (11.48%) Project Management
11 26 (10.66%) Data Protection
11 26 (10.66%) Scrum
12 24 (9.84%) Computer Science
13 23 (9.43%) Market Research
14 22 (9.02%) ERP
15 21 (8.61%) Analytics
15 21 (8.61%) Service Delivery
16 20 (8.20%) Cybersecurity
Programming Languages
1 17 (6.97%) SQL
2 16 (6.56%) Java
3 14 (5.74%) JavaScript
4 10 (4.10%) Python
5 7 (2.87%) C#
6 6 (2.46%) PHP
7 5 (2.05%) VB
8 4 (1.64%) TypeScript
9 3 (1.23%) Groovy
10 2 (0.82%) ABAP
10 2 (0.82%) Assembly Language
10 2 (0.82%) C
10 2 (0.82%) PowerShell
11 1 (0.41%) Bash
11 1 (0.41%) Go
11 1 (0.41%) Kusto Query Language
11 1 (0.41%) Perl
11 1 (0.41%) PL/SQL
11 1 (0.41%) Shell Script
Qualifications
1 109 (44.67%) Degree
2 41 (16.80%) HNC
2 41 (16.80%) HND
3 38 (15.57%) DBS Check
4 29 (11.89%) Master's Degree
5 19 (7.79%) Computer Science Degree
6 15 (6.15%) Cisco Certification
7 14 (5.74%) (ISC)2 CCSP
7 14 (5.74%) CEH
7 14 (5.74%) CISA
7 14 (5.74%) CISM
7 14 (5.74%) CISSP
8 6 (2.46%) ACCA
8 6 (2.46%) BPSS Clearance
8 6 (2.46%) CIMA
9 5 (2.05%) Security Cleared
10 4 (1.64%) Microsoft Certification
10 4 (1.64%) PMP
11 3 (1.23%) Azure Certification
11 3 (1.23%) ITIL Foundation Certificate
Quality Assurance & Compliance
1 15 (6.15%) GDPR
1 15 (6.15%) ISO/IEC 27001
2 14 (5.74%) NIST
3 12 (4.92%) QA
4 9 (3.69%) SLA
5 7 (2.87%) Accessibility
6 6 (2.46%) GAAP
6 6 (2.46%) IEC 62304
6 6 (2.46%) IFRS
6 6 (2.46%) ISO 13485
7 4 (1.64%) Data Quality
8 1 (0.41%) NCSC
System Software
1 9 (3.69%) Active Directory
2 8 (3.28%) Docker
3 2 (0.82%) Firmware
3 2 (0.82%) VMware Infrastructure
4 1 (0.41%) Hyper-V
4 1 (0.41%) Virtual Desktop
4 1 (0.41%) Virtual Machines
4 1 (0.41%) XenApp
4 1 (0.41%) XenDesktop
Systems Management
1 12 (4.92%) Kubernetes
2 4 (1.64%) Ansible
2 4 (1.64%) Terraform
3 2 (0.82%) SCCM
4 1 (0.41%) cPanel
4 1 (0.41%) Packer
4 1 (0.41%) Prometheus
4 1 (0.41%) SCOM
Vendors
1 26 (10.66%) Microsoft
2 13 (5.33%) VMware
3 11 (4.51%) SAP
4 10 (4.10%) Broadcom
4 10 (4.10%) Symantec
5 8 (3.28%) Adobe
6 7 (2.87%) Oracle
7 6 (2.46%) Cognos
7 6 (2.46%) Infor
8 4 (1.64%) Bloomberg
8 4 (1.64%) ServiceNow
9 2 (0.82%) Atlassian
9 2 (0.82%) Fortinet
9 2 (0.82%) Sage
9 2 (0.82%) Splunk
10 1 (0.41%) AppDynamics
10 1 (0.41%) F5
10 1 (0.41%) Facebook
10 1 (0.41%) Nimble Storage
10 1 (0.41%) SolarWinds