Banking
UK

The table below looks at the prevalence of the term Banking in permanent job vacancies. Included is a benchmarking guide to the salaries offered in vacancies that cited Banking over the 6 months leading up to 26 July 2024, comparing them to the same period in the previous two years.

6 months to
26 Jul 2024
Same period 2023 Same period 2022
Rank 63 32 59
Rank change year-on-year -31 +27 +18
Permanent jobs citing Banking 3,290 5,702 10,017
As % of all permanent jobs advertised in the UK 3.64% 7.07% 5.72%
As % of the General category 6.37% 10.69% 8.47%
Number of salaries quoted 1,955 3,628 5,036
10th Percentile £52,200 £45,000 £42,604
25th Percentile £70,000 £56,219 £56,164
Median annual salary (50th Percentile) £90,000 £75,000 £73,449
Median % change year-on-year +20.00% +2.11% -2.07%
75th Percentile £122,500 £97,500 £95,000
90th Percentile £148,750 £130,000 £115,000
UK excluding London median annual salary £65,000 £65,000 £60,000
% change year-on-year - +8.33% +4.35%

All General Skills
UK

Banking falls under the General Skills category. For comparison with the information above, the following table provides summary statistics for all permanent job vacancies requiring common skills.

Permanent vacancies with a requirement for common skills 51,660 53,362 118,305
As % of all permanent jobs advertised in the UK 57.16% 66.13% 67.50%
Number of salaries quoted 31,702 33,264 55,108
10th Percentile £28,500 £32,350 £32,500
25th Percentile £37,500 £42,750 £43,000
Median annual salary (50th Percentile) £54,000 £60,000 £60,000
Median % change year-on-year -10.00% - +6.19%
75th Percentile £72,557 £80,000 £80,000
90th Percentile £95,000 £100,000 £98,750
UK excluding London median annual salary £47,557 £52,500 £50,000
% change year-on-year -9.42% +5.00% +5.26%

Banking
Job Vacancy Trend

Job postings citing Banking as a proportion of all IT jobs advertised.
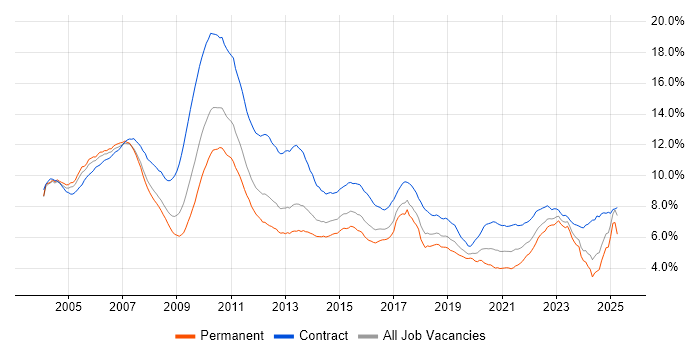
Job vacancy trend for Banking in the UK

Banking
Salary Trend

3-month moving average salary quoted in jobs citing Banking.

Salary trend for Banking in the UK

Banking
Salary Histogram

Salary distribution for jobs citing Banking over the 6 months to 26 July 2024.

Salary histogram for Banking in the UK

Banking
Top 17 Job Locations

The table below looks at the demand and provides a guide to the median salaries quoted in IT jobs citing Banking within the UK over the 6 months to 26 July 2024. The 'Rank Change' column provides an indication of the change in demand within each location based on the same 6 month period last year.

Location Rank Change
on Same Period
Last Year
Matching
Permanent
IT Job Ads
Median Salary
Past 6 Months
Median Salary
% Change
on Same Period
Last Year
Live
Jobs
England -29 2,805 £90,000 +19.12% 333
London 0 1,993 £100,000 +17.65% 210
UK excluding London -88 1,236 £65,000 - 224
Work from Home -32 1,187 £110,000 +55.83% 134
Scotland -31 417 £72,500 +10.94% 21
South West -24 341 £61,887 -0.98% 19
North of England -114 254 £57,500 -11.54% 65
North West -112 120 £52,500 -14.63% 29
Midlands -96 118 £60,000 - 31
Yorkshire -85 92 £68,262 +4.45% 18
South East -112 71 £60,000 -7.69% 68
West Midlands -62 66 £55,000 -8.33% 28
East Midlands -68 50 £70,000 +30.23% 3
North East +29 42 £42,500 -32.00% 18
East of England -44 22 £50,000 -23.08% 3
Northern Ireland -14 12 £57,500 -17.86% 17
Wales -45 11 £38,500 -29.85%

Banking
Co-occurring Skills and Capabilities by Category

The follow tables expand on the table above by listing co-occurrences grouped by category. The same employment type, locality and period is covered with up to 20 co-occurrences shown in each of the following categories:

Application Platforms
1 632 (19.21%) Apache
2 624 (18.97%) Apache Airflow
3 106 (3.22%) SharePoint
4 71 (2.16%) Confluence
5 70 (2.13%) SAS
6 55 (1.67%) Microsoft Exchange
7 22 (0.67%) GemFire
8 17 (0.52%) Cloud Foundry
9 13 (0.40%) Apache Spark
10 8 (0.24%) Tomcat
11 7 (0.21%) CMS
11 7 (0.21%) JBoss
11 7 (0.21%) nginx
12 6 (0.18%) IIS
13 4 (0.12%) WebLogic
13 4 (0.12%) WebSphere
14 3 (0.091%) Adobe Experience Manager
14 3 (0.091%) WildFly
15 2 (0.061%) Exchange Server 2010
15 2 (0.061%) Oracle SOA Suite
Applications
1 183 (5.56%) Microsoft Excel
2 78 (2.37%) Microsoft PowerPoint
3 77 (2.34%) Microsoft Office
4 19 (0.58%) MS Visio
5 4 (0.12%) Microsoft Project
6 3 (0.091%) Spreadsheet
7 2 (0.061%) Adobe Illustrator
7 2 (0.061%) Photoshop
8 1 (0.030%) Adobe Creative Suite
8 1 (0.030%) Camtasia
8 1 (0.030%) InDesign
8 1 (0.030%) Sketch
8 1 (0.030%) Trello
Business Applications
1 39 (1.19%) Aladdin
2 30 (0.91%) Ripple
3 12 (0.36%) Temenos T24
4 11 (0.33%) Fidessa
4 11 (0.33%) SAP S/4HANA
5 10 (0.30%) SAP FI
5 10 (0.30%) Teamcenter
6 9 (0.27%) SAP CO
6 9 (0.27%) SAP FI/CO
7 7 (0.21%) Oracle Cash Management
8 6 (0.18%) NetSuite
8 6 (0.18%) Postilion
9 5 (0.15%) FLEXCUBE
9 5 (0.15%) SAP BPC
10 4 (0.12%) Dynamics CRM
10 4 (0.12%) Eagle PACE
10 4 (0.12%) Finacle
10 4 (0.12%) Markit EDM
11 3 (0.091%) Unit4 Business World
12 2 (0.061%) Maximo
Cloud Services
1 1,199 (36.44%) AWS
2 584 (17.75%) GCP
3 559 (16.99%) dbt
4 474 (14.41%) Snowflake
5 396 (12.04%) Azure
6 198 (6.02%) Power Platform
7 102 (3.10%) Amazon EKS
8 84 (2.55%) Amazon EC2
9 78 (2.37%) Amazon ECS
10 70 (2.13%) SaaS
11 67 (2.04%) Entra ID
12 50 (1.52%) GitHub
13 49 (1.49%) Microsoft 365
14 30 (0.91%) Dagster
14 30 (0.91%) Dynamics 365
14 30 (0.91%) Serverless
15 27 (0.82%) Power Automate
16 26 (0.79%) OpenShift
17 25 (0.76%) Google Play
18 20 (0.61%) AWS Lambda
Communications & Networking
1 54 (1.64%) Firewall
2 31 (0.94%) DNS
3 23 (0.70%) DHCP
3 23 (0.70%) Remote Desktop
3 23 (0.70%) TCP/IP
4 17 (0.52%) WAN
5 16 (0.49%) LAN
6 15 (0.46%) VPN
7 13 (0.40%) Internet
8 10 (0.30%) FIX Connectivity
9 9 (0.27%) VLAN
10 8 (0.24%) SMTP
10 8 (0.24%) Wireless
11 6 (0.18%) ATM
11 6 (0.18%) Cisco ASA
11 6 (0.18%) FTP
11 6 (0.18%) SNMP
11 6 (0.18%) SSL
11 6 (0.18%) VoIP
12 5 (0.15%) Ethernet
Database & Business Intelligence
1 582 (17.69%) Apache Ignite
2 559 (16.99%) Dremio
3 556 (16.90%) Data Lake
4 530 (16.11%) Apache Arrow
5 529 (16.08%) Amazon Athena
6 182 (5.53%) Power BI
7 115 (3.50%) PostgreSQL
8 89 (2.71%) SQL Server
9 85 (2.58%) Tableau
10 71 (2.16%) Big Data
11 55 (1.67%) Data Warehouse
12 50 (1.52%) MongoDB
12 50 (1.52%) NoSQL
13 46 (1.40%) Metadata
14 36 (1.09%) BigQuery
14 36 (1.09%) MySQL
14 36 (1.09%) Relational Database
15 34 (1.03%) Apache Cassandra
16 22 (0.67%) CockroachDB
16 22 (0.67%) Hazelcast
Development Applications
1 164 (4.98%) JIRA
2 140 (4.26%) Cypress.io
3 91 (2.77%) JUnit
4 69 (2.10%) Selenium
5 64 (1.95%) Jasmine
6 61 (1.85%) WebDriver
7 60 (1.82%) Karma Test Runner
7 60 (1.82%) Protractor
8 53 (1.61%) Jenkins
9 46 (1.40%) Git
10 44 (1.34%) Maven
11 33 (1.00%) GitLab
12 32 (0.97%) TeamCity
13 25 (0.76%) Android Studio
14 21 (0.64%) Cucumber
14 21 (0.64%) Jaeger
15 16 (0.49%) Oracle Forms
16 12 (0.36%) Artifactory
16 12 (0.36%) Snyk
17 9 (0.27%) SonarQube
General
1 2,614 (79.45%) Finance
2 1,268 (38.54%) Investment Banking
3 854 (25.96%) Front Office
4 758 (23.04%) Inclusion and Diversity
5 707 (21.49%) Law
6 645 (19.60%) Social Skills
7 389 (11.82%) Legal
8 378 (11.49%) Analytical Skills
9 181 (5.50%) Retail
10 175 (5.32%) Financial Institution
11 148 (4.50%) Retail Banking
12 97 (2.95%) Marketing
13 81 (2.46%) Presentation Skills
14 66 (2.01%) Publishing
15 48 (1.46%) Back Office
16 36 (1.09%) Private Banking
17 33 (1.00%) Organisational Skills
18 28 (0.85%) Games
19 26 (0.79%) Wholesale Banking
20 24 (0.73%) Prime Brokerage
Job Titles
1 733 (22.28%) Senior
2 732 (22.25%) Software Engineer
3 601 (18.27%) Analyst
4 484 (14.71%) Lead
5 464 (14.10%) Developer
6 386 (11.73%) Java Engineer
7 369 (11.22%) Java Software Engineer
8 364 (11.06%) Python Engineer
9 363 (11.03%) Architect
10 315 (9.57%) Python Software Engineer
11 244 (7.42%) AWS Engineer
12 223 (6.78%) AWS Software Engineer
13 219 (6.66%) Developer/Software Engineer
14 209 (6.35%) Lead Software Engineer
15 204 (6.20%) Senior Analyst
16 195 (5.93%) Solutions Architect
17 186 (5.65%) Senior Software Engineer
18 170 (5.17%) Python Developer
19 151 (4.59%) Java Developer
20 140 (4.26%) Lead Java Engineer
Libraries, Frameworks & Software Standards
1 596 (18.12%) gRPC
2 589 (17.90%) Protocol Buffers
3 514 (15.62%) Pandas
4 511 (15.53%) NumPy
4 511 (15.53%) SciPy
5 340 (10.33%) React
6 237 (7.20%) Spring
7 146 (4.44%) Kafka
8 134 (4.07%) HTML
8 134 (4.07%) Spring Boot
9 129 (3.92%) CSS
10 127 (3.86%) Redux
11 115 (3.50%) PySpark
12 109 (3.31%) AngularJS
13 104 (3.16%) Material-UI
14 82 (2.49%) JSON
15 80 (2.43%) .NET
15 80 (2.43%) Node.js
16 77 (2.34%) REST
17 73 (2.22%) Hibernate
Miscellaneous
1 714 (21.70%) Fixed Income
2 681 (20.70%) Hedge funds
3 638 (19.39%) Foreign Exchange (FX)
4 636 (19.33%) Equities
5 605 (18.39%) Derivative
6 176 (5.35%) Cloud Native
7 135 (4.10%) Product Ownership
8 120 (3.65%) Algorithms
9 115 (3.50%) Management Information System
10 98 (2.98%) Credit Risk
11 85 (2.58%) Data Structures
12 76 (2.31%) Data Centre
13 74 (2.25%) Onboarding
14 72 (2.19%) Pricing Data
15 66 (2.01%) Self-Motivation
16 54 (1.64%) Blog
16 54 (1.64%) Public Cloud
17 37 (1.12%) Blockchain
17 37 (1.12%) Mobile App
18 35 (1.06%) Replication
Operating Systems
1 205 (6.23%) Windows
2 198 (6.02%) Linux
3 76 (2.31%) Unix
4 59 (1.79%) Windows Server
5 58 (1.76%) Android
6 32 (0.97%) Red Hat Enterprise Linux
7 31 (0.94%) zOS
8 26 (0.79%) CentOS
9 22 (0.67%) Solaris
10 21 (0.64%) Apple iOS
10 21 (0.64%) Ubuntu
11 19 (0.58%) Windows 10
12 12 (0.36%) AIX
13 8 (0.24%) Mac OS
14 4 (0.12%) Oracle Linux
14 4 (0.12%) Windows Server 2012
14 4 (0.12%) Windows Server 2016
14 4 (0.12%) Windows Server 2019
14 4 (0.12%) Windows XP
15 3 (0.091%) Kali Linux
Processes & Methodologies
1 1,516 (46.08%) Agile
2 1,068 (32.46%) Software Engineering
3 894 (27.17%) Asset Management
4 559 (16.99%) Investment Management
5 442 (13.43%) Artificial Intelligence
6 420 (12.77%) Machine Learning
7 419 (12.74%) CI/CD
8 369 (11.22%) Problem-Solving
9 356 (10.82%) Analytics
10 336 (10.21%) SDLC
11 305 (9.27%) Coaching
12 293 (8.91%) Fintech
13 254 (7.72%) Continuous Improvement
14 252 (7.66%) Operational Stability
15 240 (7.29%) Data Management
16 239 (7.26%) Line Management
16 239 (7.26%) Risk Management
17 218 (6.63%) Roadmaps
18 211 (6.41%) Full Stack Development
19 206 (6.26%) DevOps
Programming Languages
1 1,029 (31.28%) Python
2 1,022 (31.06%) Java
3 759 (23.07%) JavaScript
4 696 (21.16%) TypeScript
5 635 (19.30%) SQL
6 144 (4.38%) PowerShell
7 102 (3.10%) C#
8 54 (1.64%) Bash
9 47 (1.43%) Kotlin
10 40 (1.22%) Groovy
11 39 (1.19%) Perl
12 34 (1.03%) Ruby
13 33 (1.00%) C++
14 32 (0.97%) Rust
15 30 (0.91%) Go
15 30 (0.91%) Solidity
16 28 (0.85%) Shell Script
17 24 (0.73%) T-SQL
18 18 (0.55%) Scala
19 12 (0.36%) R
Qualifications
1 368 (11.19%) Degree
2 66 (2.01%) Computer Science Degree
3 60 (1.82%) Master's Degree
4 53 (1.61%) ACCA
5 39 (1.19%) CISSP
6 38 (1.16%) AWS Certification
7 26 (0.79%) Security Cleared
8 23 (0.70%) Azure Certification
9 19 (0.58%) CIMA
9 19 (0.58%) CISA
10 17 (0.52%) CISM
11 14 (0.43%) Microsoft Certification
11 14 (0.43%) SC Cleared
12 13 (0.40%) Cisco Certification
12 13 (0.40%) MBA
12 13 (0.40%) Numerate Degree
13 11 (0.33%) PMI Certification
14 9 (0.27%) GCIA
14 9 (0.27%) GCIH
14 9 (0.27%) PMP
Quality Assurance & Compliance
1 315 (9.57%) Data Quality
2 154 (4.68%) GDPR
3 73 (2.22%) IFRS
3 73 (2.22%) IFRS 9
4 60 (1.82%) QA
5 51 (1.55%) SLA
6 41 (1.25%) ISO/IEC 27001
7 25 (0.76%) Accessibility
8 23 (0.70%) NIST
9 22 (0.67%) PCI DSS
10 15 (0.46%) PMO
11 9 (0.27%) MiFID
12 8 (0.24%) COBIT
13 7 (0.21%) GRC
13 7 (0.21%) UCITS
14 6 (0.18%) ISO/IEC 27002 (supersedes ISO/IEC 17799)
14 6 (0.18%) ITGC
14 6 (0.18%) SEPA
15 5 (0.15%) SOC 2
15 5 (0.15%) TARGET2
System Software
1 118 (3.59%) Docker
2 99 (3.01%) Active Directory
3 52 (1.58%) VMware Infrastructure
4 50 (1.52%) RACF
5 29 (0.88%) XenApp
5 29 (0.88%) XenDesktop
6 10 (0.30%) Virtual Machines
7 6 (0.18%) Virtual Desktop
7 6 (0.18%) vSphere
8 5 (0.15%) HDFS
9 4 (0.12%) KVM
9 4 (0.12%) Xen
10 3 (0.091%) VMware ESXi
10 3 (0.091%) VMware NSX
11 2 (0.061%) Apache ZooKeeper
11 2 (0.061%) NFS
12 1 (0.030%) GridGain
12 1 (0.030%) Microsoft Virtual Server
12 1 (0.030%) Oracle RAC
12 1 (0.030%) Virtual Servers
Systems Management
1 183 (5.56%) Kubernetes
2 124 (3.77%) Terraform
3 69 (2.10%) Ansible
4 63 (1.91%) Grafana
5 33 (1.00%) Prometheus
6 23 (0.70%) Kibana
7 22 (0.67%) ITRS Geneos
7 22 (0.67%) Puppet
8 21 (0.64%) HAProxy
8 21 (0.64%) Zipkin
9 20 (0.61%) SCCM
10 18 (0.55%) Single Sign-On
11 17 (0.52%) Istio
12 13 (0.40%) Red Hat Satellite
13 12 (0.36%) Graphite
14 8 (0.24%) Progress Chef
15 7 (0.21%) Nessus
16 6 (0.18%) logstash
16 6 (0.18%) Microsoft Intune
17 5 (0.15%) Nagios
Vendors
1 331 (10.06%) Microsoft
2 181 (5.50%) Google
3 136 (4.13%) Oracle
4 124 (3.77%) Bloomberg
5 76 (2.31%) Reuters
6 71 (2.16%) ServiceNow
7 70 (2.13%) CyberArk
7 70 (2.13%) Red Hat
8 69 (2.10%) VMware
9 68 (2.07%) Citrix
10 52 (1.58%) Splunk
11 37 (1.12%) IBM
12 36 (1.09%) Salesforce
13 35 (1.06%) BISAM
14 34 (1.03%) Cisco
15 33 (1.00%) SAP
16 30 (0.91%) CA
17 29 (0.88%) Alteryx
18 28 (0.85%) Databricks
19 27 (0.82%) Dynatrace