Graphic Design Jobs in the UK excluding London

Graphic Design
UK > UK excluding London

The table below looks at the prevalence of the term Graphic Design in permanent job vacancies advertised in the UK excluding London. Included is a benchmarking guide to the salaries offered in vacancies that have cited Graphic Design over the 6 months to 12 May 2024 with a comparison to the same period over the previous 2 years.

6 months to
12 May 2024
Same period 2023 Same period 2022
Rank 595 707 735
Rank change year-on-year +112 +28 -120
Permanent jobs citing Graphic Design 167 48 117
As % of all permanent jobs advertised in the UK excluding London 0.24% 0.080% 0.16%
As % of the Miscellaneous category 0.70% 0.19% 0.38%
Number of salaries quoted 129 38 46
10th Percentile £22,250 £23,025 £22,750
25th Percentile £24,875 £25,688 £26,250
Median annual salary (50th Percentile) £28,500 £42,500 £40,000
Median % change year-on-year -32.94% +6.25% +10.34%
75th Percentile £40,000 £77,813 £52,500
90th Percentile £53,500 £81,250 £71,875
UK median annual salary £33,250 £50,000 £45,000
% change year-on-year -33.50% +11.11% -

All Generic Skills
UK excluding London

Graphic Design is in the General and Transferable Skills category. The following table is for comparison with the above and provides summary statistics for all permanent job vacancies advertised in the UK excluding London with a requirement for generic IT skills.

Permanent vacancies with a requirement for generic IT skills 24,019 24,656 31,077
As % of all permanent jobs advertised in the UK excluding London 33.83% 40.99% 43.71%
Number of salaries quoted 15,236 11,340 15,752
10th Percentile £26,250 £31,250 £30,000
25th Percentile £35,000 £40,250 £40,000
Median annual salary (50th Percentile) £50,000 £55,000 £52,500
Median % change year-on-year -9.09% +4.76% +5.00%
75th Percentile £65,000 £70,000 £68,750
90th Percentile £80,000 £85,000 £82,500
UK median annual salary £55,000 £65,000 £62,500
% change year-on-year -15.38% +4.00% +4.17%

Graphic Design
Job Vacancy Trend in the UK excluding London

Job postings citing Graphic Design as a proportion of all IT jobs advertised in the UK excluding London.
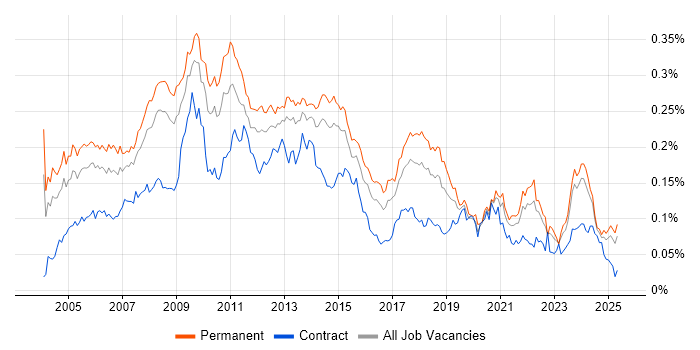
Job vacancy trend for Graphic Design in the UK excluding London

Graphic Design
Salary Trend in the UK excluding London

3-month moving average salary quoted in jobs citing Graphic Design in the UK excluding London.

Salary trend for Graphic Design in the UK excluding London

Graphic Design
Salary Histogram in the UK excluding London

Salary distribution for jobs citing Graphic Design in the UK excluding London over the 6 months to 12 May 2024.

Salary histogram for Graphic Design in the UK excluding London

Graphic Design
Job Locations in the UK excluding London

The table below looks at the demand and provides a guide to the median salaries quoted in IT jobs citing Graphic Design within the UK excluding London region over the 6 months to 12 May 2024. The 'Rank Change' column provides an indication of the change in demand within each location based on the same 6 month period last year.

Location Rank Change
on Same Period
Last Year
Matching
Permanent
IT Job Ads
Median Salary
Past 6 Months
Median Salary
% Change
on Same Period
Last Year
Live
Jobs
North of England +102 54 £27,500 -15.38% 15
Midlands +9 36 £30,750 -60.32% 7
South East +27 33 £28,500 +3.64% 8
North West +32 30 £32,500 +11.11% 10
Yorkshire +101 21 £22,500 -47.06% 2
East of England +33 20 £28,375 - 4
East Midlands +4 19 £37,500 +59.57% 5
West Midlands +23 17 £28,000 -63.87% 2
Scotland -41 13 £49,000 -6.67% 6
South West -20 8 £26,000 -25.71% 2
North East - 3 £30,000 - 3
Northern Ireland - 3 £37,500 -
Wales - 1 £34,000 -
Graphic Design
UK

Graphic Design
Co-occurring Skills and Capabilities in the UK excluding London by Category

The follow tables expand on the table above by listing co-occurrences grouped by category. The same employment type, locality and period is covered with up to 20 co-occurrences shown in each of the following categories:

Application Platforms
1 31 (18.56%) WordPress
2 20 (11.98%) CMS
3 11 (6.59%) SharePoint
4 1 (0.60%) IIS
Applications
1 59 (35.33%) Photoshop
2 51 (30.54%) Adobe Illustrator
3 48 (28.74%) InDesign
4 45 (26.95%) Adobe Creative Suite
5 22 (13.17%) Microsoft Office
6 13 (7.78%) Adobe After Effects
6 13 (7.78%) Microsoft PowerPoint
7 9 (5.39%) Adobe XD
7 9 (5.39%) Sketch
8 8 (4.79%) Adobe Premiere
9 4 (2.40%) Blender
9 4 (2.40%) CINEMA 4D
9 4 (2.40%) SketchUp
10 3 (1.80%) Adobe Captivate
10 3 (1.80%) InVision
10 3 (1.80%) Microsoft Excel
11 1 (0.60%) 3ds Max
11 1 (0.60%) AutoCAD
11 1 (0.60%) CorelDRAW
Business Applications
1 4 (2.40%) Magento
1 4 (2.40%) Shopify
2 1 (0.60%) WebTrends
Cloud Services
1 16 (9.58%) Adobe Creative Cloud
2 14 (8.38%) Figma
3 9 (5.39%) Google Analytics
4 6 (3.59%) Canva
5 5 (2.99%) Azure
5 5 (2.99%) ChatGPT
5 5 (2.99%) MailChimp
6 4 (2.40%) AWS
6 4 (2.40%) AWS CloudFormation
6 4 (2.40%) Serverless
7 2 (1.20%) SaaS
7 2 (1.20%) Squarespace
8 1 (0.60%) Google Docs
8 1 (0.60%) Google Workspace
8 1 (0.60%) Microsoft 365
8 1 (0.60%) Sage Pay
Communications & Networking
1 3 (1.80%) Intranet
2 1 (0.60%) Extranet
Database & Business Intelligence
1 4 (2.40%) DynamoDB
1 4 (2.40%) NoSQL
2 3 (1.80%) MySQL
3 2 (1.20%) Amazon Redshift
3 2 (1.20%) Relational Database
4 1 (0.60%) SQL Server
Development Applications
1 7 (4.19%) Git
2 2 (1.20%) Axure RP
2 2 (1.20%) Subversion
2 2 (1.20%) WiX
3 1 (0.60%) Cypress.io
3 1 (0.60%) Jasmine
3 1 (0.60%) Karma Test Runner
General
1 98 (58.68%) Marketing
2 55 (32.93%) Social Skills
3 16 (9.58%) Finance
3 16 (9.58%) Retail
4 13 (7.78%) Organisational Skills
5 12 (7.19%) Public Sector
6 9 (5.39%) Advertising
6 9 (5.39%) Publishing
7 6 (3.59%) Analytical Skills
7 6 (3.59%) Inclusion and Diversity
8 5 (2.99%) Multimedia
8 5 (2.99%) Presentation Skills
9 4 (2.40%) Law
10 3 (1.80%) Polish Language
11 2 (1.20%) Automotive
11 2 (1.20%) Games
11 2 (1.20%) Military
12 1 (0.60%) Agriculture
12 1 (0.60%) Brand Awareness
Job Titles
1 88 (52.69%) Designer
2 51 (30.54%) Graphic Designer
3 21 (12.57%) Digital Designer
4 18 (10.78%) Junior
5 14 (8.38%) Senior
5 14 (8.38%) Senior Designer
6 12 (7.19%) Coordinator
6 12 (7.19%) Project Coordinator
7 11 (6.59%) Developer
7 11 (6.59%) Junior Designer
8 8 (4.79%) Web Designer
9 7 (4.19%) Software Engineer
10 6 (3.59%) Author
10 6 (3.59%) Technical Author
10 6 (3.59%) Web Developer
11 5 (2.99%) Junior Graphic Designer
11 5 (2.99%) Senior Digital Designer
11 5 (2.99%) Senior Graphic Designer
12 4 (2.40%) Paid Search Manager
12 4 (2.40%) Search Manager
Libraries, Frameworks & Software Standards
1 23 (13.77%) CSS
2 21 (12.57%) HTML
3 7 (4.19%) .NET
4 6 (3.59%) React
5 4 (2.40%) .NET Core
5 4 (2.40%) AngularJS
5 4 (2.40%) Sass
5 4 (2.40%) Web Services
6 3 (1.80%) ASP.NET
6 3 (1.80%) EDI
6 3 (1.80%) LESS
6 3 (1.80%) Next.js
6 3 (1.80%) Twitter Bootstrap
7 2 (1.20%) ASP.NET Web Forms
7 2 (1.20%) CakePHP
7 2 (1.20%) HTML5
7 2 (1.20%) jQuery
7 2 (1.20%) Laravel
8 1 (0.60%) Spring
8 1 (0.60%) V-Ray
Miscellaneous
1 57 (34.13%) Social Media
2 22 (13.17%) Animation
3 14 (8.38%) Blog
4 11 (6.59%) Management Information System
4 11 (6.59%) Photography
5 9 (5.39%) Motion Graphics
6 7 (4.19%) Self-Motivation
7 5 (2.99%) Mobile App
8 4 (2.40%) Digital Media
8 4 (2.40%) e-Learning
8 4 (2.40%) Video Editing
9 3 (1.80%) Driving Licence
9 3 (1.80%) Enterprise Software
10 2 (1.20%) Equities
10 2 (1.20%) Life Science
10 2 (1.20%) Product Ownership
11 1 (0.60%) FMCG
11 1 (0.60%) NHS
11 1 (0.60%) Social Network
11 1 (0.60%) Virtual Reality
Operating Systems
1 4 (2.40%) Windows
2 2 (1.20%) Linux
Processes & Methodologies
1 37 (22.16%) User Experience
2 21 (12.57%) Digital Marketing
2 21 (12.57%) Project Management
3 20 (11.98%) Storyboarding
4 19 (11.38%) B2B
5 17 (10.18%) Content Management
5 17 (10.18%) Web Design
6 15 (8.98%) SEO
6 15 (8.98%) Typography
6 15 (8.98%) UX Design
7 14 (8.38%) Infographics
8 12 (7.19%) Value Proposition
9 11 (6.59%) Analytics
9 11 (6.59%) E-Commerce
9 11 (6.59%) User Research
10 10 (5.99%) 3D Modelling
10 10 (5.99%) Time Management
11 9 (5.39%) Functional Testing
11 9 (5.39%) Web Development
12 8 (4.79%) Problem-Solving
Programming Languages
1 16 (9.58%) JavaScript
2 8 (4.79%) PHP
3 7 (4.19%) C#
4 5 (2.99%) Go
4 5 (2.99%) TypeScript
5 1 (0.60%) C
5 1 (0.60%) Java
5 1 (0.60%) Kotlin
Qualifications
1 43 (25.75%) Degree
2 8 (4.79%) SC Cleared
2 8 (4.79%) Security Cleared
3 6 (3.59%) CTC Cleared
4 3 (1.80%) HND
4 3 (1.80%) Master's Degree
Quality Assurance & Compliance
1 11 (6.59%) PMO
2 10 (5.99%) Accessibility
3 3 (1.80%) GDPR
3 3 (1.80%) WCAG
4 1 (0.60%) QA
Systems Management
1 4 (2.40%) Terraform
Vendors
1 89 (53.29%) Adobe
2 14 (8.38%) Google
3 10 (5.99%) Microsoft
4 7 (4.19%) Instagram
5 4 (2.40%) Twitter
5 4 (2.40%) WooCommerce
6 3 (1.80%) Facebook
7 2 (1.20%) TikTok
8 1 (0.60%) Apple
8 1 (0.60%) HubSpot
8 1 (0.60%) Quark