Retail Jobs in the UK excluding London

Retailing
UK > UK excluding London

The table below looks at the prevalence of the term Retail in permanent job vacancies advertised in the UK excluding London. Included is a benchmarking guide to the salaries offered in vacancies that have cited Retail over the 6 months to 2 December 2023 with a comparison to the same period over the previous 2 years.
6 months to
2 Dec 2023
Same period 2022 Same period 2021
Rank 40 48 36
Rank change year-on-year +8 -12 +96
Permanent jobs citing Retail 1,940 4,045 4,722
As % of all permanent jobs advertised in the UK excluding London 6.14% 6.04% 7.19%
As % of the General category 9.56% 8.99% 12.60%
Number of salaries quoted 1,542 2,163 1,937
10th Percentile £25,000 £31,500 £28,750
25th Percentile £26,500 £41,250 £37,250
Median annual salary (50th Percentile) £42,500 £55,000 £50,000
Median % change year-on-year -22.73% +10.00% +11.11%
75th Percentile £61,459 £72,647 £65,000
90th Percentile £77,715 £87,500 £77,500
UK median annual salary £52,108 £61,180 £57,500
% change year-on-year -14.83% +6.40% -

All General Skills
UK excluding London

Retail is in the General Skills category. The following table is for comparison with the above and provides summary statistics for all permanent job vacancies advertised in the UK excluding London with a requirement for common skills.

Permanent vacancies with a requirement for common skills 20,301 44,972 37,475
As % of all permanent jobs advertised in the UK excluding London 64.24% 67.20% 57.09%
Number of salaries quoted 13,407 23,144 23,038
10th Percentile £26,500 £29,000 £27,500
25th Percentile £36,250 £37,750 £36,250
Median annual salary (50th Percentile) £50,000 £52,500 £49,500
Median % change year-on-year -4.76% +6.06% +4.21%
75th Percentile £67,500 £67,500 £63,750
90th Percentile £82,500 £82,500 £77,500
UK median annual salary £60,000 £60,000 £57,500
% change year-on-year - +4.35% +4.55%

Retail
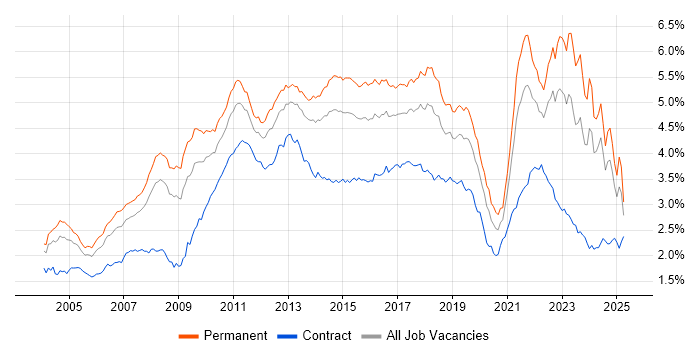
Job Vacancy Trend in the UK excluding London

Job postings citing Retail as a proportion of all IT jobs advertised in the UK excluding London.

Job vacancy trend for Retail in the UK excluding London

Retail
Salary Trend in the UK excluding London

3-month moving average salary quoted in jobs citing Retail in the UK excluding London.

Salary trend for Retail in the UK excluding London

Retail
Salary Histogram in the UK excluding London

Salary distribution for jobs citing Retail in the UK excluding London over the 6 months to 2 December 2023.

Salary histogram for Retail in the UK excluding London

Retail
Job Locations in the UK excluding London

The table below looks at the demand and provides a guide to the median salaries quoted in IT jobs citing Retail within the UK excluding London region over the 6 months to 2 December 2023. The 'Rank Change' column provides an indication of the change in demand within each location based on the same 6 month period last year.

Location Rank Change
on Same Period
Last Year
Matching
Permanent
IT Job Ads
Median Salary
Past 6 Months
Median Salary
% Change
on Same Period
Last Year
Live
Jobs
North of England -6 543 £51,514 -6.34% 468
Midlands +33 358 £34,642 -35.85% 305
Scotland +38 335 £25,000 -59.32% 127
South West +4 297 £47,557 -4.89% 183
Yorkshire -12 279 £51,528 -6.31% 169
South East -25 234 £52,500 +0.96% 336
North West -12 226 £55,000 +4.76% 257
West Midlands +46 217 £32,500 -43.48% 161
East Midlands +12 138 £38,000 -26.21% 143
East of England +10 90 £45,000 -21.74% 138
Wales +22 83 £34,000 -37.61% 52
North East +29 38 £32,313 -53.84% 51
Northern Ireland +37 23 £63,750 +45.71% 29
Retail
UK

Retail
Co-occurring Skills and Capabilities in the UK excluding London by Category

The follow tables expand on the table above by listing co-occurrences grouped by category. The same employment type, locality and period is covered with up to 20 co-occurrences shown in each of the following categories:

Application Platforms
1 53 (2.73%) Confluence
2 42 (2.16%) SAS
3 32 (1.65%) Apache Spark
4 29 (1.49%) Apache
5 23 (1.19%) SharePoint
6 13 (0.67%) Jetty
6 13 (0.67%) Tomcat
7 12 (0.62%) CMS
8 10 (0.52%) Oracle Application Server
9 9 (0.46%) MS Exchange
10 5 (0.26%) WebSphere
10 5 (0.26%) WebSphere Application Server
10 5 (0.26%) WordPress
11 4 (0.21%) OpenStack
12 3 (0.15%) Umbraco
13 2 (0.10%) Adobe Experience Manager
14 1 (0.052%) Apache Solr
14 1 (0.052%) ColdFusion
14 1 (0.052%) Moodle
14 1 (0.052%) Sitecore CMS
Applications
1 131 (6.75%) Microsoft Excel
2 118 (6.08%) Microsoft Office
3 23 (1.19%) Microsoft PowerPoint
4 8 (0.41%) Microsoft Project
5 4 (0.21%) InDesign
5 4 (0.21%) Photoshop
5 4 (0.21%) Spreadsheet
5 4 (0.21%) SPSS
6 3 (0.15%) Adobe Creative Suite
6 3 (0.15%) Adobe Illustrator
7 2 (0.10%) EViews
7 2 (0.10%) InfoPath
8 1 (0.052%) Autodesk Inventor
8 1 (0.052%) Siemens NX
8 1 (0.052%) Sketch
8 1 (0.052%) SOLIDWORKS
8 1 (0.052%) Trello
Business Applications
1 19 (0.98%) SAP S/4HANA
2 14 (0.72%) Payment Gateway
3 11 (0.57%) Dynamics AX
4 10 (0.52%) SAP Retail
5 9 (0.46%) Dynamics NAV
6 8 (0.41%) SAP CO
6 8 (0.41%) SAP FI
6 8 (0.41%) SAP FI/CO
7 6 (0.31%) Dynamics CRM
7 6 (0.31%) Epicor Tropos
8 5 (0.26%) Dynamics GP
8 5 (0.26%) SAP MDG
9 4 (0.21%) Teamcenter
10 3 (0.15%) Magento
10 3 (0.15%) Sage X3
10 3 (0.15%) SAP MM
10 3 (0.15%) SAP SD
11 2 (0.10%) IBM Planning Analytics
11 2 (0.10%) SAP CS
11 2 (0.10%) Shopify
Cloud Services
1 256 (13.20%) Azure
2 183 (9.43%) Power Platform
3 164 (8.45%) AWS
4 117 (6.03%) GCP
5 108 (5.57%) Microsoft 365
6 82 (4.23%) SaaS
7 72 (3.71%) PaaS
8 50 (2.58%) IaaS
9 44 (2.27%) Serverless
10 42 (2.16%) Azure DevOps
11 39 (2.01%) GitHub
12 27 (1.39%) Entra ID
13 23 (1.19%) Dynamics 365
14 21 (1.08%) Google Analytics
15 17 (0.88%) GitHub Actions
16 15 (0.77%) Cloud Computing
17 13 (0.67%) AWS Direct Connect
17 13 (0.67%) Azure ExpressRoute
17 13 (0.67%) Snowflake
18 12 (0.62%) Vertex AI
Communications & Networking
1 357 (18.40%) Broadband
2 67 (3.45%) Firewall
3 40 (2.06%) WAN
4 28 (1.44%) Internet
5 27 (1.39%) DNS
5 27 (1.39%) SD-WAN
6 26 (1.34%) F5 BIG-IP GTM
6 26 (1.34%) F5 BIG-IP LTM
7 24 (1.24%) VPN
8 22 (1.13%) TCP/IP
9 21 (1.08%) 5G
10 20 (1.03%) DHCP
10 20 (1.03%) Network Security
10 20 (1.03%) Wi-Fi
11 19 (0.98%) LAN
12 13 (0.67%) SAN
13 7 (0.36%) BGP
13 7 (0.36%) NGFW
13 7 (0.36%) OSPF
13 7 (0.36%) Remote Desktop
Database & Business Intelligence
1 171 (8.81%) Power BI
2 104 (5.36%) Data Warehouse
3 89 (4.59%) SQL Server
4 85 (4.38%) NoSQL
5 57 (2.94%) Data Lake
6 56 (2.89%) Big Data
6 56 (2.89%) MySQL
7 39 (2.01%) SQL Server Integration Services
7 39 (2.01%) Tableau
8 37 (1.91%) SQL Server Reporting Services
9 36 (1.86%) PostgreSQL
10 31 (1.60%) Relational Database
11 18 (0.93%) BigQuery
12 16 (0.82%) Hadoop
13 14 (0.72%) MS Access
14 13 (0.67%) Data Mart
14 13 (0.67%) Looker
14 13 (0.67%) RDBMS
15 12 (0.62%) Oracle BI EE
16 10 (0.52%) Bigtable
Development Applications
1 78 (4.02%) Git
2 74 (3.81%) JIRA
3 39 (2.01%) Jenkins
4 22 (1.13%) Visual Studio
5 18 (0.93%) Spinnaker
6 15 (0.77%) Selenium
7 13 (0.67%) Oracle Forms
8 12 (0.62%) SonarQube
9 11 (0.57%) Cucumber
9 11 (0.57%) Maven
10 10 (0.52%) Cypress.io
11 8 (0.41%) LabVIEW
11 8 (0.41%) Postman
12 7 (0.36%) GitLab
12 7 (0.36%) JUnit
12 7 (0.36%) SpecFlow
13 6 (0.31%) IBM UrbanCode
13 6 (0.31%) JMeter
13 6 (0.31%) Sonatype Nexus
14 5 (0.26%) LoadRunner
General
1 936 (48.25%) Social Skills
2 576 (29.69%) Finance
3 387 (19.95%) Telecoms
4 362 (18.66%) Local Government
5 336 (17.32%) Banking
6 320 (16.49%) Games
7 318 (16.39%) Analytical Skills
8 174 (8.97%) Marketing
9 121 (6.24%) Inclusion and Diversity
10 99 (5.10%) Presentation Skills
11 66 (3.40%) Legal
12 58 (2.99%) Manufacturing
13 37 (1.91%) Influencing Skills
14 35 (1.80%) Retail Banking
15 32 (1.65%) Organisational Skills
16 31 (1.60%) Automotive
17 26 (1.34%) Public Sector
18 24 (1.24%) Retail Finance
19 23 (1.19%) Aerospace
20 20 (1.03%) Back Office
Job Titles
1 294 (15.15%) Analyst
2 287 (14.79%) Senior
3 215 (11.08%) Consultant
4 200 (10.31%) Development Manager
5 197 (10.15%) Business Manager
6 187 (9.64%) Business Development Manager
7 177 (9.12%) Enterprise Consultant
8 167 (8.61%) Architect
9 150 (7.73%) Developer
10 131 (6.75%) Lead
11 91 (4.69%) Solutions Architect
12 63 (3.25%) Senior Analyst
13 60 (3.09%) Software Engineer
14 56 (2.89%) IT Engineer
15 54 (2.78%) Junior
15 54 (2.78%) Support Engineer
16 51 (2.63%) Business Analyst
16 51 (2.63%) DevOps Engineer
17 50 (2.58%) IT Manager
18 48 (2.47%) Data Analyst
Libraries, Frameworks & Software Standards
1 97 (5.00%) HTML
2 82 (4.23%) .NET
3 72 (3.71%) CSS
4 55 (2.84%) OpenID
5 50 (2.58%) React
5 50 (2.58%) RESTful
6 46 (2.37%) Web Services
7 35 (1.80%) Kafka
7 35 (1.80%) Node.js
8 28 (1.44%) jQuery
9 26 (1.34%) Spine.js
9 26 (1.34%) Spring Boot
10 25 (1.29%) XML
11 24 (1.24%) AngularJS
11 24 (1.24%) JSON
12 23 (1.19%) Spring
13 20 (1.03%) .NET Core
13 20 (1.03%) CSS3
14 19 (0.98%) OAuth
15 17 (0.88%) Laravel
Miscellaneous
1 105 (5.41%) Product Ownership
2 87 (4.48%) Cloud Native
3 73 (3.76%) Self-Motivation
4 49 (2.53%) Management Information System
5 48 (2.47%) Data Centre
6 46 (2.37%) Public Cloud
7 45 (2.32%) EPoS
8 42 (2.16%) Mainframe
9 39 (2.01%) Blockchain
10 38 (1.96%) Credit Risk
11 34 (1.75%) Data Structures
12 28 (1.44%) NHS
13 24 (1.24%) Analytical Mindset
14 23 (1.19%) FMCG
15 21 (1.08%) Driving Licence
15 21 (1.08%) Hybrid Cloud
16 18 (0.93%) Greenfield Project
17 16 (0.82%) GNSS
18 15 (0.77%) IoT
18 15 (0.77%) Life Science
Operating Systems
1 162 (8.35%) Windows
2 80 (4.12%) Linux
3 76 (3.92%) Unix
4 52 (2.68%) Windows Server
5 49 (2.53%) Android
6 21 (1.08%) Windows 10
7 17 (0.88%) Apple iOS
8 13 (0.67%) AIX
9 7 (0.36%) Mac OS
9 7 (0.36%) Windows Server 2008
10 6 (0.31%) Windows 7
11 4 (0.21%) Windows XP
12 3 (0.15%) Debian
12 3 (0.15%) Windows Server 2019
13 2 (0.10%) Windows Server 2016
14 1 (0.052%) Embedded Linux
14 1 (0.052%) Red Hat Enterprise Linux
14 1 (0.052%) Solaris
14 1 (0.052%) Ubuntu
14 1 (0.052%) Windows 8
Processes & Methodologies
1 583 (30.05%) Agile
2 489 (25.21%) Decision-Making
3 438 (22.58%) Collaborative Working
4 416 (21.44%) Customer Experience
5 393 (20.26%) B2B
6 373 (19.23%) B2C
7 339 (17.47%) Problem-Solving
8 285 (14.69%) Analytics
9 208 (10.72%) Customer Service
10 205 (10.57%) DevOps
11 199 (10.26%) Business Development
12 197 (10.15%) Business Intelligence
13 166 (8.56%) CI/CD
14 165 (8.51%) Roadmaps
15 158 (8.14%) Stakeholder Management
16 147 (7.58%) Microservices
17 142 (7.32%) Mentoring
18 131 (6.75%) Project Management
19 124 (6.39%) Risk Management
20 123 (6.34%) Cybersecurity
Programming Languages
1 260 (13.40%) SQL
2 182 (9.38%) Python
3 127 (6.55%) JavaScript
4 98 (5.05%) Java
5 87 (4.48%) C#
6 43 (2.22%) PowerShell
7 38 (1.96%) PHP
8 34 (1.75%) TypeScript
9 23 (1.19%) R
10 22 (1.13%) Bash
11 17 (0.88%) PL/SQL
12 15 (0.77%) T-SQL
12 15 (0.77%) VBA
13 14 (0.72%) MATLAB
14 13 (0.67%) C++
15 12 (0.62%) Groovy
16 10 (0.52%) Bicep
17 9 (0.46%) Ruby
18 8 (0.41%) C
19 7 (0.36%) Scala
Qualifications
1 194 (10.00%) Degree
2 108 (5.57%) Security Cleared
3 60 (3.09%) SC Cleared
4 35 (1.80%) DBS Check
5 22 (1.13%) PMI Certification
6 20 (1.03%) AWS Certification
7 17 (0.88%) CISMP
8 15 (0.77%) ITIL Certification
9 13 (0.67%) Master's Degree
10 12 (0.62%) Computer Science Degree
10 12 (0.62%) PMP
11 11 (0.57%) ACCA
11 11 (0.57%) CIMA
11 11 (0.57%) Cisco Certification
12 9 (0.46%) Azure Certification
12 9 (0.46%) CISM
12 9 (0.46%) HND
13 8 (0.41%) AAT
13 8 (0.41%) CISSP
13 8 (0.41%) Microsoft Certification
Quality Assurance & Compliance
1 51 (2.63%) QA
2 38 (1.96%) SLA
3 25 (1.29%) GRC
4 23 (1.19%) Data Quality
5 20 (1.03%) IFRS
5 20 (1.03%) ISO/IEC 27001
6 19 (0.98%) PMO
7 18 (0.93%) IFRS 9
8 16 (0.82%) Accessibility
8 16 (0.82%) PCI DSS
9 15 (0.77%) GDPR
10 14 (0.72%) CRD IV
11 13 (0.67%) NIST
12 12 (0.62%) Actionable Recommendations
13 7 (0.36%) Cyber Essentials
14 6 (0.31%) NCSC
15 5 (0.26%) GxP
15 5 (0.26%) ISO 9001
16 4 (0.21%) ISO/IEC 27005
17 3 (0.15%) ISO 22301
System Software
1 97 (5.00%) Active Directory
2 74 (3.81%) Docker
3 32 (1.65%) VMware Infrastructure
4 16 (0.82%) Hyper-V
5 11 (0.57%) Virtual Machines
6 8 (0.41%) vSphere
6 8 (0.41%) XenApp
7 7 (0.36%) BitLocker
8 4 (0.21%) Firmware
8 4 (0.21%) XenDesktop
9 3 (0.15%) VMware NSX
10 1 (0.052%) KVM
10 1 (0.052%) QEMU
Systems Management
1 117 (6.03%) Kubernetes
2 105 (5.41%) Terraform
3 41 (2.11%) Ansible
4 35 (1.80%) SCCM
5 30 (1.55%) Microsoft Intune
6 23 (1.19%) Istio
7 14 (0.72%) SCOM
8 11 (0.57%) Failover Clustering
9 6 (0.31%) Single Sign-On
10 5 (0.26%) CSIRT
10 5 (0.26%) FortiGate
11 4 (0.21%) Argo
11 4 (0.21%) Microsoft Clustering
12 2 (0.10%) cPanel
12 2 (0.10%) Grafana
12 2 (0.10%) Puppet
12 2 (0.10%) SysTrack
13 1 (0.052%) Salt
13 1 (0.052%) Systems Management Server (SMS)
13 1 (0.052%) WSUS
Vendors
1 354 (18.25%) BT
2 349 (17.99%) Microsoft
3 77 (3.97%) Google
4 56 (2.89%) SAP
5 54 (2.78%) Cisco
5 54 (2.78%) Oracle
6 48 (2.47%) ServiceNow
7 40 (2.06%) VMware
8 29 (1.49%) Salesforce
9 28 (1.44%) Teradata
10 27 (1.39%) Fortinet
11 26 (1.34%) CheckPoint
11 26 (1.34%) Citrix
11 26 (1.34%) F5
12 24 (1.24%) IBM
13 19 (0.98%) Adobe
14 18 (0.93%) HP
15 13 (0.67%) Dell
16 12 (0.62%) Databricks
17 10 (0.52%) iManage