Accessibility Jobs in the UK excluding London

Accessibility (a11y)
UK > UK excluding London

The table below provides summary statistics for permanent job vacancies advertised in the UK excluding London requiring Accessibility skills. It includes a benchmarking guide to the annual salaries offered in vacancies that cited Accessibility over the 6 months leading up to 26 April 2025, comparing them to the same period in the previous two years.

6 months to
26 Apr 2025
Same period 2024 Same period 2023
Rank 216 285 264
Rank change year-on-year +69 -21 0
Permanent jobs citing Accessibility 429 689 790
As % of all permanent jobs advertised in the UK excluding London 1.18% 0.98% 1.27%
As % of the Quality Assurance & Compliance category 6.93% 7.20% 6.05%
Number of salaries quoted 174 387 251
10th Percentile £31,250 £29,750 £34,000
25th Percentile £40,155 £36,250 £42,750
Median annual salary (50th Percentile) £55,000 £50,000 £54,882
Median % change year-on-year +10.00% -8.90% +21.91%
75th Percentile £70,000 £60,741 £67,500
90th Percentile £93,500 £72,500 £80,000
UK median annual salary £57,500 £52,500 £57,500
% change year-on-year +9.52% -8.70% +8.49%

All Quality Assurance and Compliance Skills
UK excluding London

Accessibility falls under the Quality Assurance and Compliance category. For comparison with the information above, the following table provides summary statistics for all permanent job vacancies requiring quality assurance or compliance skills in the UK excluding London.

Permanent vacancies with a requirement for quality assurance or compliance skills 6,194 9,571 13,062
As % of all permanent jobs advertised in the UK excluding London 17.07% 13.66% 21.05%
Number of salaries quoted 3,019 6,367 4,770
10th Percentile £29,750 £25,750 £28,750
25th Percentile £40,000 £32,500 £37,500
Median annual salary (50th Percentile) £55,000 £47,500 £50,000
Median % change year-on-year +15.79% -5.00% +5.26%
75th Percentile £67,500 £62,500 £66,250
90th Percentile £80,000 £77,500 £80,000
UK median annual salary £60,000 £52,500 £57,500
% change year-on-year +14.29% -8.70% +4.55%

Accessibility
Job Vacancy Trend in the UK excluding London

Job postings citing Accessibility as a proportion of all IT jobs advertised in the UK excluding London.
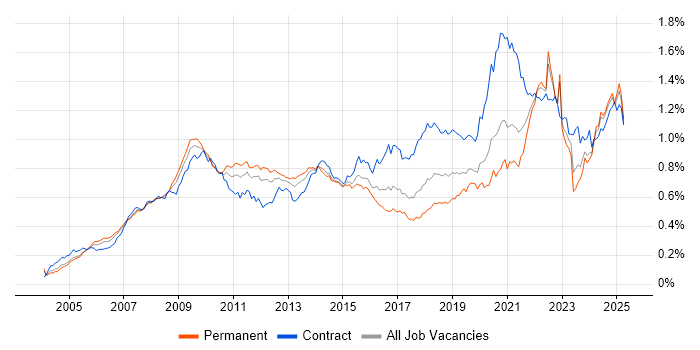
Job vacancy trend for Accessibility in the UK excluding London

Accessibility
Salary Trend in the UK excluding London

3-month moving average salary quoted in jobs citing Accessibility in the UK excluding London.

Salary trend for Accessibility in the UK excluding London

Accessibility
Salary Histogram in the UK excluding London

Salary distribution for jobs citing Accessibility in the UK excluding London over the 6 months to 26 April 2025.

Salary histogram for Accessibility in the UK excluding London

Accessibility
Job Locations in the UK excluding London

The table below looks at the demand and provides a guide to the median salaries quoted in IT jobs citing Accessibility within the UK excluding London region over the 6 months to 26 April 2025. The 'Rank Change' column provides an indication of the change in demand within each location based on the same 6 month period last year.

Location Rank Change
on Same Period
Last Year
Matching
Permanent
IT Job Ads
Median Salary
Past 6 Months
Median Salary
% Change
on Same Period
Last Year
Live
Jobs
South East +144 158 £50,000 +25.00% 150
North of England -10 111 £42,134 -27.31% 175
North West +1 88 £37,000 -35.65% 99
South West +131 60 £66,367 +32.07% 59
Midlands -2 47 £50,000 - 67
Scotland +56 37 £92,500 +48.00% 45
West Midlands +20 35 £57,500 -1.51% 38
Yorkshire +27 22 £55,000 +4.76% 57
East Midlands +33 12 £42,500 +6.25% 26
Wales +36 8 £80,000 +43.11% 20
East of England +30 6 £63,750 +84.78% 62
Isle of Man - 4 - -
North East +20 1 £65,000 +12.14% 23
Accessibility
UK

Accessibility
Co-occurring Skills and Capabilities in the UK excluding London by Category

The follow tables expand on the table above by listing co-occurrences grouped by category. The same employment type, locality and period is covered with up to 20 co-occurrences shown in each of the following categories:

Application Platforms
1 47 (10.96%) CMS
2 26 (6.06%) Umbraco
3 15 (3.50%) Apache
3 15 (3.50%) Apache Spark
4 14 (3.26%) WordPress
5 11 (2.56%) Apache Airflow
6 7 (1.63%) Confluence
7 3 (0.70%) Drupal
7 3 (0.70%) GemFire
8 2 (0.47%) Adobe Experience Manager
8 2 (0.47%) ArcGIS
8 2 (0.47%) ColdFusion
8 2 (0.47%) IBM Domino
8 2 (0.47%) Jadu
9 1 (0.23%) EPiServer
9 1 (0.23%) IIS
Applications
1 8 (1.86%) Microsoft Office
2 6 (1.40%) Adobe Illustrator
2 6 (1.40%) Microsoft Excel
2 6 (1.40%) Photoshop
3 5 (1.17%) Microsoft PowerPoint
4 4 (0.93%) Adobe Creative Suite
4 4 (0.93%) Adobe Premiere
4 4 (0.93%) Sketch
5 3 (0.70%) Adobe XD
5 3 (0.70%) Chatbot
6 2 (0.47%) MS Visio
7 1 (0.23%) Microsoft Project
7 1 (0.23%) Zeplin
Business Applications
1 39 (9.09%) NEC Housing
2 6 (1.40%) Endur
3 5 (1.17%) Oracle EBS
3 5 (1.17%) SAP S/4HANA
4 4 (0.93%) Oracle Applications
5 1 (0.23%) Dynamics CRM
5 1 (0.23%) Fidessa
5 1 (0.23%) Siebel CRM
Cloud Services
1 54 (12.59%) AWS
1 54 (12.59%) Azure
2 25 (5.83%) GCP
2 25 (5.83%) Snowflake
3 19 (4.43%) Power Platform
4 16 (3.73%) OpenShift
5 14 (3.26%) Figma
6 10 (2.33%) SaaS
7 9 (2.10%) Azure Data Factory
7 9 (2.10%) Azure Synapse Analytics
8 7 (1.63%) GitHub
8 7 (1.63%) Google Analytics
8 7 (1.63%) Stripe
9 6 (1.40%) npm
10 5 (1.17%) Adobe Analytics
10 5 (1.17%) Serverless
10 5 (1.17%) Yarn
11 4 (0.93%) Azure Machine Learning
11 4 (0.93%) Cloud Composer
12 3 (0.70%) Azure AI
Communications & Networking
1 23 (5.36%) Intranet
2 13 (3.03%) Firewall
2 13 (3.03%) VPN
3 12 (2.80%) Network Security
4 4 (0.93%) LoRaWAN
5 1 (0.23%) Cisco IOS
5 1 (0.23%) Cisco Wireless
5 1 (0.23%) DHCP
5 1 (0.23%) DNS
5 1 (0.23%) FIX Connectivity
5 1 (0.23%) IP Telephony
5 1 (0.23%) IPsec
5 1 (0.23%) LAN
5 1 (0.23%) Spanning Tree
5 1 (0.23%) TCP/IP
5 1 (0.23%) VLAN
5 1 (0.23%) Wireless
5 1 (0.23%) Wireless Security
5 1 (0.23%) Wireshark
5 1 (0.23%) WLAN
Database & Business Intelligence
1 44 (10.26%) Data Warehouse
2 34 (7.93%) SQL Server
3 31 (7.23%) NoSQL
4 26 (6.06%) Data Lake
5 21 (4.90%) Metadata
6 17 (3.96%) MongoDB
7 15 (3.50%) Power BI
8 14 (3.26%) Hadoop
9 13 (3.03%) Oracle Database
10 11 (2.56%) Relational Database
11 10 (2.33%) Apache Hudi
11 10 (2.33%) Apache Iceberg
11 10 (2.33%) Big Data
11 10 (2.33%) Delta Lake
11 10 (2.33%) Tableau
12 8 (1.86%) BusinessObjects
13 7 (1.63%) BigQuery
14 6 (1.40%) MySQL
14 6 (1.40%) PostgreSQL
14 6 (1.40%) Redis
Development Applications
1 27 (6.29%) Git
2 15 (3.50%) JIRA
3 12 (2.80%) webpack
4 10 (2.33%) Bitbucket
4 10 (2.33%) Jenkins
5 8 (1.86%) TeamCity
6 7 (1.63%) Cypress.io
6 7 (1.63%) GitLab
6 7 (1.63%) Selenium
7 6 (1.40%) Babel
7 6 (1.40%) Eclipse
7 6 (1.40%) Vite
8 5 (1.17%) Xcode
9 4 (0.93%) Ant
10 3 (0.70%) MSTest
10 3 (0.70%) NUnit
10 3 (0.70%) Postman
10 3 (0.70%) SpecFlow
10 3 (0.70%) XCTest
11 2 (0.47%) Storybook
General
1 166 (38.69%) Finance
2 104 (24.24%) Law
3 97 (22.61%) Social Skills
4 53 (12.35%) Public Sector
5 52 (12.12%) Banking
6 45 (10.49%) Local Government
7 39 (9.09%) Analytical Skills
7 39 (9.09%) Police
8 38 (8.86%) Marketing
9 23 (5.36%) Social Housing
10 21 (4.90%) Inclusion and Diversity
11 19 (4.43%) Manufacturing
12 13 (3.03%) Games
12 13 (3.03%) Legal
13 12 (2.80%) Organisational Skills
14 11 (2.56%) Front Office
14 11 (2.56%) Retail
15 6 (1.40%) Automotive
16 5 (1.17%) Influencing Skills
16 5 (1.17%) Telecoms
Job Titles
1 99 (23.08%) Senior
2 91 (21.21%) Developer
3 49 (11.42%) Lead
4 40 (9.32%) Consultant
5 34 (7.93%) Software Engineer
6 31 (7.23%) Implementation Consultant
7 28 (6.53%) Analyst
8 23 (5.36%) Umbraco Developer
9 21 (4.90%) Data Engineer
9 21 (4.90%) Senior Developer
9 21 (4.90%) UX Developer
10 20 (4.66%) Designer
11 18 (4.20%) Gen AI Engineer
12 16 (3.73%) Data Analytics Director
12 16 (3.73%) Front-End Developer (Client-Side Developer)
12 16 (3.73%) Security Engineer
13 15 (3.50%) Front-End Engineer (Client-Side Engineer)
13 15 (3.50%) Web Developer
14 14 (3.26%) Architect
14 14 (3.26%) Artificial Intelligence Engineer
Libraries, Frameworks & Software Standards
1 80 (18.65%) CSS
2 76 (17.72%) HTML
3 37 (8.62%) HTML5
4 36 (8.39%) React
5 31 (7.23%) jQuery
6 27 (6.29%) .NET
7 17 (3.96%) Kafka
7 17 (3.96%) Node.js
8 16 (3.73%) REST
9 15 (3.50%) RESTful
10 12 (2.80%) PySpark
11 11 (2.56%) CSS3
11 11 (2.56%) Vue
12 10 (2.33%) AngularJS
12 10 (2.33%) Jest
12 10 (2.33%) PyArrow
12 10 (2.33%) WPF
13 8 (1.86%) Middleware
14 7 (1.63%) Enzyme
14 7 (1.63%) Next.js
Miscellaneous
1 29 (6.76%) NHS
2 23 (5.36%) Housing Association
3 20 (4.66%) Algorithms
4 16 (3.73%) FMCG
4 16 (3.73%) Greenfield Project
5 11 (2.56%) Social Media
6 10 (2.33%) Data Structures
6 10 (2.33%) Legacy Systems
6 10 (2.33%) Public Cloud
7 9 (2.10%) Distributed Systems
7 9 (2.10%) IoT
7 9 (2.10%) Virtual Team
8 8 (1.86%) Product Ownership
8 8 (1.86%) Self-Motivation
9 7 (1.63%) Cloud Native
9 7 (1.63%) Derivative
9 7 (1.63%) Equities
9 7 (1.63%) Foreign Exchange (FX)
9 7 (1.63%) Learning Management System
9 7 (1.63%) Mobile App
Operating Systems
1 42 (9.79%) Unix
2 17 (3.96%) Linux
3 15 (3.50%) Windows
4 8 (1.86%) Android
4 8 (1.86%) Apple iOS
4 8 (1.86%) Solaris
Processes & Methodologies
1 98 (22.84%) Agile
1 98 (22.84%) User Experience
2 88 (20.51%) Analytics
3 82 (19.11%) Problem-Solving
4 63 (14.69%) Data Governance
5 61 (14.22%) Stakeholder Management
6 59 (13.75%) Project Management
7 54 (12.59%) Artificial Intelligence
7 54 (12.59%) CI/CD
8 52 (12.12%) UX Design
9 51 (11.89%) Software Engineering
10 50 (11.66%) Machine Learning
11 49 (11.42%) Data Management
11 49 (11.42%) Web Development
12 47 (10.96%) Data Modelling
12 47 (10.96%) ETL
13 46 (10.72%) Data Architecture
13 46 (10.72%) Data Strategy
14 43 (10.02%) Mentoring
15 42 (9.79%) Data Engineering
Programming Languages
1 142 (33.10%) SQL
2 83 (19.35%) Python
3 78 (18.18%) JavaScript
4 48 (11.19%) C#
5 34 (7.93%) TypeScript
6 27 (6.29%) PHP
7 25 (5.83%) Java
8 16 (3.73%) Go
9 13 (3.03%) PL/SQL
10 9 (2.10%) Elixir
10 9 (2.10%) Scala
11 8 (1.86%) Clojure
11 8 (1.86%) Rust
12 6 (1.40%) C++
12 6 (1.40%) Swift
13 5 (1.17%) C
13 5 (1.17%) Shell Script
14 4 (0.93%) Embedded C++
14 4 (0.93%) Kotlin
15 2 (0.47%) VB
Qualifications
1 125 (29.14%) Degree
2 44 (10.26%) DBS Check
3 16 (3.73%) CISSP
4 13 (3.03%) Master's Degree
5 12 (2.80%) CISM
6 8 (1.86%) Computer Science Degree
7 6 (1.40%) Security Cleared
8 5 (1.17%) SAP Certification
9 4 (0.93%) CREST Certified
9 4 (0.93%) OCA
9 4 (0.93%) OCP
9 4 (0.93%) Oracle Certification
9 4 (0.93%) SANS
9 4 (0.93%) SC Cleared
10 3 (0.70%) ISTQB
11 2 (0.47%) BPSS Clearance
11 2 (0.47%) DV Cleared
11 2 (0.47%) Tableau Certification
12 1 (0.23%) Cisco Certification
12 1 (0.23%) PhD
Quality Assurance & Compliance
1 59 (13.75%) Data Quality
2 43 (10.02%) WCAG
3 38 (8.86%) GDPR
4 30 (6.99%) QA
5 19 (4.43%) NIST
6 12 (2.80%) NCSC
7 8 (1.86%) ISO 9001
8 3 (0.70%) SLA
9 2 (0.47%) GLP
9 2 (0.47%) Good Clinical Practice
9 2 (0.47%) WAI
10 1 (0.23%) Cyber Essentials
10 1 (0.23%) ISO/IEC 27001
System Software
1 12 (2.80%) Docker
1 12 (2.80%) HDFS
2 5 (1.17%) Firmware
3 2 (0.47%) Virtual Machines
Systems Management
1 44 (10.26%) Kubernetes
2 5 (1.17%) Oracle RMAN
3 3 (0.70%) Terraform
4 2 (0.47%) Ansible
4 2 (0.47%) Hadoop YARN
5 1 (0.23%) cPanel
5 1 (0.23%) QRadar
Vendors
1 46 (10.72%) Microsoft
2 39 (9.09%) NEC
3 22 (5.13%) HP
4 20 (4.66%) Adobe
5 18 (4.20%) Google
6 16 (3.73%) Oracle
7 10 (2.33%) Red Hat
8 8 (1.86%) Citrix
8 8 (1.86%) SAP
9 6 (1.40%) OpenLink
10 5 (1.17%) Cadence
10 5 (1.17%) Cisco
11 4 (0.93%) Databricks
11 4 (0.93%) Salesforce
12 3 (0.70%) Atlassian
12 3 (0.70%) Facebook
12 3 (0.70%) Instagram
12 3 (0.70%) Solace
12 3 (0.70%) TIBCO
12 3 (0.70%) YouTube