User Experience Jobs in the UK excluding London

UX
UK > UK excluding London

The table below provides summary statistics for permanent job vacancies advertised in the UK excluding London requiring User Experience skills. It includes a benchmarking guide to the annual salaries offered in vacancies that cited User Experience over the 6 months leading up to 16 June 2025, comparing them to the same period in the previous two years.

6 months to
16 Jun 2025
Same period 2024 Same period 2023
Rank 107 70 93
Rank change year-on-year -37 +23 -40
Permanent jobs citing User Experience 1,125 2,692 1,901
As % of all permanent jobs advertised in the UK excluding London 2.83% 3.32% 3.47%
As % of the Processes & Methodologies category 3.10% 4.13% 3.64%
Number of salaries quoted 490 1,447 937
10th Percentile £31,950 £30,000 £35,000
25th Percentile £40,000 £36,365 £41,500
Median annual salary (50th Percentile) £53,106 £49,000 £55,000
Median % change year-on-year +8.38% -10.91% +4.76%
75th Percentile £66,250 £62,500 £70,000
90th Percentile £77,500 £76,750 £80,000
UK median annual salary £57,500 £51,000 £62,500
% change year-on-year +12.75% -18.40% +4.17%

All Process and Methodology Skills
UK excluding London

User Experience falls under the Processes and Methodologies category. For comparison with the information above, the following table provides summary statistics for all permanent job vacancies requiring process or methodology skills in the UK excluding London.

Permanent vacancies with a requirement for process or methodology skills 36,340 65,192 52,289
As % of all permanent jobs advertised in the UK excluding London 91.31% 80.46% 95.51%
Number of salaries quoted 17,751 44,023 28,212
10th Percentile £25,875 £27,500 £30,500
25th Percentile £35,000 £36,250 £40,000
Median annual salary (50th Percentile) £50,055 £50,000 £55,000
Median % change year-on-year +0.11% -9.09% +4.76%
75th Percentile £65,000 £65,000 £70,000
90th Percentile £77,500 £77,500 £81,250
UK median annual salary £55,000 £55,000 £60,800
% change year-on-year - -9.54% +1.33%

User Experience
Job Vacancy Trend in the UK excluding London

Job postings citing User Experience as a proportion of all IT jobs advertised in the UK excluding London.
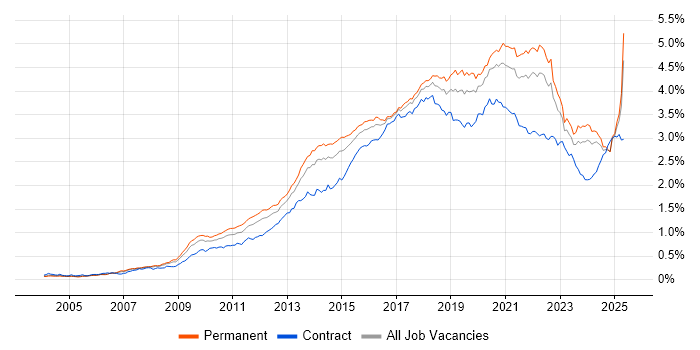
Job vacancy trend for User Experience in the UK excluding London

User Experience
Salary Trend in the UK excluding London

3-month moving average salary quoted in jobs citing User Experience in the UK excluding London.

Salary trend for User Experience in the UK excluding London

User Experience
Salary Histogram in the UK excluding London

Salary distribution for jobs citing User Experience in the UK excluding London over the 6 months to 16 June 2025.

Salary histogram for User Experience in the UK excluding London

User Experience
Job Locations in the UK excluding London

The table below looks at the demand and provides a guide to the median salaries quoted in IT jobs citing User Experience within the UK excluding London region over the 6 months to 16 June 2025. The 'Rank Change' column provides an indication of the change in demand within each location based on the same 6 month period last year.

Location Rank Change
on Same Period
Last Year
Matching
Permanent
IT Job Ads
Median Salary
Past 6 Months
Median Salary
% Change
on Same Period
Last Year
Live
Jobs
North of England -27 489 £55,000 +15.79% 1,846
North West -26 418 £55,021 +22.27% 1,003
South East -60 169 £52,713 +5.43% 2,178
Scotland +16 138 £70,000 +40.03% 410
Midlands -64 135 £53,688 +13.03% 1,189
West Midlands -26 104 £55,000 +10.00% 667
South West -19 100 £46,500 -15.45% 764
East of England -11 76 £45,000 +12.50% 987
Yorkshire -42 52 £42,500 -15.00% 679
East Midlands -59 31 £35,000 - 518
North East -2 19 £50,250 +18.24% 165
Northern Ireland +18 8 - - 141
Isle of Man +17 4 - -
Wales +9 4 £67,500 +80.31% 231
Channel Islands - 2 £87,500 - 41
User Experience
UK

User Experience
Co-occurring Skills and Capabilities in the UK excluding London by Category

The follow tables expand on the table above by listing co-occurrences grouped by category. The same employment type, locality and period is covered with up to 20 co-occurrences shown in each of the following categories:

Application Platforms
1 51 (4.53%) CMS
2 29 (2.58%) SharePoint
3 26 (2.31%) WordPress
4 22 (1.96%) Microsoft Exchange
5 18 (1.60%) Skype for Business
6 14 (1.24%) Confluence
7 11 (0.98%) IBM Domino
8 9 (0.80%) Drupal
8 9 (0.80%) Umbraco
9 7 (0.62%) IIS
10 5 (0.44%) Headless CMS
11 4 (0.36%) SAP Portal
12 3 (0.27%) Apache
12 3 (0.27%) Strapi
13 2 (0.18%) Adobe Experience Manager
13 2 (0.18%) Apache Solr
13 2 (0.18%) Apache Spark
14 1 (0.089%) Apache Airflow
14 1 (0.089%) ColdFusion
14 1 (0.089%) Tomcat
Applications
1 22 (1.96%) Microsoft Excel
2 17 (1.51%) Adobe Creative Suite
3 15 (1.33%) Sketch
4 12 (1.07%) Adobe XD
4 12 (1.07%) Photoshop
5 10 (0.89%) Microsoft Office
5 10 (0.89%) MS Visio
6 8 (0.71%) Adobe Illustrator
6 8 (0.71%) Chatbot
7 6 (0.53%) InDesign
8 5 (0.44%) Adobe Premiere
9 4 (0.36%) Microsoft PowerPoint
10 3 (0.27%) Adobe After Effects
11 2 (0.18%) Elementor
12 1 (0.089%) Adobe Captivate
12 1 (0.089%) Blender
12 1 (0.089%) CINEMA 4D
12 1 (0.089%) Maya
12 1 (0.089%) Simulink
12 1 (0.089%) Trello
Business Applications
1 16 (1.42%) Shopify
2 14 (1.24%) Dynamics CRM
3 11 (0.98%) Magento
4 8 (0.71%) Payment Gateway
5 6 (0.53%) NetSuite
6 2 (0.18%) Salesforce CRM
7 1 (0.089%) iTrent
7 1 (0.089%) Oracle EBS
7 1 (0.089%) Oracle EBS R12
7 1 (0.089%) Oracle ERP
7 1 (0.089%) Oracle Procure-to-Pay
7 1 (0.089%) Remedy ITSM
7 1 (0.089%) Sage 200
7 1 (0.089%) Sprinklr
Cloud Services
1 411 (36.53%) AWS
2 407 (36.18%) Azure
3 194 (17.24%) GCP
4 65 (5.78%) Microsoft 365
5 54 (4.80%) Figma
6 47 (4.18%) Power Platform
7 39 (3.47%) Google Analytics
8 30 (2.67%) GitHub
9 25 (2.22%) Serverless
10 22 (1.96%) Azure DevOps
10 22 (1.96%) SaaS
11 20 (1.78%) Power Automate
12 17 (1.51%) PowerApps
13 16 (1.42%) AWS Lambda
13 16 (1.42%) Azure Logic Apps
14 15 (1.33%) Google Workspace
15 12 (1.07%) Dynamics 365
15 12 (1.07%) Entra ID
15 12 (1.07%) Slack
16 10 (0.89%) Google Ads
Communications & Networking
1 19 (1.69%) Internet
1 19 (1.69%) Unified Communications
1 19 (1.69%) Wireless
2 18 (1.60%) Skype
3 8 (0.71%) HTTP
4 7 (0.62%) Cisco IOS
4 7 (0.62%) LAN
4 7 (0.62%) WAN
5 5 (0.44%) DNS
5 5 (0.44%) VPN
6 4 (0.36%) LoRaWAN
6 4 (0.36%) TCP/IP
7 3 (0.27%) Intranet
8 2 (0.18%) DHCP
8 2 (0.18%) DMZ
8 2 (0.18%) Firewall
8 2 (0.18%) LTE
8 2 (0.18%) Remote Desktop
9 1 (0.089%) Broadband
9 1 (0.089%) VoIP
Database & Business Intelligence
1 142 (12.62%) SQL Server
2 51 (4.53%) MySQL
3 33 (2.93%) PostgreSQL
4 31 (2.76%) Power BI
5 22 (1.96%) NoSQL
6 15 (1.33%) MongoDB
7 11 (0.98%) DynamoDB
8 9 (0.80%) Relational Database
9 6 (0.53%) Amazon Aurora
10 5 (0.44%) Big Data
10 5 (0.44%) SQL Server Integration Services
10 5 (0.44%) SQL Server Reporting Services
11 4 (0.36%) Amazon RDS
11 4 (0.36%) Elasticsearch
11 4 (0.36%) Hadoop
11 4 (0.36%) Mixpanel
11 4 (0.36%) Tableau
12 3 (0.27%) Azure SQL Database
12 3 (0.27%) CockroachDB
12 3 (0.27%) Data Warehouse
Development Applications
1 154 (13.69%) JIRA
2 109 (9.69%) GitLab
2 109 (9.69%) Selenium
3 99 (8.80%) Maven
4 98 (8.71%) Cucumber
5 95 (8.44%) Bitbucket
6 91 (8.09%) SonarQube
7 90 (8.00%) Sonatype Nexus
8 83 (7.38%) Git
9 24 (2.13%) Visual Studio
10 17 (1.51%) Jenkins
11 11 (0.98%) Cypress.io
12 10 (0.89%) Appium
13 8 (0.71%) Subversion
13 8 (0.71%) Vite
14 7 (0.62%) JUnit
15 6 (0.53%) JMeter
15 6 (0.53%) Postman
16 5 (0.44%) Visual Studio Code
16 5 (0.44%) webpack
General
1 349 (31.02%) Finance
2 308 (27.38%) Inclusion and Diversity
3 266 (23.64%) Social Skills
4 223 (19.82%) Banking
5 129 (11.47%) Retail
6 118 (10.49%) Analytical Skills
7 96 (8.53%) Marketing
8 91 (8.09%) Investment Banking
9 90 (8.00%) Corporate Banking
10 49 (4.36%) Law
11 28 (2.49%) Electronics
12 27 (2.40%) Advertising
13 22 (1.96%) Manufacturing
14 20 (1.78%) Games
14 20 (1.78%) Organisational Skills
15 18 (1.60%) Avionics
16 17 (1.51%) Financial Institution
17 15 (1.33%) Legal
17 15 (1.33%) Pharmaceutical
18 12 (1.07%) Presentation Skills
Job Titles
1 397 (35.29%) Senior
2 301 (26.76%) Software Engineer
3 230 (20.44%) Developer
4 189 (16.80%) Senior Software Engineer
5 126 (11.20%) Designer
6 99 (8.80%) UX Designer
7 87 (7.73%) Senior Designer
8 84 (7.47%) Senior UX Designer
9 80 (7.11%) Lead
10 69 (6.13%) Senior Developer
11 53 (4.71%) Analyst
12 48 (4.27%) Full-Stack Developer
13 44 (3.91%) Front-End Developer (Client-Side Developer)
14 33 (2.93%) IT Support
15 32 (2.84%) Product Manager
16 25 (2.22%) Applications Support
17 23 (2.04%) .NET Developer
18 22 (1.96%) UX Developer
19 20 (1.78%) Architect
19 20 (1.78%) C# Developer
Libraries, Frameworks & Software Standards
1 276 (24.53%) .NET
2 224 (19.91%) React
3 216 (19.20%) Node.js
4 215 (19.11%) CSS
5 211 (18.76%) HTML
6 163 (14.49%) RESTful
7 124 (11.02%) HTML5
8 115 (10.22%) CSS3
9 114 (10.13%) REST
10 111 (9.87%) Kafka
11 107 (9.51%) Spring
11 107 (9.51%) Spring Boot
12 106 (9.42%) Jest
12 106 (9.42%) Sass
13 97 (8.62%) Redux
14 91 (8.09%) JPA
15 64 (5.69%) AngularJS
16 30 (2.67%) ASP.NET
17 27 (2.40%) .NET Framework
18 25 (2.22%) Vue
Miscellaneous
1 186 (16.53%) Self-Motivation
2 172 (15.29%) Cyberattack
2 172 (15.29%) Linux Command Line
3 156 (13.87%) Product Ownership
4 95 (8.44%) Enterprise Software
5 52 (4.62%) Mobile App
6 28 (2.49%) Algorithms
7 23 (2.04%) Social Media
8 20 (1.78%) Data Structures
9 18 (1.60%) Digital Signage
9 18 (1.60%) Video Conferencing
10 17 (1.51%) Onboarding
11 15 (1.33%) e-Learning
12 14 (1.24%) Renewable Energy
13 11 (0.98%) Driving Licence
13 11 (0.98%) Greenfield Project
13 11 (0.98%) Virtual Team
14 10 (0.89%) Online Banking
14 10 (0.89%) Smartphone
15 9 (0.80%) IoT
Operating Systems
1 208 (18.49%) Linux
2 58 (5.16%) Windows
3 50 (4.44%) Android
4 33 (2.93%) Apple iOS
5 22 (1.96%) Windows Server
6 8 (0.71%) Mac OS
6 8 (0.71%) Windows 10
7 1 (0.089%) CentOS
7 1 (0.089%) Debian
7 1 (0.089%) Solaris
Processes & Methodologies
1 635 (56.44%) Agile
2 365 (32.44%) Software Engineering
3 338 (30.04%) UX Design
4 324 (28.80%) Mentoring
5 308 (27.38%) Microservices
6 235 (20.89%) Scrum
7 217 (19.29%) Problem-Solving
8 214 (19.02%) Machine Learning
9 206 (18.31%) Project Management
10 198 (17.60%) DevOps
11 197 (17.51%) CI/CD
12 193 (17.16%) Full-Stack Development
13 189 (16.80%) Front End Development
14 182 (16.18%) Data Engineering
15 180 (16.00%) Test Automation
16 178 (15.82%) Cloud Security
17 175 (15.56%) Site Reliability Engineering
18 152 (13.51%) SDLC
19 138 (12.27%) Stakeholder Management
20 136 (12.09%) Prototyping
Programming Languages
1 465 (41.33%) JavaScript
2 349 (31.02%) Java
3 253 (22.49%) Python
4 193 (17.16%) TypeScript
5 186 (16.53%) C++
6 183 (16.27%) SQL
7 179 (15.91%) Go
8 174 (15.47%) Rust
9 105 (9.33%) C#
10 47 (4.18%) PHP
11 20 (1.78%) C
12 14 (1.24%) Kotlin
13 13 (1.16%) PowerShell
14 10 (0.89%) Swift
15 8 (0.71%) Bicep
16 6 (0.53%) Dart
17 4 (0.36%) Perl
17 4 (0.36%) R
18 3 (0.27%) Bash
18 3 (0.27%) VB
Qualifications
1 214 (19.02%) Security Cleared
2 182 (16.18%) DV Cleared
3 177 (15.73%) AWS Certification
4 174 (15.47%) AWS Certified Developer
5 172 (15.29%) AWS Certified Solutions Architect
6 135 (12.00%) Degree
7 35 (3.11%) Computer Science Degree
8 20 (1.78%) PMI Certification
8 20 (1.78%) PMP
8 20 (1.78%) SC Cleared
9 14 (1.24%) DBS Check
10 11 (0.98%) PhD
11 8 (0.71%) BPSS Clearance
11 8 (0.71%) ISTQB
12 7 (0.62%) ITIL Certification
13 4 (0.36%) CISSP
13 4 (0.36%) ITIL Foundation Certificate
13 4 (0.36%) Microsoft Certification
14 3 (0.27%) A+ Certification
14 3 (0.27%) Master's Degree
Quality Assurance & Compliance
1 242 (21.51%) Accessibility
2 169 (15.02%) QA
3 13 (1.16%) GDPR
4 10 (0.89%) WCAG
5 8 (0.71%) Data Quality
6 6 (0.53%) COBIT
7 5 (0.44%) Actionable Recommendations
7 5 (0.44%) PCI DSS
7 5 (0.44%) SLA
8 4 (0.36%) ISO/IEC 27001
9 3 (0.27%) 21 CFR Part 11
9 3 (0.27%) Good Clinical Practice
10 2 (0.18%) Cyber Essentials
10 2 (0.18%) IEC 62304
10 2 (0.18%) ISO 13485
10 2 (0.18%) NCSC
10 2 (0.18%) NIST
11 1 (0.089%) HIPAA
System Software
1 156 (13.87%) Docker
2 30 (2.67%) Active Directory
3 7 (0.62%) VMware ESXi
4 4 (0.36%) VMware Infrastructure
5 2 (0.18%) HDFS
6 1 (0.089%) Firmware
6 1 (0.089%) Virtual Desktop
6 1 (0.089%) Virtual Servers
Systems Management
1 143 (12.71%) Kubernetes
2 30 (2.67%) Terraform
3 13 (1.16%) Microsoft Intune
4 8 (0.71%) Grafana
5 4 (0.36%) SCCM
6 3 (0.27%) Kibana
7 2 (0.18%) Kubeflow
7 2 (0.18%) Puppet
7 2 (0.18%) SCOM
7 2 (0.18%) SCSM
7 2 (0.18%) Single Sign-On
8 1 (0.089%) Active Directory Federation Services
8 1 (0.089%) Ansible
8 1 (0.089%) Opsgenie
8 1 (0.089%) Prometheus
Vendors
1 129 (11.47%) Microsoft
2 90 (8.00%) Solace
3 77 (6.84%) Google
4 41 (3.64%) Adobe
5 33 (2.93%) SAP
6 26 (2.31%) Cisco
7 25 (2.22%) Salesforce
8 23 (2.04%) ServiceNow
9 22 (1.96%) Oracle
10 20 (1.78%) Workday
11 19 (1.69%) Concur
12 18 (1.60%) Mitel
12 18 (1.60%) Polycom
12 18 (1.60%) ShoreTel
13 15 (1.33%) Facebook
14 12 (1.07%) Bloomberg
14 12 (1.07%) VMware
14 12 (1.07%) WooCommerce
15 11 (0.98%) Apple
15 11 (0.98%) Hotjar