SharePoint Job Trends in the UK excluding London

Microsoft SharePoint
UK > UK excluding London

The table below provides summary statistics and salary benchmarking for jobs advertised in the UK excluding London requiring SharePoint skills. It covers permanent job vacancies from the 6 months leading up to 20 November 2025, with comparisons to the same periods in the previous two years.

6 months to
20 Nov 2025
Same period 2024 Same period 2023
Rank 109 105 120
Rank change year-on-year -4 +15 +12
Permanent jobs citing SharePoint 789 1,072 804
As % of all permanent jobs in the UK excluding London 2.15% 2.27% 2.68%
As % of the Application Platforms category 33.86% 31.90% 25.24%
Number of salaries quoted 576 628 683
10th Percentile £26,250 £26,750 £27,750
25th Percentile £30,000 £31,250 £31,250
Median annual salary (50th Percentile) £37,500 £42,500 £40,500
Median % change year-on-year -11.76% +4.94% -1.82%
75th Percentile £50,000 £56,250 £53,750
90th Percentile £63,750 £70,375 £61,250
UK median annual salary £42,500 £50,000 £47,500
% change year-on-year -15.00% +5.26% -

All Application Platform Skills
UK excluding London

SharePoint falls under the Application Platforms category. For comparison with the information above, the following table provides summary statistics for all permanent job vacancies requiring application platform skills in the UK excluding London.

Permanent vacancies with a requirement for application platform skills 2,330 3,360 3,185
As % of all permanent jobs advertised in the UK excluding London 6.34% 7.11% 10.62%
Number of salaries quoted 1,611 1,802 2,542
10th Percentile £27,000 £29,000 £28,500
25th Percentile £31,250 £32,750 £34,000
Median annual salary (50th Percentile) £42,500 £47,500 £47,500
Median % change year-on-year -10.53% - -
75th Percentile £60,000 £60,000 £62,500
90th Percentile £73,750 £73,750 £77,697
UK median annual salary £52,500 £57,500 £55,000
% change year-on-year -8.70% +4.55% -

SharePoint
Job Vacancy Trend in the UK excluding London

Historical trend showing the proportion of permanent IT job postings citing SharePoint relative to all permanent IT jobs advertised in the UK excluding London.
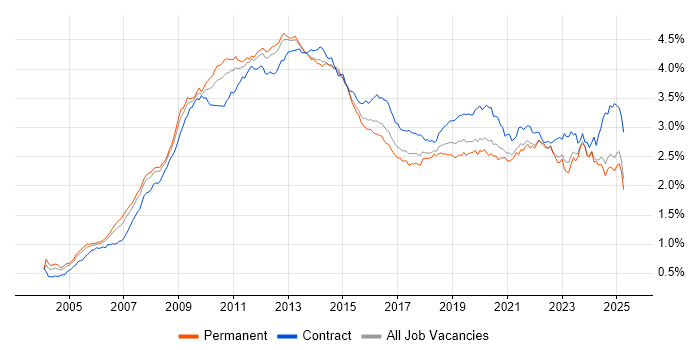
SharePoint job vacancy trend in the UK excluding London

SharePoint
Salary Trend in the UK excluding London

Salary distribution trend for jobs in the UK excluding London citing SharePoint.

Salary distribution trend for jobs in the UK excluding London citing SharePoint

SharePoint
Salary Histogram in the UK excluding London

Salary distribution for jobs citing SharePoint in the UK excluding London over the 6 months to 20 November 2025.

Salary histogram for SharePoint in the UK excluding London

SharePoint
Job Locations in the UK excluding London

The table below looks at the demand and provides a guide to the median salaries quoted in IT jobs citing SharePoint within the UK excluding London region over the 6 months to 20 November 2025. The 'Rank Change' column provides an indication of the change in demand within each location based on the same 6 month period last year.

Location Rank Change
on Same Period
Last Year
Matching
Permanent
IT Job Ads
Median Salary
Past 6 Months
Median Salary
% Change
on Same Period
Last Year
Live
Jobs
South East -2 187 £40,000 -11.11% 163
North of England -26 143 £38,000 -24.00% 92
Midlands +21 137 £38,500 -6.10% 96
South West +39 127 £34,000 -32.00% 62
Scotland +9 104 £35,000 +7.69% 29
East of England -7 85 £34,000 +6.25% 57
North West -6 84 £41,250 -17.50% 44
West Midlands +2 70 £44,000 -15.38% 46
East Midlands +7 67 £37,500 +20.97% 50
Yorkshire -15 56 £30,000 -45.95% 41
Wales -11 6 £41,000 -13.68% 7
North East -13 3 £67,500 +58.82% 7
Northern Ireland -12 2 £66,250 +26.19% 4
SharePoint
UK

SharePoint
Co-Occurring Skills & Capabilities in the UK excluding London by Category

The following tables expand on the one above by listing co-occurrences grouped by category. They cover the same employment type, locality and period, with up to 20 co-occurrences shown in each category:

Application Platforms
1 270 (34.22%) Microsoft Exchange
2 19 (2.41%) Confluence
3 15 (1.90%) Skype for Business
4 7 (0.89%) WordPress
5 6 (0.76%) IIS
6 4 (0.51%) CMS
7 2 (0.25%) Exchange Server 2007
7 2 (0.25%) Exchange Server 2010
7 2 (0.25%) Exchange Server 2013
7 2 (0.25%) HCL Notes
7 2 (0.25%) JOnAS
7 2 (0.25%) Office Communications Server
7 2 (0.25%) Oracle SOA Suite
7 2 (0.25%) SharePoint Server
7 2 (0.25%) Umbraco
8 1 (0.13%) LiveLink
8 1 (0.13%) Oracle Workflow
8 1 (0.13%) SharePoint 2013
Applications
1 138 (17.49%) Microsoft Office
2 134 (16.98%) Microsoft Excel
3 75 (9.51%) Microsoft PowerPoint
4 10 (1.27%) Microsoft Project
5 6 (0.76%) MS Visio
6 5 (0.63%) Spreadsheet
7 1 (0.13%) Acrobat
7 1 (0.13%) Adobe Illustrator
7 1 (0.13%) AutoCAD
7 1 (0.13%) InDesign
7 1 (0.13%) Photoshop
7 1 (0.13%) Revit
Business Applications
1 26 (3.30%) Dynamics CRM
2 4 (0.51%) Dynamics AX
2 4 (0.51%) Unit4 Business World
2 4 (0.51%) Visualfiles
3 3 (0.38%) Sage 1000
4 2 (0.25%) Oracle BPM
5 1 (0.13%) NetSuite
5 1 (0.13%) Oracle EBS
5 1 (0.13%) Sage 200
Cloud Services
1 521 (66.03%) Microsoft 365
2 334 (42.33%) Azure
3 248 (31.43%) Entra ID
4 140 (17.74%) Power Platform
5 123 (15.59%) OneDrive
6 85 (10.77%) PowerApps
7 83 (10.52%) Power Automate
8 37 (4.69%) Microsoft Purview
9 34 (4.31%) Dynamics 365
10 32 (4.06%) SaaS
11 28 (3.55%) Microsoft Copilot
12 19 (2.41%) Serverless
13 17 (2.15%) AWS
13 17 (2.15%) Cloud Computing
13 17 (2.15%) Mimecast
14 12 (1.52%) Azure Logic Apps
14 12 (1.52%) Copilot Studio
14 12 (1.52%) IaaS
15 11 (1.39%) PaaS
16 10 (1.27%) Azure Sentinel
Communications & Networking
1 133 (16.86%) DNS
2 132 (16.73%) Firewall
3 118 (14.96%) DHCP
4 91 (11.53%) VPN
5 73 (9.25%) TCP/IP
6 68 (8.62%) VLAN
7 50 (6.34%) LAN
8 48 (6.08%) Wi-Fi
9 45 (5.70%) Wireless
10 40 (5.07%) WAN
11 31 (3.93%) Network Security
12 30 (3.80%) VoIP
13 24 (3.04%) Internet
14 22 (2.79%) Intranet
15 13 (1.65%) SAN
16 10 (1.27%) Skype
17 9 (1.14%) DKIM
17 9 (1.14%) DMARC
18 8 (1.01%) Unified Communications
19 6 (0.76%) IP Telephony
Database & Business Intelligence
1 73 (9.25%) Power BI
2 22 (2.79%) SQL Server
3 13 (1.65%) Amazon RDS
4 9 (1.14%) DTS
5 7 (0.89%) Metadata
5 7 (0.89%) SQL Server Reporting Services
6 6 (0.76%) Azure SQL Database
6 6 (0.76%) Data Warehouse
6 6 (0.76%) SQL Server Integration Services
7 5 (0.63%) MySQL
8 3 (0.38%) Data Mining
8 3 (0.38%) EDRMS
8 3 (0.38%) Power Query
9 2 (0.25%) Crystal Reports
9 2 (0.25%) SQL Server Analysis Services
10 1 (0.13%) EDMS
10 1 (0.13%) Relational Database
10 1 (0.13%) Star Schema
Development Applications
1 23 (2.92%) JIRA
2 1 (0.13%) Git
2 1 (0.13%) RStudio
2 1 (0.13%) SQL Server Management Studio (SSMS)
General
1 381 (48.29%) Social Skills
2 103 (13.05%) Finance
3 55 (6.97%) Organisational Skills
4 52 (6.59%) Manufacturing
5 46 (5.83%) Analytical Skills
6 43 (5.45%) Legal
7 40 (5.07%) Law
8 34 (4.31%) Public Sector
9 30 (3.80%) Retail
10 22 (2.79%) Automotive
10 22 (2.79%) Documentation Skills
11 19 (2.41%) Telecoms
12 18 (2.28%) Inclusion and Diversity
13 16 (2.03%) Marketing
14 11 (1.39%) Billing
15 9 (1.14%) Advertising
16 8 (1.01%) Electronics
16 8 (1.01%) Local Government
16 8 (1.01%) Police
17 6 (0.76%) Presentation Skills
Job Titles
1 173 (21.93%) IT Support
2 144 (18.25%) Support Engineer
3 111 (14.07%) Senior
4 104 (13.18%) Analyst
5 86 (10.90%) IT Engineer
6 78 (9.89%) IT Support Engineer
7 72 (9.13%) 2nd Line Support
8 65 (8.24%) Senior Manager
9 64 (8.11%) QA Manager
9 64 (8.11%) Quality Manager
9 64 (8.11%) Senior QA Manager
9 64 (8.11%) Senior Quality Manager
9 64 (8.11%) Support Analyst
10 45 (5.70%) Microsoft 365 Engineer
11 44 (5.58%) Support Technician
12 43 (5.45%) Infrastructure Engineer
13 41 (5.20%) Technical Support
14 36 (4.56%) 1st Line Support
15 34 (4.31%) Developer
16 33 (4.18%) Administrator
Libraries, Frameworks & Software Standards
1 20 (2.53%) .NET
2 12 (1.52%) Web Services
3 11 (1.39%) HTML
4 9 (1.14%) Microsoft Graph
5 7 (0.89%) ASP.NET
6 6 (0.76%) CSS
7 5 (0.63%) EDI
7 5 (0.63%) Software Packaging
8 4 (0.51%) ARM Templates
8 4 (0.51%) OAuth
8 4 (0.51%) OAuth2
8 4 (0.51%) OpenID
8 4 (0.51%) SAML
8 4 (0.51%) SPFx
9 2 (0.25%) .NET Framework
9 2 (0.25%) ASP.NET Core
9 2 (0.25%) ASP.NET MVC
9 2 (0.25%) HTML5 Canvas
9 2 (0.25%) Razor View Engine
9 2 (0.25%) REST
Miscellaneous
1 109 (13.81%) Driving Licence
2 88 (11.15%) Onboarding
3 37 (4.69%) IoT
4 30 (3.80%) Enterprise Software
5 25 (3.17%) Product Ownership
6 16 (2.03%) Management Information System
7 15 (1.90%) Video Conferencing
8 13 (1.65%) Data Centre
8 13 (1.65%) Security Posture
9 12 (1.52%) FMCG
10 11 (1.39%) Analytical Mindset
10 11 (1.39%) Hybrid Cloud
11 10 (1.27%) CMDB
12 9 (1.14%) NHS
12 9 (1.14%) Replication
13 8 (1.01%) Self-Motivation
14 7 (0.89%) Clustering
14 7 (0.89%) Cyber Security Posture
14 7 (0.89%) iPad
15 6 (0.76%) PDA
Operating Systems
1 300 (38.02%) Windows
2 194 (24.59%) Windows Server
3 106 (13.43%) Windows 10
4 44 (5.58%) Mac OS
5 21 (2.66%) Android
6 19 (2.41%) Linux
7 18 (2.28%) Apple iOS
8 15 (1.90%) Windows Server 2016
8 15 (1.90%) Windows Server 2019
9 12 (1.52%) Windows Server 2008
10 3 (0.38%) Unix
11 2 (0.25%) VMS
11 2 (0.25%) Windows 7
11 2 (0.25%) Windows Server 2003
11 2 (0.25%) Windows Server 2012
12 1 (0.13%) CentOS
12 1 (0.13%) Red Hat Enterprise Linux
12 1 (0.13%) SUSE
12 1 (0.13%) Ubuntu
12 1 (0.13%) Windows 8
Processes & Methodologies
1 222 (28.14%) Problem-Solving
2 159 (20.15%) Customer Service
3 148 (18.76%) Continuous Improvement
4 137 (17.36%) ITIL
5 105 (13.31%) Cybersecurity
6 102 (12.93%) Project Management
7 99 (12.55%) Coaching
8 97 (12.29%) Service Delivery
9 74 (9.38%) Customer Experience
10 72 (9.13%) Business Intelligence
11 66 (8.37%) Agile
11 66 (8.37%) Quality Management
11 66 (8.37%) Six Sigma
12 64 (8.11%) Due Diligence
12 64 (8.11%) Lean Six Sigma
12 64 (8.11%) Performance Improvement
13 63 (7.98%) Mentoring
13 63 (7.98%) Migration
14 54 (6.84%) CRM
15 51 (6.46%) Infrastructure Engineering
Programming Languages
1 125 (15.84%) PowerShell
2 77 (9.76%) SQL
3 27 (3.42%) Python
4 17 (2.15%) VBA
5 14 (1.77%) C#
6 10 (1.27%) Bash
6 10 (1.27%) T-SQL
7 9 (1.14%) JavaScript
8 3 (0.38%) VB.NET
9 2 (0.25%) C++
9 2 (0.25%) Shell Script
9 2 (0.25%) TypeScript
10 1 (0.13%) Data Analysis Expressions
10 1 (0.13%) Java
10 1 (0.13%) R
10 1 (0.13%) VB
10 1 (0.13%) X++
Qualifications
1 89 (11.28%) Degree
2 64 (8.11%) Six Sigma Yellow Belt
3 57 (7.22%) Microsoft Certification
4 45 (5.70%) Security Cleared
5 28 (3.55%) SC Cleared
6 17 (2.15%) BPSS Clearance
6 17 (2.15%) DBS Check
7 13 (1.65%) A+ Certification
7 13 (1.65%) MCP
8 12 (1.52%) DV Cleared
8 12 (1.52%) Master's Degree
9 11 (1.39%) Azure Certification
10 8 (1.01%) ACCA
10 8 (1.01%) CIMA
10 8 (1.01%) HND
10 8 (1.01%) ITIL Certification
11 7 (0.89%) AAT
11 7 (0.89%) ITIL Foundation Certificate
11 7 (0.89%) PMI Certification
11 7 (0.89%) PMP
Quality Assurance & Compliance
1 80 (10.14%) QA
2 36 (4.56%) GDPR
3 33 (4.18%) SLA
4 29 (3.68%) Cyber Essentials
5 14 (1.77%) ISO/IEC 27001
6 13 (1.65%) NIST
7 12 (1.52%) PMO
8 10 (1.27%) Cyber Essentials PLUS
9 3 (0.38%) Accessibility
10 2 (0.25%) Data Quality
10 2 (0.25%) P3O
10 2 (0.25%) WCAG
11 1 (0.13%) GRC
11 1 (0.13%) HIPAA
11 1 (0.13%) IASME
11 1 (0.13%) ISO 19650
11 1 (0.13%) ISO 22301
11 1 (0.13%) PCI DSS
System Software
1 318 (40.30%) Active Directory
2 69 (8.75%) Hyper-V
3 57 (7.22%) VMware Infrastructure
4 20 (2.53%) Virtual Desktop
5 7 (0.89%) Terminal Services
6 6 (0.76%) Firmware
7 5 (0.63%) Virtual Machines
7 5 (0.63%) vSphere
8 4 (0.51%) VMware ESXi
9 2 (0.25%) ISA Server
9 2 (0.25%) XenApp
10 1 (0.13%) Docker
10 1 (0.13%) Dovecot
10 1 (0.13%) Postfix
10 1 (0.13%) Virtual Servers
10 1 (0.13%) VMware NSX
Systems Management
1 226 (28.64%) Microsoft Intune
2 23 (2.92%) SCCM
2 23 (2.92%) Terraform
3 16 (2.03%) Autotask
4 10 (1.27%) Single Sign-On
5 9 (1.14%) Nagios
5 9 (1.14%) ZABBIX
6 6 (0.76%) Failover Clustering
7 4 (0.51%) vCenter Server
8 3 (0.38%) SCOM
9 2 (0.25%) Jamf Pro
9 2 (0.25%) Plesk
9 2 (0.25%) Proxmox
9 2 (0.25%) SCSM
9 2 (0.25%) WSUS
10 1 (0.13%) Kubernetes
10 1 (0.13%) PaperCut
10 1 (0.13%) vRealize
Vendors
1 669 (84.79%) Microsoft
2 65 (8.24%) VMware
3 41 (5.20%) Apple
3 41 (5.20%) Cisco
4 38 (4.82%) Sophos
5 37 (4.69%) Meraki
6 23 (2.92%) ServiceNow
7 21 (2.66%) Citrix
8 19 (2.41%) Sage
9 17 (2.15%) Datto
9 17 (2.15%) Progress
10 16 (2.03%) ConnectWise
10 16 (2.03%) Veeam
11 14 (1.77%) Atlassian
12 13 (1.65%) Google
13 12 (1.52%) Trend Micro
14 11 (1.39%) Darktrace
14 11 (1.39%) SolarWinds
15 10 (1.27%) HubSpot
15 10 (1.27%) Proofpoint