Organisational Skills Jobs in the UK excluding London

Organisational Skills
UK > UK excluding London

The table below looks at the prevalence of the term Organisational Skills in permanent job vacancies in the UK excluding London. Included is a benchmarking guide to the salaries offered in vacancies that cited Organisational Skills over the 6 months leading up to 20 June 2025, comparing them to the same period in the previous two years.

6 months to
20 Jun 2025
Same period 2024 Same period 2023
Rank 142 100 112
Rank change year-on-year -42 +12 +3
Permanent jobs citing Organisational Skills 887 2,042 1,652
As % of all permanent jobs advertised in the UK excluding London 2.23% 2.50% 3.02%
As % of the General category 3.28% 4.62% 4.48%
Number of salaries quoted 511 1,373 612
10th Percentile £24,500 £23,500 £24,000
25th Percentile £26,250 £26,500 £28,938
Median annual salary (50th Percentile) £34,000 £34,500 £40,000
Median % change year-on-year -1.45% -13.75% -5.88%
75th Percentile £50,000 £51,250 £55,414
90th Percentile £65,000 £63,750 £77,500
UK median annual salary £40,000 £35,000 £45,000
% change year-on-year +14.29% -22.22% -8.91%

All General Skills
UK excluding London

Organisational Skills falls under the General Skills category. For comparison with the information above, the following table provides summary statistics for all permanent job vacancies requiring common skills in the UK excluding London.

Permanent vacancies with a requirement for common skills 27,026 44,164 36,859
As % of all permanent jobs advertised in the UK excluding London 67.80% 54.07% 67.33%
Number of salaries quoted 12,303 27,813 17,859
10th Percentile £25,087 £26,000 £28,500
25th Percentile £31,250 £32,500 £37,500
Median annual salary (50th Percentile) £47,683 £47,500 £52,500
Median % change year-on-year +0.39% -9.52% +5.00%
75th Percentile £63,750 £62,200 £67,500
90th Percentile £77,500 £75,000 £80,850
UK median annual salary £55,000 £52,500 £60,000
% change year-on-year +4.76% -12.50% -

Organisational Skills
Job Vacancy Trend in the UK excluding London

Job postings citing Organisational Skills as a proportion of all IT jobs advertised in the UK excluding London.
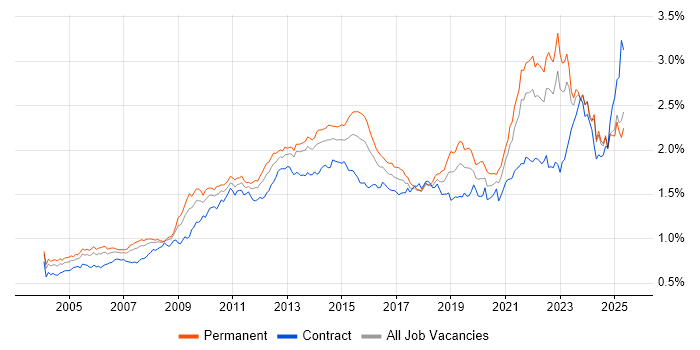
Job vacancy trend for Organisational Skills in the UK excluding London

Organisational Skills
Salary Trend in the UK excluding London

3-month moving average salary quoted in jobs citing Organisational Skills in the UK excluding London.

Salary trend for Organisational Skills in the UK excluding London

Organisational Skills
Salary Histogram in the UK excluding London

Salary distribution for jobs citing Organisational Skills in the UK excluding London over the 6 months to 20 June 2025.

Salary histogram for Organisational Skills in the UK excluding London

Organisational Skills
Job Locations in the UK excluding London

The table below looks at the demand and provides a guide to the median salaries quoted in IT jobs citing Organisational Skills within the UK excluding London region over the 6 months to 20 June 2025. The 'Rank Change' column provides an indication of the change in demand within each location based on the same 6 month period last year.

Location Rank Change
on Same Period
Last Year
Matching
Permanent
IT Job Ads
Median Salary
Past 6 Months
Median Salary
% Change
on Same Period
Last Year
Live
Jobs
North of England -50 265 £34,500 -1.43% 901
South East -18 245 £36,000 -4.00% 850
North West -22 166 £40,000 +33.33% 473
Midlands -63 118 £45,000 +28.57% 541
East of England -18 109 £29,500 -6.35% 441
Yorkshire -27 81 £26,500 -29.33% 333
South West +5 78 £36,609 +4.60% 338
East Midlands +10 62 £32,000 +1.59% 223
Scotland +70 57 £32,500 +18.18% 222
West Midlands -90 56 £47,500 +11.76% 314
North East +6 18 £40,000 +23.08% 95
Northern Ireland +43 8 £30,000 +7.14% 71
Wales +21 7 £43,388 +58.36% 107
Organisational Skills
UK

Organisational Skills
Co-occurring Skills and Capabilities in the UK excluding London by Category

The follow tables expand on the table above by listing co-occurrences grouped by category. The same employment type, locality and period is covered with up to 20 co-occurrences shown in each of the following categories:

Application Platforms
1 75 (8.46%) Oracle Application Server
2 46 (5.19%) SharePoint
3 34 (3.83%) CMS
4 12 (1.35%) Microsoft Exchange
5 9 (1.01%) IIS
5 9 (1.01%) Tomcat
6 7 (0.79%) Confluence
6 7 (0.79%) WordPress
7 6 (0.68%) Apache
8 3 (0.34%) Kentico
9 2 (0.23%) JOnAS
10 1 (0.11%) OpenStack
10 1 (0.11%) SAS
Applications
1 132 (14.88%) Microsoft Office
2 110 (12.40%) Microsoft Excel
3 36 (4.06%) Microsoft PowerPoint
4 8 (0.90%) Microsoft Project
4 8 (0.90%) Photoshop
5 7 (0.79%) Adobe Creative Suite
6 5 (0.56%) Adobe After Effects
6 5 (0.56%) Spreadsheet
7 3 (0.34%) Adobe Premiere
7 3 (0.34%) AutoCAD
8 2 (0.23%) Adobe Illustrator
8 2 (0.23%) EngageOne
8 2 (0.23%) InDesign
8 2 (0.23%) MS Visio
8 2 (0.23%) Revit
8 2 (0.23%) Trello
9 1 (0.11%) FrameMaker
9 1 (0.11%) MadCap Flare
9 1 (0.11%) Zeplin
Business Applications
1 19 (2.14%) NetSuite
2 13 (1.47%) Magento
3 12 (1.35%) Shopify
4 10 (1.13%) SAP S/4HANA
5 6 (0.68%) Dynamics CRM
6 5 (0.56%) Teamcenter
7 2 (0.23%) Salesforce CRM
7 2 (0.23%) SAP Business One
8 1 (0.11%) Changepoint
8 1 (0.11%) Remedy ITSM
8 1 (0.11%) Sage 200
8 1 (0.11%) SAP MDM
8 1 (0.11%) Visualfiles
Cloud Services
1 83 (9.36%) Azure
2 70 (7.89%) Microsoft 365
3 64 (7.22%) SaaS
4 52 (5.86%) Power Platform
5 34 (3.83%) Entra ID
6 31 (3.49%) AWS
7 30 (3.38%) PaaS
8 24 (2.71%) iPaaS
9 15 (1.69%) BigCommerce
10 14 (1.58%) Azure Data Factory
10 14 (1.58%) Google Analytics
11 12 (1.35%) Google Ads
12 11 (1.24%) Azure Logic Apps
12 11 (1.24%) Dynamics 365
12 11 (1.24%) Microsoft Copilot
13 9 (1.01%) Power Automate
14 7 (0.79%) Facebook Ads
14 7 (0.79%) Google Sheets
15 5 (0.56%) GitHub Actions
15 5 (0.56%) Microsoft Advertising
Communications & Networking
1 26 (2.93%) WAN
2 21 (2.37%) LAN
3 19 (2.14%) Firewall
4 14 (1.58%) Wireless
5 13 (1.47%) Wi-Fi
6 11 (1.24%) Internet
6 11 (1.24%) Remote Desktop
7 10 (1.13%) TCP/IP
8 9 (1.01%) DMARC
8 9 (1.01%) SD-WAN
8 9 (1.01%) SSL
9 8 (0.90%) 5G
10 7 (0.79%) VoIP
11 6 (0.68%) SAN
12 5 (0.56%) iSCSI
13 4 (0.45%) Bluetooth
13 4 (0.45%) Modbus
13 4 (0.45%) RS-232
13 4 (0.45%) RS-485
13 4 (0.45%) ZigBee
Database & Business Intelligence
1 78 (8.79%) Data Warehouse
2 75 (8.46%) Enterprise Data Warehouse
2 75 (8.46%) Oracle Reports
3 51 (5.75%) Power BI
4 38 (4.28%) SQL Server
5 17 (1.92%) MySQL
6 16 (1.80%) PostgreSQL
7 11 (1.24%) Azure SQL Database
8 5 (0.56%) Tableau
9 4 (0.45%) GIS
10 3 (0.34%) Big Data
10 3 (0.34%) Crystal Reports
10 3 (0.34%) Relational Database
11 2 (0.23%) Looker
11 2 (0.23%) MS Access
11 2 (0.23%) SAP HANA
11 2 (0.23%) SQL Server Reporting Services
12 1 (0.11%) MongoDB
12 1 (0.11%) NoSQL
12 1 (0.11%) Oracle Database
Development Applications
1 23 (2.59%) JIRA
2 9 (1.01%) Git
3 5 (0.56%) Rational DOORS
4 3 (0.34%) CircleCI
4 3 (0.34%) Oracle Forms
4 3 (0.34%) webpack
5 2 (0.23%) Jenkins
5 2 (0.23%) Selenium
6 1 (0.11%) gulp
6 1 (0.11%) Visual Studio
General
1 622 (70.12%) Social Skills
2 297 (33.48%) Finance
3 290 (32.69%) Analytical Skills
4 152 (17.14%) Marketing
5 81 (9.13%) Military
6 76 (8.57%) Presentation Skills
7 61 (6.88%) Inclusion and Diversity
7 61 (6.88%) Legal
8 49 (5.52%) Retail
9 42 (4.74%) Law
10 40 (4.51%) Esports
11 34 (3.83%) Manufacturing
12 32 (3.61%) Public Sector
13 24 (2.71%) Telecoms
14 21 (2.37%) Banking
15 19 (2.14%) Advertising
16 17 (1.92%) Documentation Skills
17 16 (1.80%) Electronics
18 12 (1.35%) Czech Language
19 10 (1.13%) Influencing Skills
Job Titles
1 109 (12.29%) Analyst
2 76 (8.57%) IT Support
3 52 (5.86%) Administrator
4 47 (5.30%) Lead
5 39 (4.40%) Project Manager
5 39 (4.40%) Support Analyst
6 37 (4.17%) Senior
7 36 (4.06%) Consultant
7 36 (4.06%) Support Engineer
8 33 (3.72%) 2nd Line Support
9 32 (3.61%) IT Engineer
10 29 (3.27%) IT Support Engineer
11 28 (3.16%) Developer
12 27 (3.04%) 2nd Line Support Analyst
12 27 (3.04%) Architect
13 26 (2.93%) Graduate
14 25 (2.82%) Database Engineer
15 23 (2.59%) Coordinator
16 20 (2.25%) Applications Architect
16 20 (2.25%) IT Architect
Libraries, Frameworks & Software Standards
1 18 (2.03%) HTML
2 12 (1.35%) REST
3 11 (1.24%) XML
4 10 (1.13%) .NET
4 10 (1.13%) JSON
4 10 (1.13%) SOAP
5 8 (0.90%) CSS
6 7 (0.79%) React
7 6 (0.68%) .NET Core
8 5 (0.56%) AngularJS
8 5 (0.56%) RESTful
9 3 (0.34%) Blazor
9 3 (0.34%) Laravel
9 3 (0.34%) OAuth
9 3 (0.34%) Oracle Fusion
9 3 (0.34%) Sass
9 3 (0.34%) Vue
10 2 (0.23%) ADO
10 2 (0.23%) Lightning Web Components
10 2 (0.23%) Symfony
Miscellaneous
1 125 (14.09%) Self-Motivation
2 89 (10.03%) Social Media
3 38 (4.28%) Driving Licence
4 29 (3.27%) Onboarding
5 26 (2.93%) EPoS
5 26 (2.93%) Product Ownership
6 24 (2.71%) Greenfield Project
7 21 (2.37%) Management Information System
8 20 (2.25%) Analytical Mindset
9 18 (2.03%) Mobile App
10 17 (1.92%) SCADA
11 15 (1.69%) Algorithms
12 13 (1.47%) Operational Technology
12 13 (1.47%) Team-Oriented Environment
13 10 (1.13%) Renewable Energy
14 9 (1.01%) Enterprise Software
15 8 (0.90%) Cloud Native
15 8 (0.90%) Data Centre
15 8 (0.90%) Digital Signage
15 8 (0.90%) Self-Driving Car
Operating Systems
1 144 (16.23%) Windows
2 57 (6.43%) Windows Vista
3 19 (2.14%) Linux
3 19 (2.14%) Windows 10
4 18 (2.03%) Android
5 9 (1.01%) Unix
6 8 (0.90%) Windows 7
6 8 (0.90%) Windows Server
7 5 (0.56%) Red Hat Enterprise Linux
7 5 (0.56%) Windows Server 2019
8 4 (0.45%) FreeRTOS
9 3 (0.34%) Mac OS
10 2 (0.23%) VMS
11 1 (0.11%) AIX
11 1 (0.11%) Windows 8
11 1 (0.11%) Windows Server 2008
Processes & Methodologies
1 237 (26.72%) Problem-Solving
2 214 (24.13%) Agile
3 198 (22.32%) Time Management
4 139 (15.67%) Project Management
5 134 (15.11%) Analytics
6 110 (12.40%) Data Management
7 109 (12.29%) CRM
8 103 (11.61%) Customer Service
9 100 (11.27%) ERP
10 99 (11.16%) ITIL
11 92 (10.37%) Business Analysis
12 87 (9.81%) Continuous Improvement
13 86 (9.70%) Customer Experience
14 84 (9.47%) DevOps
15 81 (9.13%) Data Modelling
16 80 (9.02%) Service Management
17 76 (8.57%) Data Integration
18 75 (8.46%) Collaborative Working
19 74 (8.34%) Migration
20 73 (8.23%) Stakeholder Management
Programming Languages
1 75 (8.46%) SQL
2 32 (3.61%) JavaScript
3 28 (3.16%) Python
4 23 (2.59%) Java
5 17 (1.92%) C#
6 16 (1.80%) PHP
7 13 (1.47%) VBA
8 11 (1.24%) PowerShell
9 8 (0.90%) Delphi
10 5 (0.56%) Bash
10 5 (0.56%) Korn
11 4 (0.45%) C
11 4 (0.45%) C++
12 3 (0.34%) R
13 2 (0.23%) Shell Script
13 2 (0.23%) T-SQL
13 2 (0.23%) VB.NET
Qualifications
1 166 (18.71%) Degree
2 161 (18.15%) DBS Check
3 41 (4.62%) Security Cleared
4 37 (4.17%) SC Cleared
5 19 (2.14%) Master's Degree
6 14 (1.58%) Computer Science Degree
7 8 (0.90%) CBAP
8 7 (0.79%) ACCA
8 7 (0.79%) CIMA
8 7 (0.79%) HND
9 6 (0.68%) BPSS Clearance
10 5 (0.56%) CISM
10 5 (0.56%) CISSP
11 3 (0.34%) CRISC
11 3 (0.34%) HNC
11 3 (0.34%) PMI Certification
11 3 (0.34%) PMP
12 2 (0.23%) AAT
12 2 (0.23%) Azure Certification
12 2 (0.23%) Microsoft Certification
Quality Assurance & Compliance
1 42 (4.74%) SLA
2 21 (2.37%) PMO
2 21 (2.37%) QA
3 19 (2.14%) ISO/IEC 27001
4 14 (1.58%) GDPR
5 11 (1.24%) Data Quality
6 5 (0.56%) Accessibility
6 5 (0.56%) Actionable Recommendations
7 4 (0.45%) GRC
7 4 (0.45%) ISO 14001
7 4 (0.45%) ISO 9001
7 4 (0.45%) PCI DSS
7 4 (0.45%) WCAG
8 2 (0.23%) GxP
8 2 (0.23%) IEC 62304
8 2 (0.23%) ISO 13485
8 2 (0.23%) ISO 20022
8 2 (0.23%) SEPA
9 1 (0.11%) GMP
9 1 (0.11%) NEBOSH
System Software
1 56 (6.31%) Active Directory
2 11 (1.24%) Docker
3 9 (1.01%) Hyper-V
4 6 (0.68%) VMware Infrastructure
5 5 (0.56%) Citrix Hypervisor
6 4 (0.45%) Embedded Firmware
6 4 (0.45%) Firmware
7 1 (0.11%) Virtual Servers
Systems Management
1 21 (2.37%) Microsoft Intune
2 11 (1.24%) Kubernetes
3 9 (1.01%) Single Sign-On
4 8 (0.90%) Jamf Pro
5 5 (0.56%) SmoothWall
6 3 (0.34%) Automic
6 3 (0.34%) SCCM
7 1 (0.11%) Backup Exec
7 1 (0.11%) EMC NetWorker
7 1 (0.11%) NetBackup
7 1 (0.11%) Panaseer
7 1 (0.11%) Terraform
Vendors
1 229 (25.82%) Microsoft
2 97 (10.94%) Oracle
3 36 (4.06%) Google
3 36 (4.06%) SAP
4 32 (3.61%) Salesforce
5 25 (2.82%) Alteryx
6 20 (2.25%) Cisco
6 20 (2.25%) Zoho
7 14 (1.58%) Meraki
8 13 (1.47%) Adobe
8 13 (1.47%) Sage
9 8 (0.90%) Facebook
10 7 (0.79%) Concur
10 7 (0.79%) JD Edwards
11 6 (0.68%) Fortinet
11 6 (0.68%) SonicWALL
11 6 (0.68%) TikTok
11 6 (0.68%) VMware
11 6 (0.68%) WatchGuard
11 6 (0.68%) Xero