Microsoft Excel Jobs in the UK excluding London

Microsoft Excel
UK > UK excluding London

The table below provides summary statistics for permanent job vacancies advertised in the UK excluding London requiring Microsoft Excel skills. It includes a benchmarking guide to the annual salaries offered in vacancies that cited Microsoft Excel over the 6 months leading up to 28 May 2025, comparing them to the same period in the previous two years.

6 months to
28 May 2025
Same period 2024 Same period 2023
Rank 102 52 79
Rank change year-on-year -50 +27 +17
Permanent jobs citing Microsoft Excel 1,129 3,263 2,442
As % of all permanent jobs advertised in the UK excluding London 2.90% 4.43% 4.18%
As % of the Applications category 24.65% 44.08% 43.36%
Number of salaries quoted 688 1,609 1,112
10th Percentile £25,625 £23,750 £24,525
25th Percentile £29,750 £26,750 £30,500
Median annual salary (50th Percentile) £40,874 £36,736 £36,988
Median % change year-on-year +11.27% -0.68% -7.53%
75th Percentile £51,240 £47,500 £48,750
90th Percentile £60,000 £60,000 £58,750
UK median annual salary £45,000 £40,000 £43,500
% change year-on-year +12.50% -8.05% -3.33%

All Software Application Skills
UK excluding London

Microsoft Excel falls under the Software Applications category. For comparison with the information above, the following table provides summary statistics for all permanent job vacancies requiring software application skills in the UK excluding London.

Permanent vacancies with a requirement for software application skills 4,581 7,402 5,632
As % of all permanent jobs advertised in the UK excluding London 11.78% 10.05% 9.65%
Number of salaries quoted 2,366 4,541 2,836
10th Percentile £26,750 £23,500 £24,000
25th Percentile £35,000 £26,250 £28,894
Median annual salary (50th Percentile) £49,500 £35,000 £37,500
Median % change year-on-year +41.43% -6.67% -4.63%
75th Percentile £58,895 £49,500 £52,250
90th Percentile £66,200 £62,000 £65,000
UK median annual salary £50,000 £38,500 £44,666
% change year-on-year +29.87% -13.80% -0.74%

Microsoft Excel
Job Vacancy Trend in the UK excluding London

Job postings citing Microsoft Excel as a proportion of all IT jobs advertised in the UK excluding London.
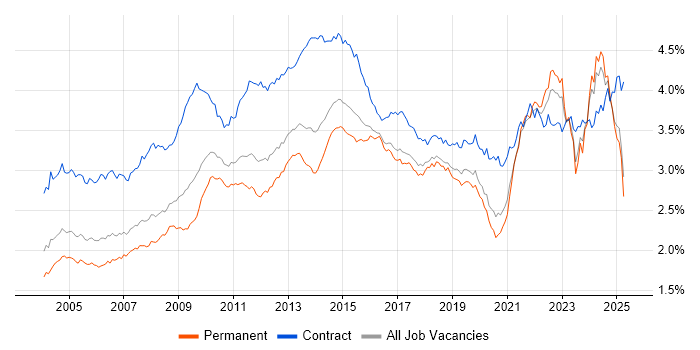
Job vacancy trend for Microsoft Excel in the UK excluding London

Microsoft Excel
Salary Trend in the UK excluding London

3-month moving average salary quoted in jobs citing Microsoft Excel in the UK excluding London.

Salary trend for Microsoft Excel in the UK excluding London

Microsoft Excel
Salary Histogram in the UK excluding London

Salary distribution for jobs citing Microsoft Excel in the UK excluding London over the 6 months to 28 May 2025.

Salary histogram for Microsoft Excel in the UK excluding London

Microsoft Excel
Job Locations in the UK excluding London

The table below looks at the demand and provides a guide to the median salaries quoted in IT jobs citing Microsoft Excel within the UK excluding London region over the 6 months to 28 May 2025. The 'Rank Change' column provides an indication of the change in demand within each location based on the same 6 month period last year.

Location Rank Change
on Same Period
Last Year
Matching
Permanent
IT Job Ads
Median Salary
Past 6 Months
Median Salary
% Change
on Same Period
Last Year
Live
Jobs
North of England -1 466 £50,055 +49.12% 1,036
North West -4 395 £50,055 +43.01% 512
South East -111 193 £35,000 -16.67% 1,482
Midlands -86 170 £35,000 -6.67% 861
East of England -39 115 £31,000 -4.62% 624
West Midlands -58 111 £37,500 -2.60% 476
South West +20 108 £49,500 +32.00% 501
Scotland +12 62 £52,000 +48.57% 202
Yorkshire 0 60 £35,000 - 412
East Midlands -66 59 £31,500 -1.56% 328
North East +5 11 £39,100 +30.33% 117
Northern Ireland +30 7 - - 73
Wales -34 6 £50,221 +76.21% 109
Channel Islands +1 2 £87,500 +29.63% 8
Isle of Man +6 1 £31,000 -27.06%
Microsoft Excel
UK

Microsoft Excel
Co-occurring Skills and Capabilities in the UK excluding London by Category

The follow tables expand on the table above by listing co-occurrences grouped by category. The same employment type, locality and period is covered with up to 20 co-occurrences shown in each of the following categories:

Application Platforms
1 26 (2.30%) SharePoint
2 11 (0.97%) CMS
3 10 (0.89%) Confluence
4 9 (0.80%) WordPress
5 8 (0.71%) Microsoft Exchange
6 7 (0.62%) Apache Spark
6 7 (0.62%) IBM Domino
7 3 (0.27%) Jupyter
Applications
1 470 (41.63%) Microsoft Office
2 444 (39.33%) Microsoft PowerPoint
3 71 (6.29%) Microsoft Project
4 25 (2.21%) Spreadsheet
5 20 (1.77%) MS Visio
6 3 (0.27%) Photoshop
7 1 (0.089%) EPLAN
7 1 (0.089%) Siemens NX
Business Applications
1 173 (15.32%) Teamcenter
2 10 (0.89%) SAP S/4HANA
3 9 (0.80%) Dynamics CRM
4 8 (0.71%) Oracle EBS
5 7 (0.62%) Dynamics NAV
6 6 (0.53%) Dynamics GP
7 5 (0.44%) NetSuite
8 4 (0.35%) SAP BPC
9 3 (0.27%) iTrent
9 3 (0.27%) Markit EDM
9 3 (0.27%) Maximo
9 3 (0.27%) Oracle SCM
10 2 (0.18%) Sage 200
10 2 (0.18%) SAP GTS
10 2 (0.18%) Shopify
11 1 (0.089%) Dynamics AX
11 1 (0.089%) Infor M3
11 1 (0.089%) NEC Housing
11 1 (0.089%) Oracle ERP
11 1 (0.089%) SAP MDM
Cloud Services
1 233 (20.64%) Power Platform
2 95 (8.41%) Azure
3 87 (7.71%) Microsoft 365
4 28 (2.48%) Google Analytics
5 19 (1.68%) Entra ID
6 17 (1.51%) Google Ads
6 17 (1.51%) Google Workspace
7 11 (0.97%) Power Automate
8 9 (0.80%) Azure Data Factory
8 9 (0.80%) Dynamics 365
8 9 (0.80%) Google Sheets
8 9 (0.80%) SaaS
9 8 (0.71%) Figma
10 6 (0.53%) GCP
10 6 (0.53%) SuccessFactors
11 5 (0.44%) Azure Synapse Analytics
11 5 (0.44%) Canva
11 5 (0.44%) Google Data Studio
11 5 (0.44%) Miro
11 5 (0.44%) Smartsheet
Communications & Networking
1 34 (3.01%) Firewall
2 20 (1.77%) DNS
3 19 (1.68%) DHCP
4 18 (1.59%) TCP/IP
5 16 (1.42%) Intranet
6 12 (1.06%) BGP
6 12 (1.06%) Internet
6 12 (1.06%) OSPF
6 12 (1.06%) VLAN
6 12 (1.06%) WLAN
7 10 (0.89%) LAN
8 8 (0.71%) Remote Desktop
9 6 (0.53%) Network Security
10 5 (0.44%) Wireless
11 4 (0.35%) Wi-Fi
12 2 (0.18%) Fibre Channel
12 2 (0.18%) iSCSI
12 2 (0.18%) NAS
12 2 (0.18%) SAN
12 2 (0.18%) VoIP
Database & Business Intelligence
1 231 (20.46%) Power BI
2 87 (7.71%) Tableau
3 26 (2.30%) BusinessObjects
4 24 (2.13%) MS Access
5 22 (1.95%) Power Query
6 21 (1.86%) SQL Server
7 20 (1.77%) SQL Server Reporting Services
8 19 (1.68%) Data Mining
9 11 (0.97%) Big Data
9 11 (0.97%) Data Lake
9 11 (0.97%) Data Warehouse
9 11 (0.97%) SQL Server Integration Services
10 10 (0.89%) Oracle Reports
11 9 (0.80%) Metadata
12 8 (0.71%) Metadata Repository
12 8 (0.71%) PowerPivot
13 6 (0.53%) Data Hub
13 6 (0.53%) Relational Database
14 5 (0.44%) Qlik Sense
15 4 (0.35%) Ataccama
Development Applications
1 51 (4.52%) JIRA
2 7 (0.62%) Git
3 6 (0.53%) NDoc
4 5 (0.44%) Subversion
5 4 (0.35%) Balsamiq
5 4 (0.35%) GitLab
6 3 (0.27%) RStudio
7 2 (0.18%) Maven
7 2 (0.18%) SQL Server Management Studio (SSMS)
7 2 (0.18%) Visual Studio
8 1 (0.089%) ClearCase
8 1 (0.089%) ClearQuest
8 1 (0.089%) Rational DOORS
General
1 650 (57.57%) Social Skills
2 314 (27.81%) Finance
3 243 (21.52%) Analytical Skills
4 195 (17.27%) Automotive
5 179 (15.85%) Aerospace
6 95 (8.41%) Marketing
7 89 (7.88%) Organisational Skills
8 77 (6.82%) Retail
9 58 (5.14%) Presentation Skills
10 46 (4.07%) Inclusion and Diversity
10 46 (4.07%) Manufacturing
11 43 (3.81%) Telecoms
12 30 (2.66%) Banking
13 29 (2.57%) Legal
14 23 (2.04%) Military
15 21 (1.86%) Advertising
15 21 (1.86%) Public Sector
16 19 (1.68%) Law
17 16 (1.42%) Influencing Skills
18 11 (0.97%) Local Government
Job Titles
1 262 (23.21%) Analyst
2 187 (16.56%) Systems Engineer
3 96 (8.50%) Project Manager
4 89 (7.88%) Data Analyst
5 71 (6.29%) Administrator
6 65 (5.76%) Senior
7 45 (3.99%) Financial Analyst
8 44 (3.90%) Developer
9 42 (3.72%) Assistant Project Manager
10 36 (3.19%) Junior
10 36 (3.19%) Support Analyst
11 33 (2.92%) Principal Engineer
12 30 (2.66%) IT Support
12 30 (2.66%) Lead
13 29 (2.57%) Account Executive
14 28 (2.48%) Business Analyst
14 28 (2.48%) Senior Systems Engineer
15 27 (2.39%) Data Manager
16 26 (2.30%) Procurement Analyst
17 25 (2.21%) Integration Engineer
Libraries, Frameworks & Software Standards
1 13 (1.15%) XML
2 12 (1.06%) .NET
3 7 (0.62%) EDI
4 6 (0.53%) Pandas
5 5 (0.44%) .NET Framework
5 5 (0.44%) HTML
6 4 (0.35%) Blazor
6 4 (0.35%) Middleware
6 4 (0.35%) ODBC
6 4 (0.35%) WPF
7 3 (0.27%) ADO
8 2 (0.18%) Drools
8 2 (0.18%) JSON
8 2 (0.18%) Lightning Web Components
8 2 (0.18%) PySpark
8 2 (0.18%) SAP XI
9 1 (0.089%) OAuth
9 1 (0.089%) OpenID
9 1 (0.089%) Regular Expression
9 1 (0.089%) SAML
Miscellaneous
1 100 (8.86%) Management Information System
2 44 (3.90%) Self-Motivation
3 36 (3.19%) Social Media
4 35 (3.10%) Data Structures
5 30 (2.66%) Onboarding
6 22 (1.95%) Data Protection Act
7 20 (1.77%) Driving Licence
8 19 (1.68%) FMCG
9 13 (1.15%) Analytical Mindset
9 13 (1.15%) Legacy Systems
9 13 (1.15%) Product Ownership
10 12 (1.06%) Smartphone
11 10 (0.89%) e-Learning
11 10 (0.89%) Pricing Data
12 9 (0.80%) NHS
13 8 (0.71%) Life Science
13 8 (0.71%) Social Network
14 7 (0.62%) Data Centre
15 6 (0.53%) IoT
16 5 (0.44%) Renewable Energy
Operating Systems
1 73 (6.47%) Windows
2 35 (3.10%) Windows Server
3 25 (2.21%) Windows 10
4 12 (1.06%) Linux
4 12 (1.06%) Mac OS X
4 12 (1.06%) Ubuntu
4 12 (1.06%) Windows Server 2016
4 12 (1.06%) Windows Server 2019
5 6 (0.53%) Windows 7
6 4 (0.35%) Android
6 4 (0.35%) Windows Vista
Processes & Methodologies
1 223 (19.75%) Problem-Solving
2 209 (18.51%) Analytics
3 208 (18.42%) Business Intelligence
4 206 (18.25%) Customer Service
5 190 (16.83%) Data Analysis
6 187 (16.56%) Systems Engineering
7 177 (15.68%) PLM
8 158 (13.99%) Data Management
9 123 (10.89%) Decision-Making
10 114 (10.10%) Visualisation
11 106 (9.39%) Time Management
12 105 (9.30%) Continuous Improvement
13 104 (9.21%) Process Improvement
14 102 (9.03%) Data Analytics
15 101 (8.95%) ERP
16 100 (8.86%) Project Management
17 74 (6.55%) Stakeholder Management
18 72 (6.38%) Project Delivery
19 71 (6.29%) Actionable Insight
20 69 (6.11%) Customer Experience
Programming Languages
1 195 (17.27%) SQL
2 174 (15.41%) MATLAB
3 57 (5.05%) Python
4 43 (3.81%) VBA
5 25 (2.21%) PowerShell
6 22 (1.95%) Data Analysis Expressions
7 13 (1.15%) Java
7 13 (1.15%) T-SQL
8 12 (1.06%) R
9 9 (0.80%) C#
9 9 (0.80%) C++
10 8 (0.71%) VB
11 7 (0.62%) Bash
12 5 (0.44%) JavaScript
13 4 (0.35%) Delphi
13 4 (0.35%) Julia
13 4 (0.35%) XAML
14 3 (0.27%) PL/SQL
14 3 (0.27%) VB.NET
15 2 (0.18%) SQR
Qualifications
1 410 (36.32%) Degree
2 223 (19.75%) BPSS Clearance
3 188 (16.65%) HNC
4 184 (16.30%) HND
5 63 (5.58%) DBS Check
6 30 (2.66%) ACCA
7 27 (2.39%) CIMA
8 25 (2.21%) Security Cleared
9 22 (1.95%) SC Cleared
10 20 (1.77%) Microsoft Certification
11 17 (1.51%) Master's Degree
12 14 (1.24%) MBA
13 13 (1.15%) Computer Science Degree
14 12 (1.06%) MCSE
15 6 (0.53%) Azure Certification
15 6 (0.53%) PMI Certification
16 5 (0.44%) ITIL Certification
17 4 (0.35%) MRICS
17 4 (0.35%) Numerate Degree
18 3 (0.27%) AAT
Quality Assurance & Compliance
1 101 (8.95%) Data Quality
2 44 (3.90%) SLA
3 21 (1.86%) QA
4 16 (1.42%) GDPR
5 13 (1.15%) ISO/IEC 27001
6 12 (1.06%) PMO
7 7 (0.62%) Accessibility
8 3 (0.27%) ISO 14001
8 3 (0.27%) ISO 9001
9 2 (0.18%) COBIT
9 2 (0.18%) GRC
10 1 (0.089%) Actionable Recommendations
10 1 (0.089%) IFRS
10 1 (0.089%) ITGC
10 1 (0.089%) NIST
10 1 (0.089%) Sarbanes-Oxley
System Software
1 63 (5.58%) Active Directory
2 10 (0.89%) Hyper-V
3 4 (0.35%) VMware Infrastructure
4 1 (0.089%) Virtual Machines
Systems Management
1 4 (0.35%) Microsoft Intune
2 1 (0.089%) AirWatch
2 1 (0.089%) PaperCut
2 1 (0.089%) Single Sign-On
2 1 (0.089%) Systems Management Server (SMS)
Vendors
1 693 (61.38%) Microsoft
2 173 (15.32%) ANSYS
3 90 (7.97%) SAP
4 68 (6.02%) Google
5 41 (3.63%) YouTube
6 33 (2.92%) Facebook
7 32 (2.83%) Salesforce
8 22 (1.95%) Oracle
9 17 (1.51%) NEC
10 13 (1.15%) Apple
10 13 (1.15%) Cisco
10 13 (1.15%) IFS
11 12 (1.06%) Dell
11 12 (1.06%) Fortinet
11 12 (1.06%) Ubiquiti
12 11 (0.97%) Adobe
12 11 (0.97%) Capita
12 11 (0.97%) Databricks
13 10 (0.89%) Anaplan
13 10 (0.89%) Instagram